UCSD Quantifying Instruction Criticality Eric Tune Dean Tullsen
- Slides: 24
UCSD Quantifying Instruction Criticality Eric Tune, Dean Tullsen, Brad Calder UC San Diego, CSE Dept.
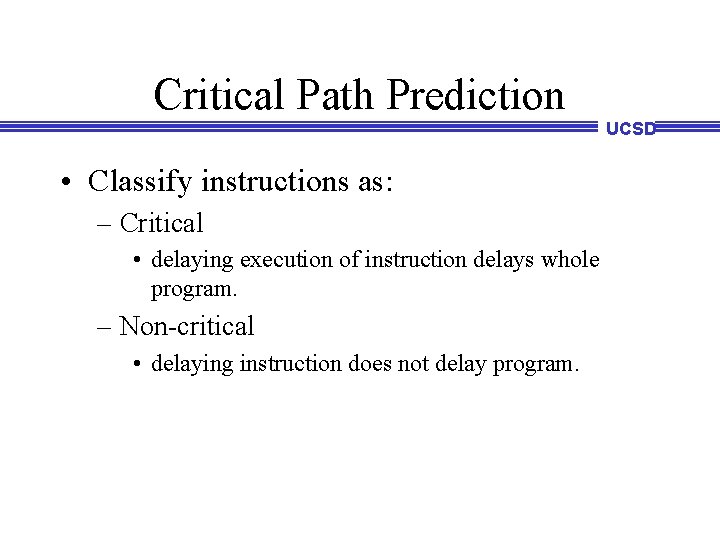
Critical Path Prediction UCSD • Classify instructions as: – Critical • delaying execution of instruction delays whole program. – Non-critical • delaying instruction does not delay program.
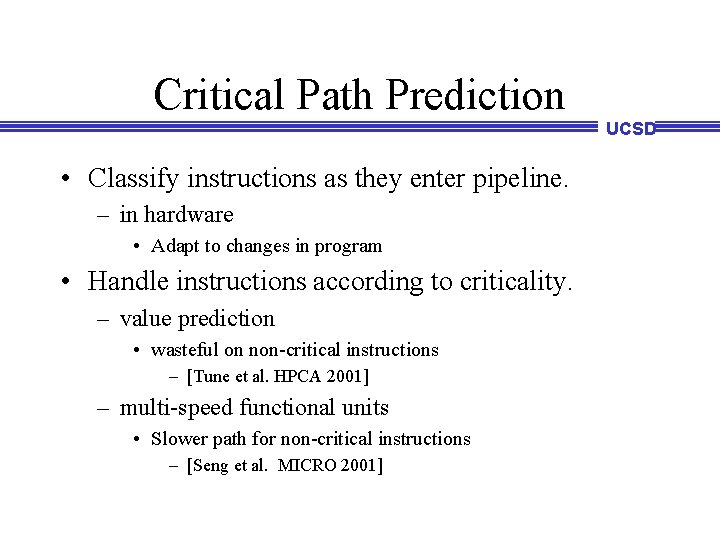
Critical Path Prediction UCSD • Classify instructions as they enter pipeline. – in hardware • Adapt to changes in program • Handle instructions according to criticality. – value prediction • wasteful on non-critical instructions – [Tune et al. HPCA 2001] – multi-speed functional units • Slower path for non-critical instructions – [Seng et al. MICRO 2001]
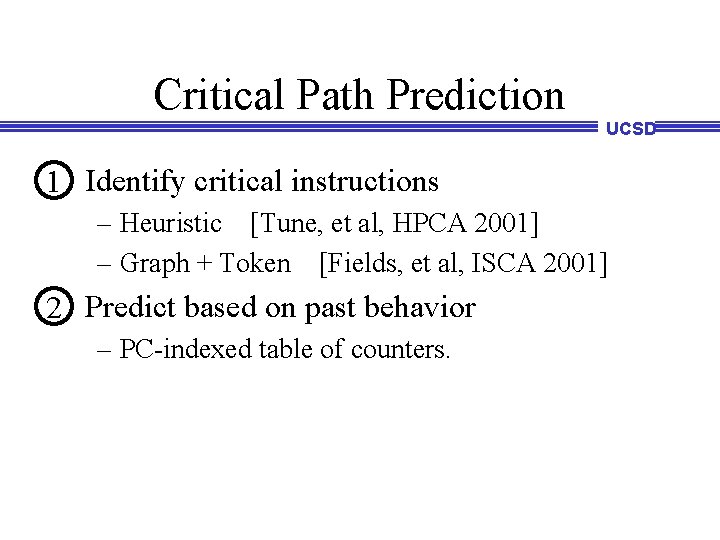
Critical Path Prediction UCSD 1 Identify critical instructions – Heuristic [Tune, et al, HPCA 2001] – Graph + Token [Fields, et al, ISCA 2001] 2 Predict based on past behavior – PC-indexed table of counters.
Goals UCSD • Build framework to ask questions about critical path. – Compare graph-based critical path model to detailed simulation. – Develop finer classification than critical/noncritical • Find best instructions to “optimize”. – Study how criticality of static instructions vary. • Improve prediction accuracy
Our approach UCSD • Run detailed simulation • Build graph representation. – 3 -node graph model of Fields, et al. – extended to model issue width • Tool computes effect of changes to graph. – Delay or advance when single instruction produces result. – Determine effect on program runtime. – Repeat for every instruction – Dont have to recompute whole graph.
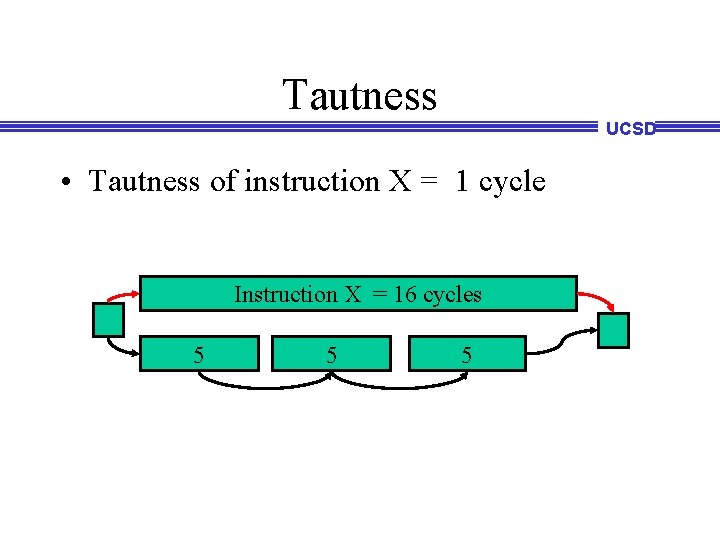
Tautness/Slack UCSD • Slack – Delay an instructions result until it affects runtime. • Tautness – Make an instructions result available when it is fetched, measure reduction in runtime. – Not all critical instructions equally good targets for optimization.
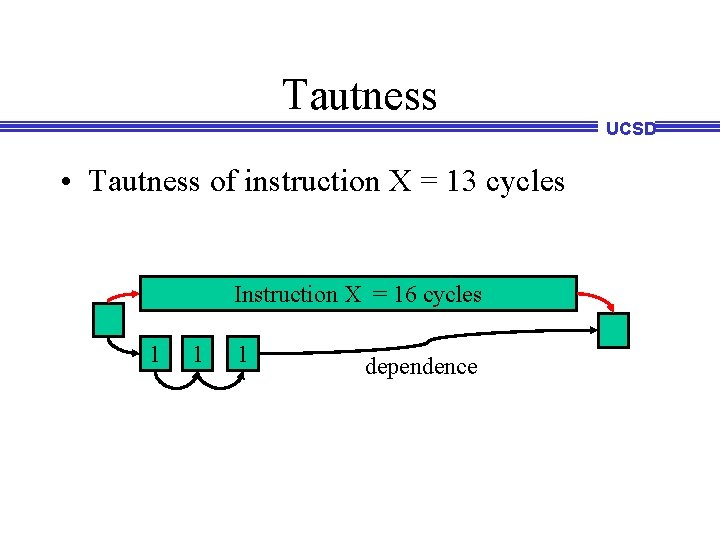
Tautness UCSD • Tautness of instruction X = 13 cycles Instruction X = 16 cycles 1 1 1 dependence
Tautness UCSD • Tautness of instruction X = 1 cycle Instruction X = 16 cycles 5 5 5
Tautness UCSD • Approximates benefit from “optimizing” instruction. • Not same as latency of instruction.
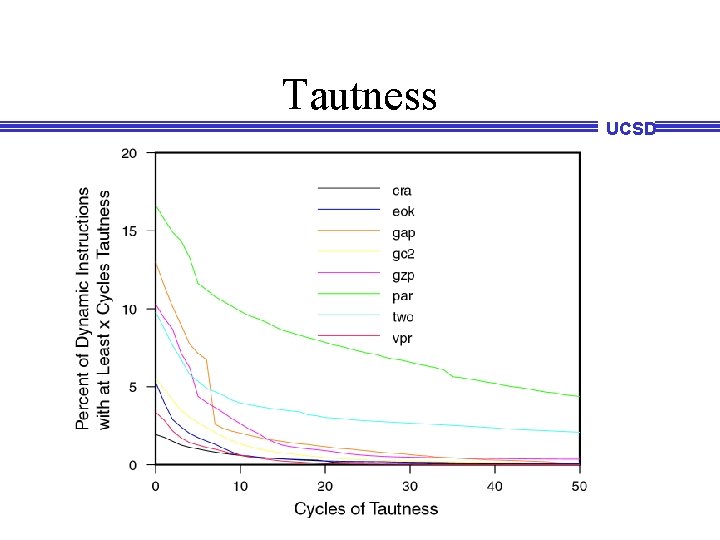
Tautness UCSD
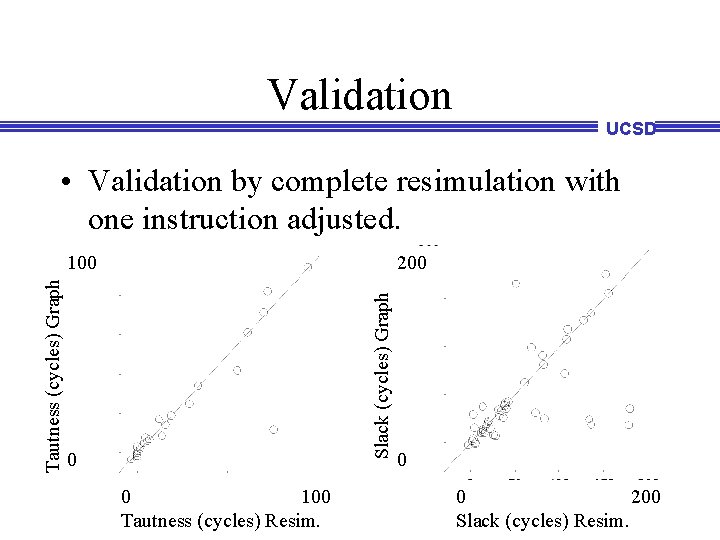
Validation UCSD • Validation by complete resimulation with one instruction adjusted. 200 Slack (cycles) Graph Tautness (cycles) Graph 100 0 0 100 Tautness (cycles) Resim. 0 0 200 Slack (cycles) Resim.
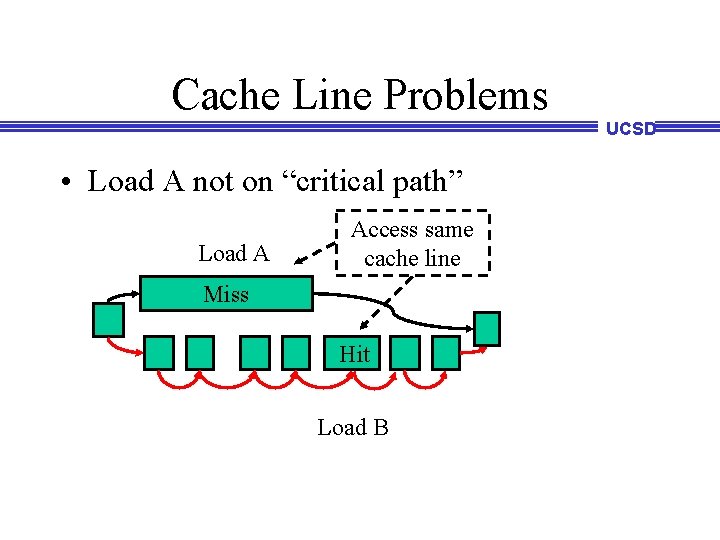
Cache Line Problems UCSD • Load A not on “critical path” Load A Access same cache line Miss Hit Load B
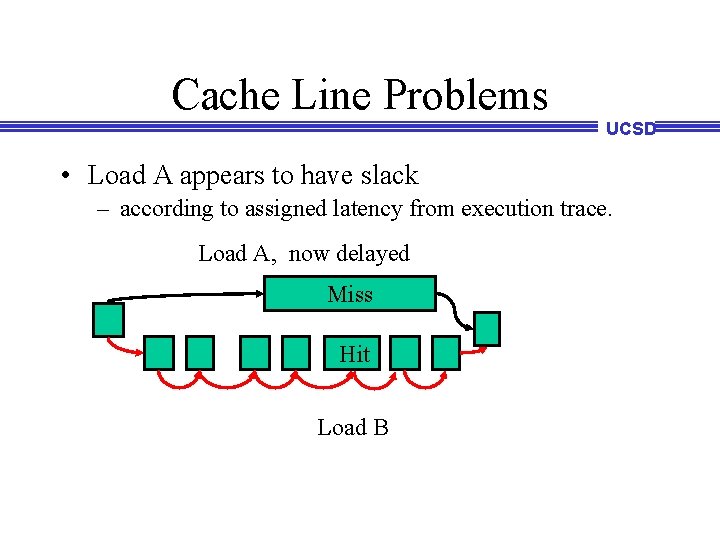
Cache Line Problems UCSD • Load A appears to have slack – according to assigned latency from execution trace. Load A, now delayed Miss Hit Load B
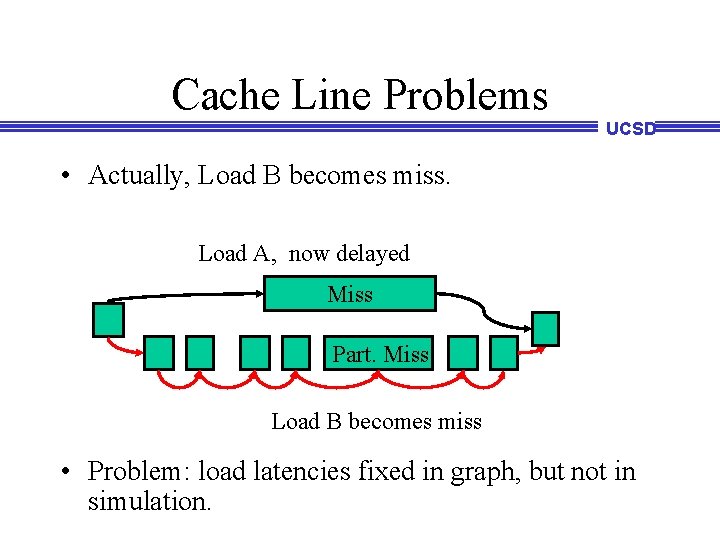
Cache Line Problems UCSD • Actually, Load B becomes miss. Load A, now delayed Miss Part. Miss Load B becomes miss • Problem: load latencies fixed in graph, but not in simulation.
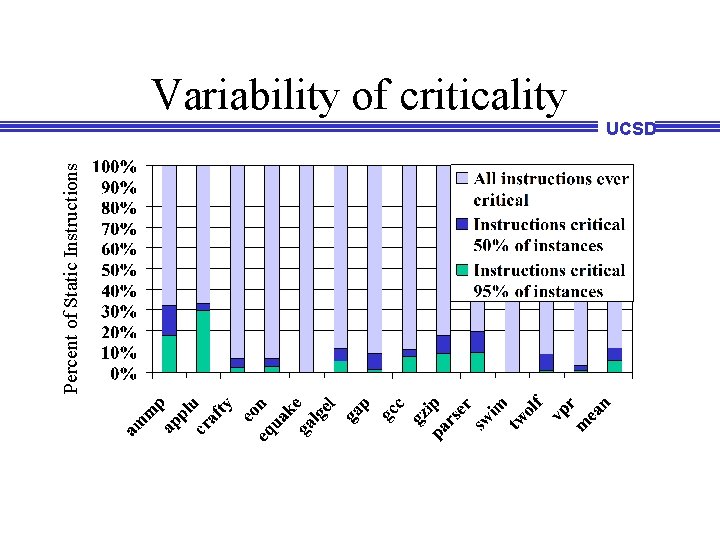
Variability of criticality Percent of Static Instructions UCSD
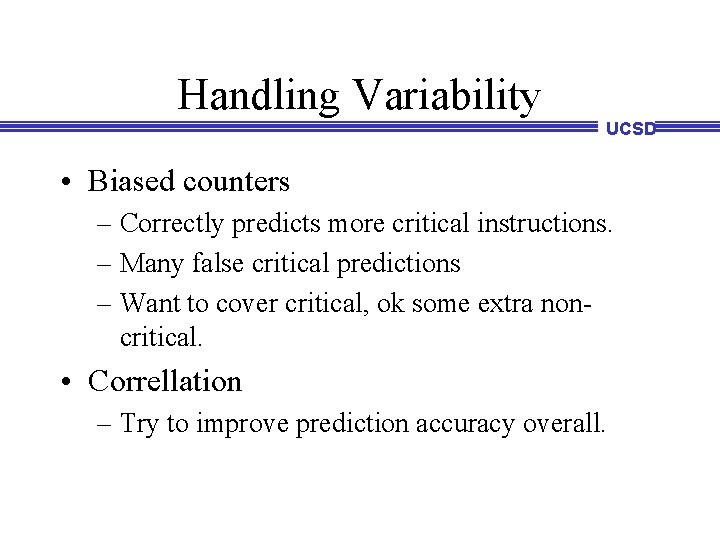
Handling Variability UCSD • Biased counters – Correctly predicts more critical instructions. – Many false critical predictions – Want to cover critical, ok some extra noncritical. • Correllation – Try to improve prediction accuracy overall.
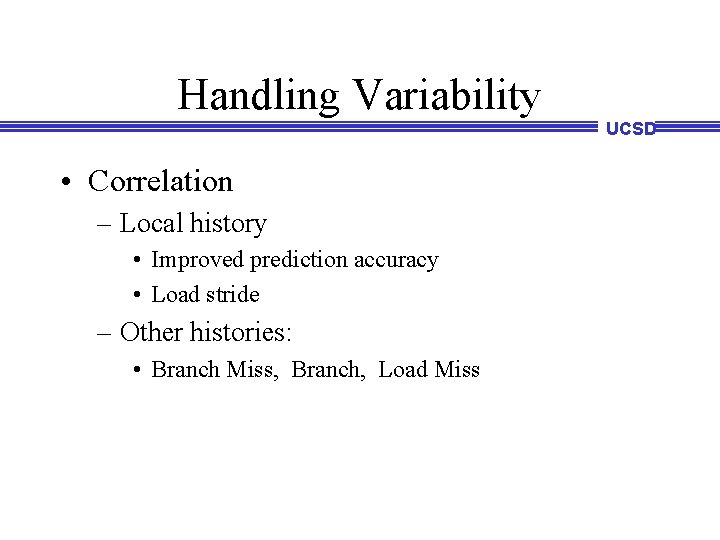
Handling Variability UCSD • Correlation – Local history • Improved prediction accuracy • Load stride – Other histories: • Branch Miss, Branch, Load Miss
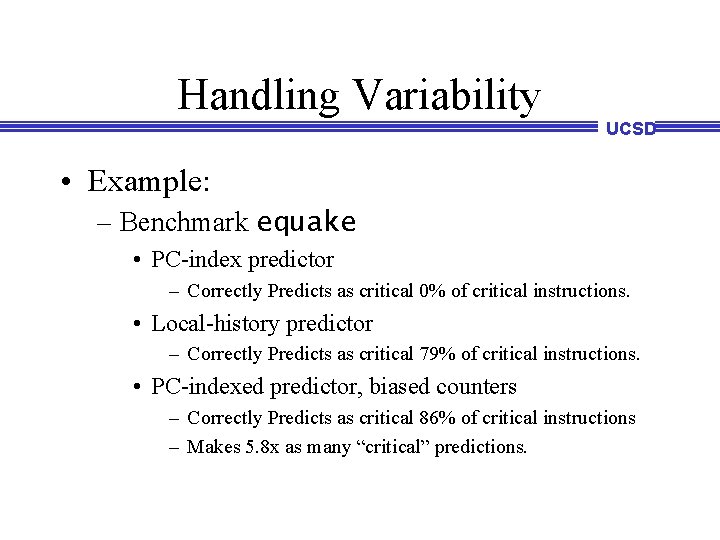
Handling Variability UCSD • Example: – Benchmark equake • PC-index predictor – Correctly Predicts as critical 0% of critical instructions. • Local-history predictor – Correctly Predicts as critical 79% of critical instructions. • PC-indexed predictor, biased counters – Correctly Predicts as critical 86% of critical instructions – Makes 5. 8 x as many “critical” predictions.
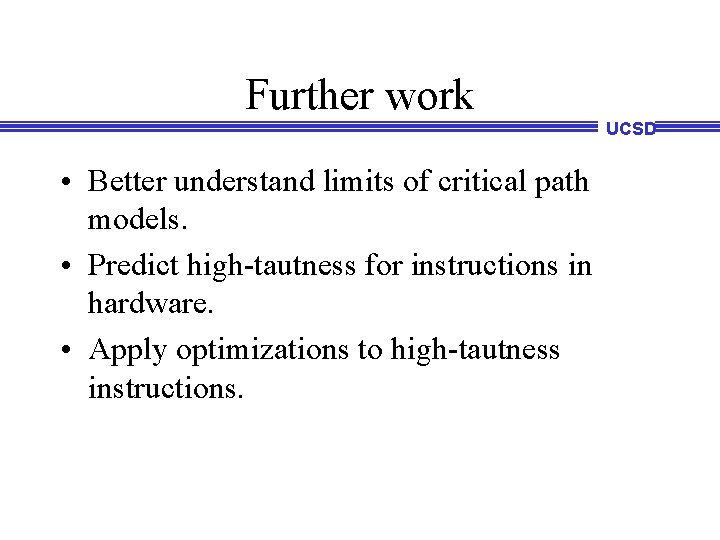
Further work UCSD • Better understand limits of critical path models. • Predict high-tautness for instructions in hardware. • Apply optimizations to high-tautness instructions.
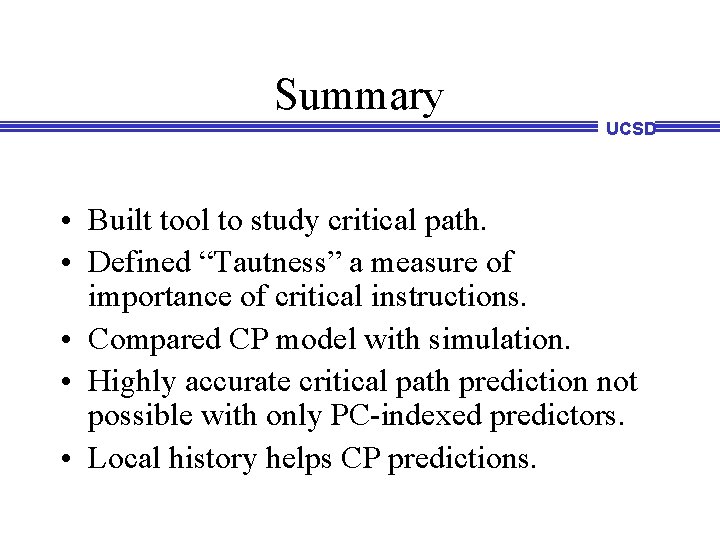
Summary UCSD • Built tool to study critical path. • Defined “Tautness” a measure of importance of critical instructions. • Compared CP model with simulation. • Highly accurate critical path prediction not possible with only PC-indexed predictors. • Local history helps CP predictions.
UCSD
Stop UCSD
UCSD