
Tune Diagram Measurements in the PS Myrsini Kaitatzi

- Slides: 26
Tune Diagram Measurements in the PS Myrsini Kaitatzi, Alexander Huschauer Acknowledgements: F. Asvesta, H. Bartosik, M. Giovannozzi, PSB and PS OP team MSWG Meeting, 10 August 2018
Outline • Introduction • Tune diagram measurements • Measurements performed in 2012 • Measurements performed in 2018 • Conclusions and Outlook
Introduction • Loss map measurements are conducted to investigate resonances • Comparison of measurements from 2012 and 2018 • Investigate the magnetic stability of the machine • Investigation of remnant magnetic effects of sextupoles, octupoles and PFW • Furthermore, we will investigate the impact of changing the resonance crossing speed on the results • To do this we perform tune scans, varying the tune of a large transverse emittance beam in the PS dynamically, and observing the loss rate
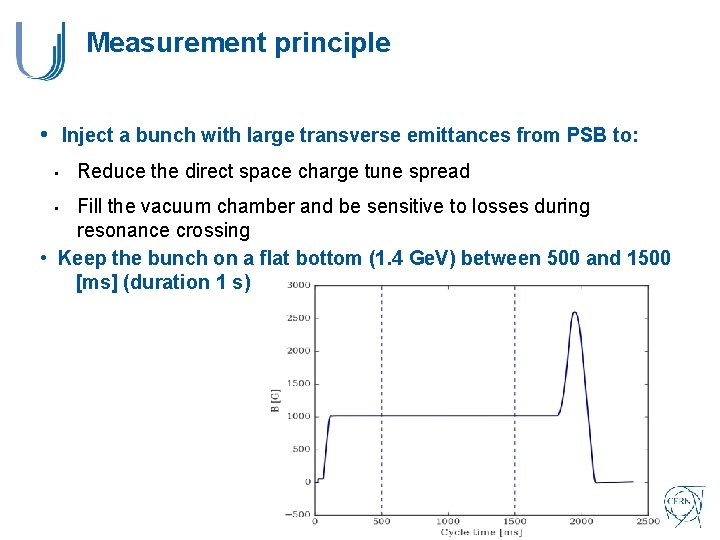
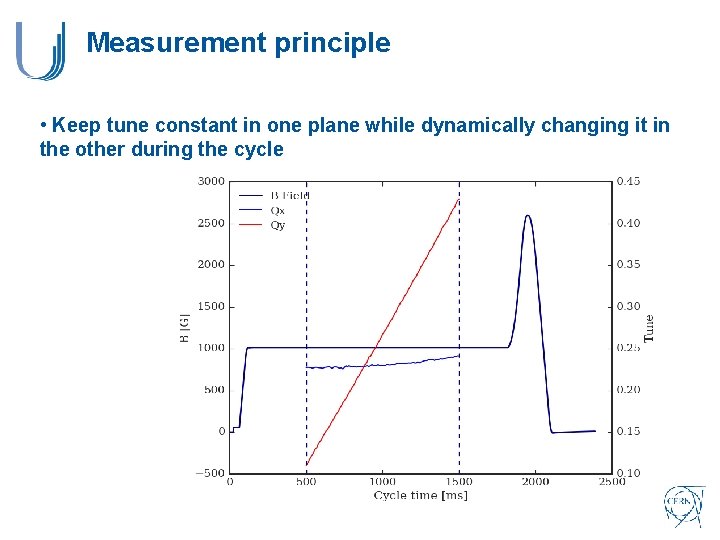
Measurement principle • Inject a bunch with large transverse emittances from PSB to: • Reduce the direct space charge tune spread Fill the vacuum chamber and be sensitive to losses during resonance crossing • Keep the bunch on a flat bottom (1. 4 Ge. V) between 500 and 1500 [ms] (duration 1 s) •
Measurement principle • Keep tune constant in one plane while dynamically changing it in the other during the cycle
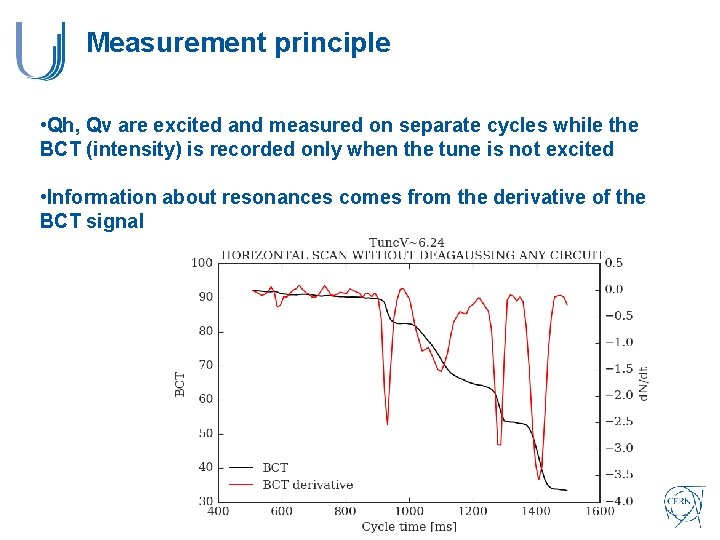
Measurement principle • Qh, Qv are excited and measured on separate cycles while the BCT (intensity) is recorded only when the tune is not excited • Information about resonances comes from the derivative of the BCT signal
Outline • Introduction • Tune diagram measurements • Measurements performed in 2012 • Measurements performed in 2018 • Conclusions and Outlook
Measurements performed in 2012 • The main focus was on measurements at the LIU injection energy at 2 Ge. V • To perform the measurements at 2 Ge. V the PFW were used due to insufficient strength in the LEQ
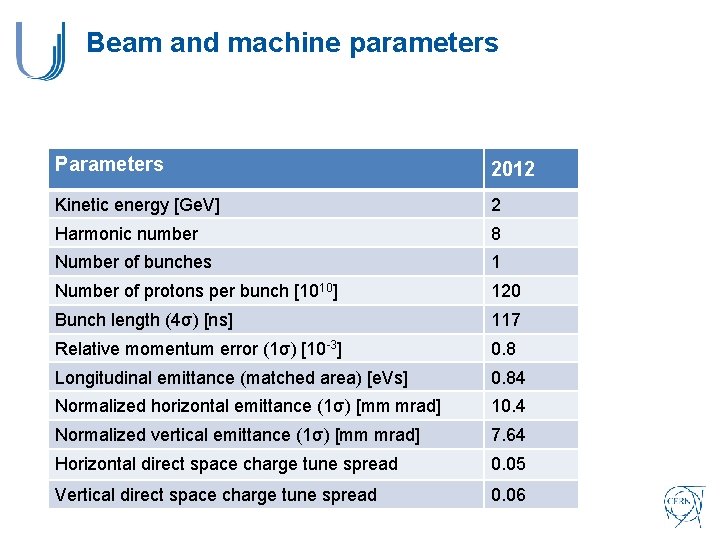
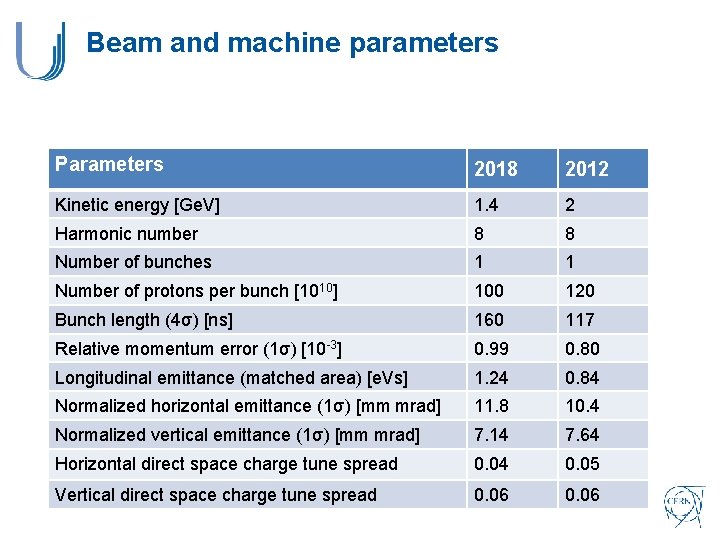
Beam and machine parameters Parameters 2012 Kinetic energy [Ge. V] 2 Harmonic number 8 Number of bunches 1 Number of protons per bunch [1010] 120 Bunch length (4σ) [ns] 117 Relative momentum error (1σ) [10 -3] 0. 8 Longitudinal emittance (matched area) [e. Vs] 0. 84 Normalized horizontal emittance (1σ) [mm mrad] 10. 4 Normalized vertical emittance (1σ) [mm mrad] 7. 64 Horizontal direct space charge tune spread 0. 05 Vertical direct space charge tune spread 0. 06
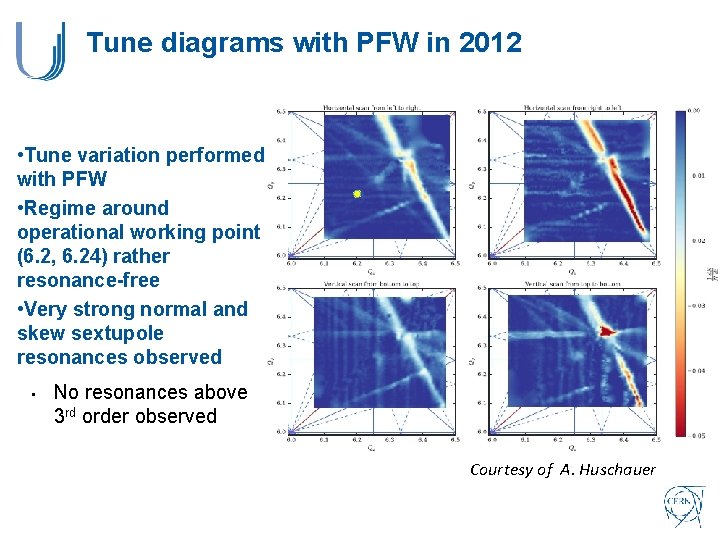
Tune diagrams with PFW in 2012 • Tune variation performed with PFW • Regime around operational working point (6. 2, 6. 24) rather resonance-free • Very strong normal and skew sextupole resonances observed • No resonances above 3 rd order observed Courtesy of A. Huschauer
Outline • Introduction • Tune diagram measurements • Measurements performed in 2012 • Measurements performed in 2018 • Conclusions and Outlook
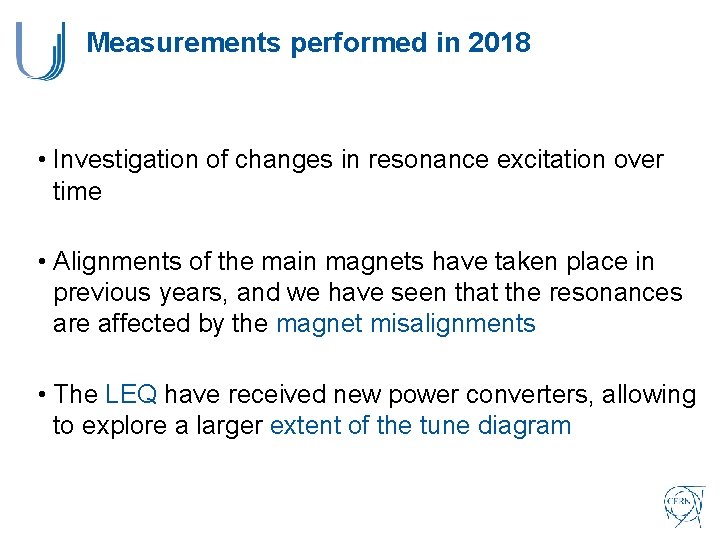
Measurements performed in 2018 • Investigation of changes in resonance excitation over time • Alignments of the main magnets have taken place in previous years, and we have seen that the resonances are affected by the magnet misalignments • The LEQ have received new power converters, allowing to explore a larger extent of the tune diagram
Beam and machine parameters Parameters 2018 2012 Kinetic energy [Ge. V] 1. 4 2 Harmonic number 8 8 Number of bunches 1 1 Number of protons per bunch [1010] 100 120 Bunch length (4σ) [ns] 160 117 Relative momentum error (1σ) [10 -3] 0. 99 0. 80 Longitudinal emittance (matched area) [e. Vs] 1. 24 0. 84 Normalized horizontal emittance (1σ) [mm mrad] 11. 8 10. 4 Normalized vertical emittance (1σ) [mm mrad] 7. 14 7. 64 Horizontal direct space charge tune spread 0. 04 0. 05 Vertical direct space charge tune spread 0. 06
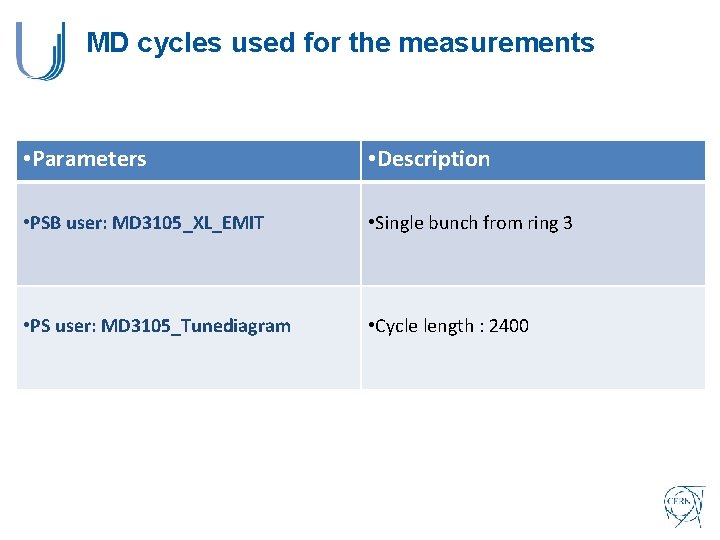
MD cycles used for the measurements • Parameters • Description • PSB user: MD 3105_XL_EMIT • Single bunch from ring 3 • PS user: MD 3105_Tunediagram • Cycle length : 2400
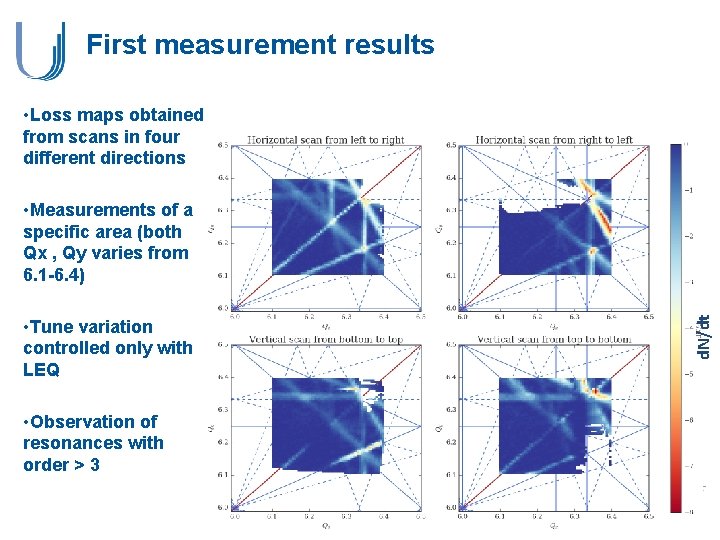
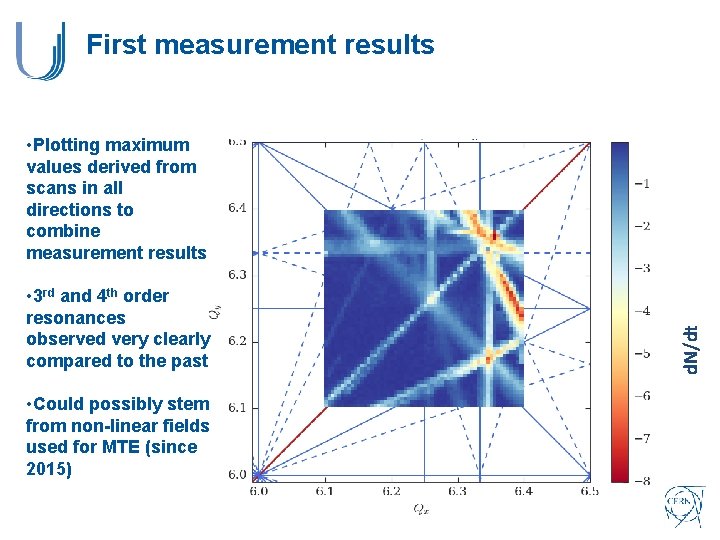
First measurement results • Loss maps obtained from scans in four different directions • Tune variation controlled only with LEQ • Observation of resonances with order > 3 d. N/dt • Measurements of a specific area (both Qx , Qy varies from 6. 1 -6. 4)
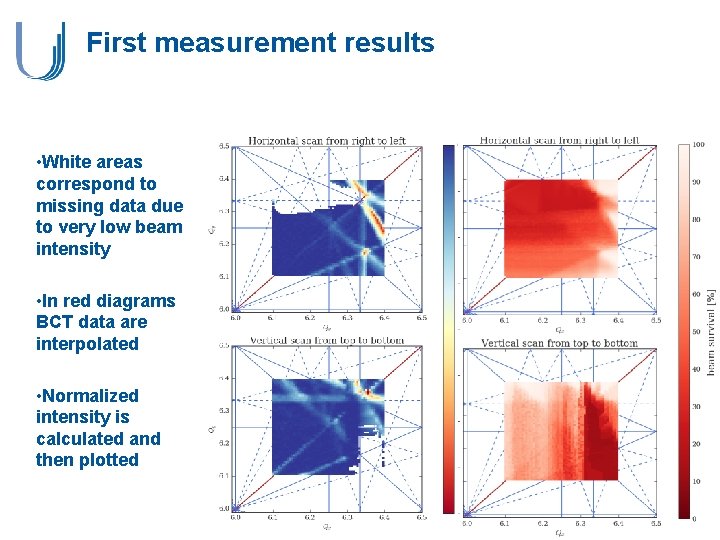
First measurement results • White areas correspond to missing data due to very low beam intensity • In red diagrams BCT data are interpolated • Normalized intensity is calculated and then plotted
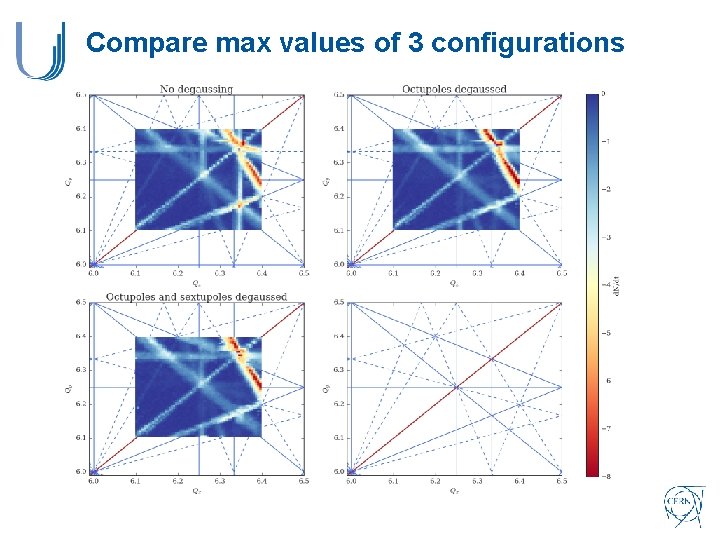
First measurement results • 3 rd and 4 th order resonances observed very clearly compared to the past • Could possibly stem from non-linear fields used for MTE (since 2015) d. N/dt • Plotting maximum values derived from scans in all directions to combine measurement results
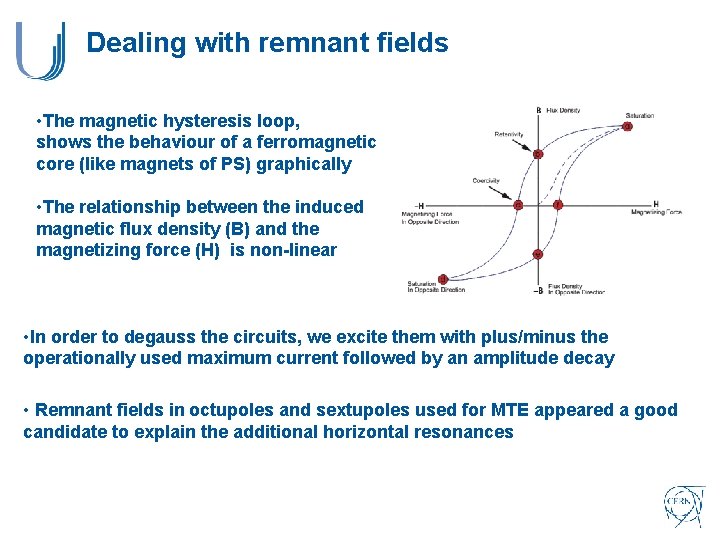
Dealing with remnant fields • The magnetic hysteresis loop, shows the behaviour of a ferromagnetic core (like magnets of PS) graphically • The relationship between the induced magnetic flux density (B) and the magnetizing force (H) is non-linear • In order to degauss the circuits, we excite them with plus/minus the operationally used maximum current followed by an amplitude decay • Remnant fields in octupoles and sextupoles used for MTE appeared a good candidate to explain the additional horizontal resonances
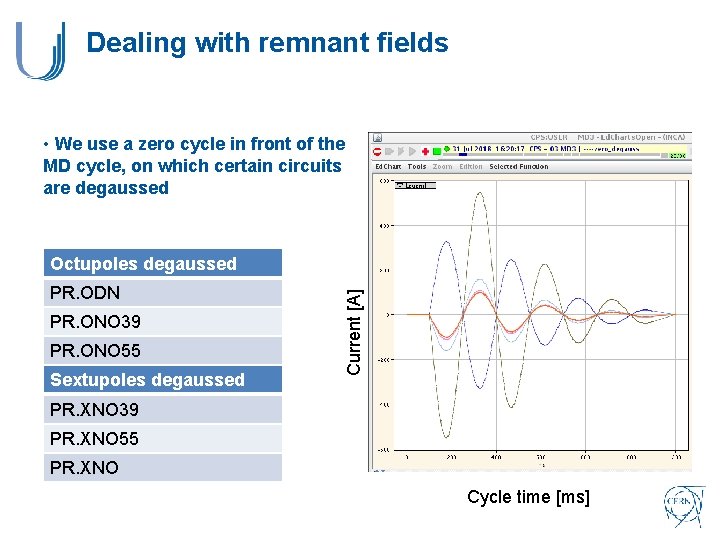
Dealing with remnant fields • We use a zero cycle in front of the MD cycle, on which certain circuits are degaussed PR. ODN PR. ONO 39 PR. ONO 55 Sextupoles degaussed Current [A] Octupoles degaussed PR. XNO 39 PR. XNO 55 PR. XNO Cycle time [ms]
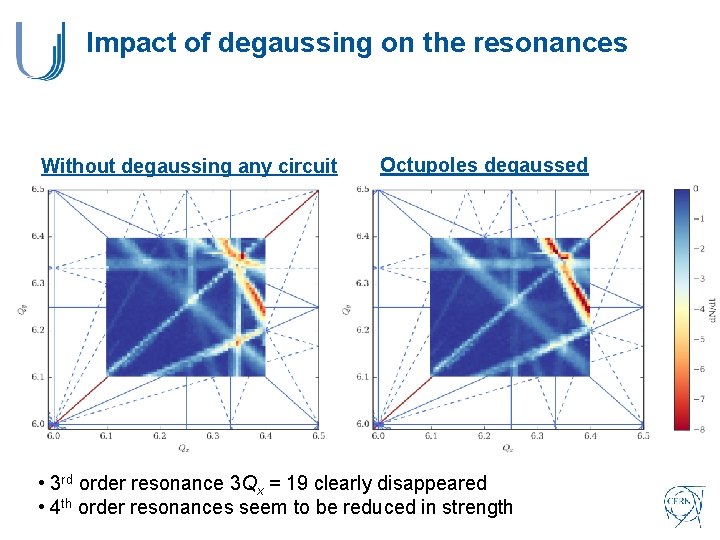
Impact of degaussing on the resonances Without degaussing any circuit Octupoles degaussed • 3 rd order resonance 3 Qx = 19 clearly disappeared • 4 th order resonances seem to be reduced in strength
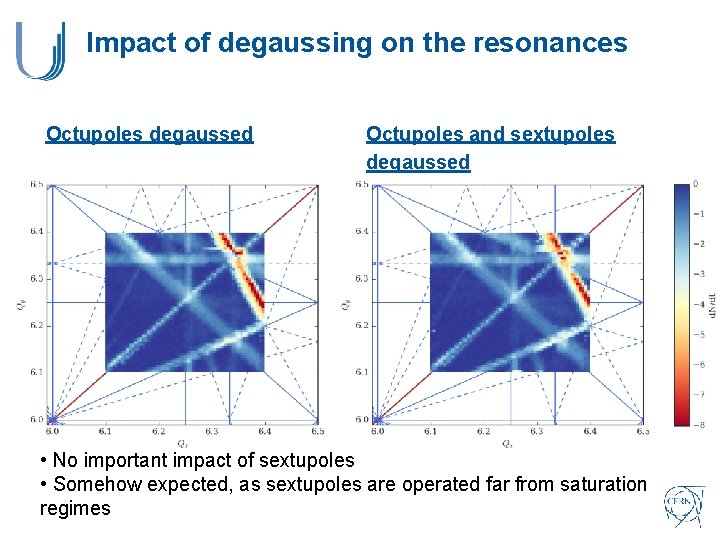
Impact of degaussing on the resonances Octupoles degaussed Octupoles and sextupoles degaussed • No important impact of sextupoles • Somehow expected, as sextupoles are operated far from saturation regimes
Compare max values of 3 configurations
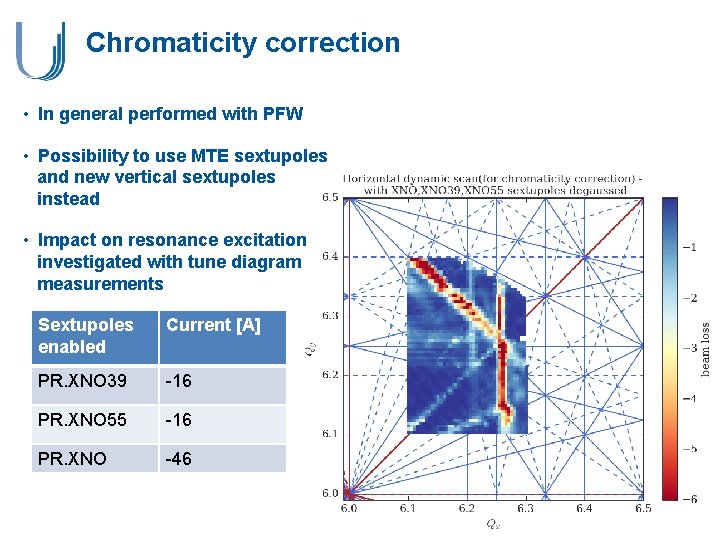
Chromaticity correction • In general performed with PFW • Possibility to use MTE sextupoles and new vertical sextupoles instead • Impact on resonance excitation investigated with tune diagram measurements Sextupoles enabled Current [A] PR. XNO 39 -16 PR. XNO 55 -16 PR. XNO -46
Outline • Introduction about tune diagrams in PS • Tune diagram measurements • Measurements performed in 2012 • Measurements performed in 2018 • Conclusions and Outlook
Conclusions and Outlook • Tune diagram measurements revealed very different resonance excitation with respect to 2012 • Important effects of remnant fields observed • Octupoles seem to be main contributors • Less impact of sextupoles observed • Impact of PFW to degauss the main magnets to be investigated • Chromaticity correction with dedicated sextupoles instead of PFW strongly excites additional resonances • Further measurements to clearly identify the octupolar circuit with highest remnant field • Amplitude detuning measurements using the TFB as AC dipole • Investigating the impact of resonance crossing speed on the resulting tune diagrams
THANK YOU FOR YOUR ATTENTION!