The University of the State of New York


- Slides: 51

The University of the State of New York REGENTS HIGH SCHOOL EXAMINATION PHYSICAL SETTING EARTH SCIENCE Thursday, January 26, 2012

1. Which planet’s day (period of rotation) is longer than its year (period of revolution)? 1. 2. 3. 4. Mercury Venus Jupiter Saturn

2. Which event is cyclic and predictable? 1. a volcano erupting above a subducting tectonic plate 2. an earthquake occurring at the San Andreas Fault 3. Jupiter’s apparent movement across the night sky 4. an asteroid striking Earth’s surface

3. A high tide occurred at 6: 00 a. m. at a beach on Long Island. The next high tide at this same beach would occur at approximately 1. 12: 15 p. m. on the same day 2. 6: 30 p. m. on the same day 3. 12: 45 p. m. on the following day 4. 7: 00 a. m. on the following day

4. The best evidence that Earth rotates on its axis is the changing 1. phases of the Moon 2. altitude of the noontime Sun from day to day 3. apparent path of a Foucault pendulum 4. velocity of Earth in its orbit

5. The curving of the planetary winds to the right in the Northern Hemisphere is evidence of 1. 2. 3. 4. the Coriolis effect high- and low-pressure belts Earth’s revolution the tilt of Earth’s axis

6. Which star is cooler and less luminous than the Sun? 1. 2. 3. 4. Proxima Centauri Pollux Rigel 40 Eridani B

7. Seasonal changes on Earth are primarily caused by the 1. parallelism of the Sun’s axis as the Sun revolves around Earth 2. changes in distance between Earth and the Sun 3. elliptical shape of Earth’s orbit around the Sun 4. tilt of Earth’s axis as Earth revolves around the Sun

8. A ship is at a location of 40° S 77° W. Which type of surface ocean current and tectonic plate boundary are located beneath this ship? 1. warm ocean current and a transform boundary 2. warm ocean current and a convergent boundary 3. cool ocean current and a transform boundary 4. cool ocean current and a convergent boundary

9. What best explains why, in early spring, ice remains longer on Lake Erie than on the surrounding land areas when the air temperature is above freezing? 1. Water has a higher specific heat than land. 2. Energy is needed for water to evaporate. 3. Cool winds from the surrounding land cool the ice on the lake. 4. Air temperature does not affect water temperature.

10. What controls the direction of movement of most surface ocean currents? 1. density differences at various ocean depths 2. varying salt content in the ocean 3. prevailing winds 4. seismic activity

11. Due to radioactive decay, an igneous rock sample now contains one-fourth of the amount of potassium-40 that it originally contained. The age, in years, of this rock sample is approximately 1. 0. 7 109 y 2. 1. 3 109 y 3. 2. 6 109 y 4. 5. 2 109 y

12. Which geologic event occured in New York State at about the same time as the extinction of dinosaurs and ammonoids? 1. formation of the Queenston Delta 2. deposition of the sands and clays underlying Long Island 3. initial opening of the Atlantic Ocean 4. advance and retreat of the last continental ice sheet

13. The geologic cross section below shows bedrock layers A through D. Line XY is a fault. The fault most likely occurred after 1. all bedrock layers were formed 2. layer C formed, but before layer D formed 3. layer A formed, but before layer B formed 4. layer B formed, but before layer C formed

14. The Gulf Stream and North Atlantic Current modify the climate of northwestern Europe by making the climate 1. 2. 3. 4. warmer and drier warmer and more humid cooler and drier cooler and more humid

15. What is the approximate density of a mineral with a mass of 262. 2 grams that displaces 46 cubic centimeters of water? 1. 2. 3. 4. 1. 8 g/cm 3 5. 7 g/cm 3 6. 1 g/cm 3 12. 2 g/cm 3

16. Obsidian’s glassy texture indicates that it formed 1. slowly, deep below Earth’s surface 2. slowly, on Earth’s surface 3. quickly, deep below Earth’s surface 4. quickly, on Earth’s surface

17. What is the color and type of rock that forms oceanic crust at mid-ocean ridges? 1. 2. 3. 4. light colored and igneous light colored and sedimentary dark colored and igneous dark colored and sedimentary

18. A plane traveling in a straight line from Watertown to Utica would fly over which landscape region? 1. 2. 3. 4. Tug Hill Plateau Adirondack Mountains St. Lawrence Lowlands Champlain Lowlands

19. Which graph best represents the correct relationship between the discharge of a river and the particle size that can be transported by that river? 1. 2. 3. 4. (1) (2) (3) (4)

20. The diagram below shows the relative positions of Earth and Mars in their orbits on a particular date during the winter of 2007. 1. 2. 3. 4. (1) (2) (3) (4)

21. A cross section of a weather front is shown below. 1. 2. 3. 4. (1) (2) (3) (4)

22. According to the Big Bang theory, which graph best represents the relationship between time and the size of the universe from the beginning of the universe to the present? 1. 2. 3. 4. (1) (2) (3) (4)

23. Which map below shows the most likely storm track for a hurricane ( ) in the Atlantic Ocean? 1. 2. 3. 4. (1) (2) (3) (4)

24. The weather map below shows isobars labeled in millibars. Points A, B, C, and D are locations on Earth’s surface. Which location was probably experiencing the highest wind speed? 1. 2. 3. 4. A B C D

25. The map below shows two seasonal positions of the polar front jet stream over North America. Which statement best explains why the position of the polar front jet stream varies with the seasons? 1. Rising air compresses and cools in winter. 2. Water heats and cools more rapidly than land in winter. 3. Prevailing winds reverse direction in summer. 4. The vertical rays of the Sun shift north of the equator in summer.

26. The cross section below shows two cities, A and B, at different elevations. Compared to the yearly temperature and precipitation at city B, city A most likely has 1. lower temperatures and less precipitation 2. lower temperatures and more precipitation 3. higher temperatures and less precipitation 4. higher temperatures and more precipitation

27. The graph below shows changes in carbon dioxide concentrations in Earth’s atmosphere over a 140 -year period. Carbon dioxide concentrations are shown in parts per million (ppm). This significant change in CO 2 concentration is most likely caused by 1. 2. 3. 4. decreased cloud cover, and is predicted to decrease average global temperatures decreased volcanic activity, and is predicted to increase average global temperatures increased use of fossil fuels, and is predicted to increase average global temperatures increased El Niño activity, and is predicted to decrease average global temperatures

28. The solar system object in the photograph below is 56 kilometers long. The object in the photograph is most likely 1. 2. 3. 4. an asteroid Neptune Earth’s Moon Mercury

29. Which graph best shows the range of density in each of Earth’s layers? 1. 2. 3. 4. (1) (2) (3) (4)

30. Which world map shows the locations where most earthquakes and volcanoes occur on Earth? 1. 2. 3. 4. (1) (2) (3) (4)

31. Which graph shows the general relationship between soil particle size and the capillarity of the soil? 1. 2. 3. 4. (1) (2) (3) (4)

32. The diagram below is a portion of a geologic timeline. Letters A through D represent the time intervals between the labeled events, as estimated by scientists. Fossil evidence indicates that the earliest birds developed during which time interval? 1. 2. 3. 4. A B C D

33. The block diagram below shows a volcano. Which map shows the stream drainage pattern that most likely formed on the surface of this volcano? 1. 2. 3. 4. (1) (2) (3) (4)

34. A cross section of Niagara Falls is shown below. Which two rock units appear to be most resistant to weathering and erosion? 1. 2. 3. 4. Lockport dolostone and Whirlpool sandstone Rochester shale and Albion sandstone and shale Clinton limestone and shale and Queenston shale Thorold sandstone and Queenston shale

35. Which index fossil has been found in Ordovician-age bedrock? 1. 2. 3. 4. (1) (2) (3) (4)

36. Point A is located 7600 kilometers from the epicenter of this earthquake. How many minutes did it take the first S-wave to reach point A? 1. 2. 3. 4. 9 min 11 min 16 min 20 min

37. How many kilometers did the seismic waves travel from the earthquake directly to the outside of the outer core? 1. 2. 3. 4. 800 km 1400 km 2900 km 6400 km

38. Which force was mostly responsible for the contraction of the gas cloud? 1. 2. 3. 4. friction gravity magnetism inertia

39. Which process was occurring during some of these stages that resulted in the formation of heavier elements from lighter elements? 1. 2. 3. 4. conduction radiation radioactive decay nuclear fusion

40. Approximately how long ago did stage 4 end and stage 5 begin? 1. 2. 3. 4. 1 billion years 5 billion years 20 billion years 100 billion years

41. Compared to the terrestrial planets, the Jovian planets in stage 5 have 1. larger diameters 2. higher densities 3. shorter periods of revolution 4. longer periods of rotation

42. Which New York State weather station had clear skies? 1. 2. 3. 4. Albany Buffalo New York City Syracuse

43. Which weather station had the highest relative humidity? 1. 2. 3. 4. A B C D

44. What was the probable air pressure, in millibars, at station D? 1. 2. 3. 4. 1015. 0 mb 1017. 0 mb 1021. 0 mb 1036. 0 mb

45. Which weather information shown at station B was measured with an anemometer and weather vane? 1. 2. 3. 4. (1) (2) (3) (4)

46. The elongated hills labeled R are most useful in determining the 1. age of the glacier 2. direction the glacier has moved 3. thickness of the glacier 4. rate at which the glacier is melting

47. Which feature will most likely form when the partially buried ice block melts? 1. 2. 3. 4. drumlin moraine kettle lake finger lake

48. The ridge of sediments from X to Y can best be described as 1. sorted and deposited by ice 2. sorted and deposited by meltwater 3. unsorted and deposited by ice 4. unsorted and deposited by meltwater

49. Which celestial object is shown in the photograph near the center of the star trails? 1. 2. 3. 4. the Sun the Moon Sirius Polaris

50. During the time exposure of the photograph, the stars appear to have moved through an arc of 120°. How many hours did this time exposure take? 1. 2. 3. 4. 5 h 8 h 12 h 15 h
 Nurse practitioner association of new york state
 New york tap application
 New york state teacher certification exams
 New york state standards science
 Nys math test 2016
 Nerfc
Nerfc State vegetable of new york
 New york state environmental facilities corporation
 New york state professional firefighters association
 Nysiis training
 New york state association of transportation engineers
 Nys industries for the disabled
 Department of criminal justice services ny
 Nysrc
Nysrc Latham traffic circle
 Nys dtf wt tax payment
 Nys rn scope of practice
 New york state fish
 New york state nickname
 New york state medicaid prior authorization
 New york state amateur hockey association
 New york state county highway superintendents association
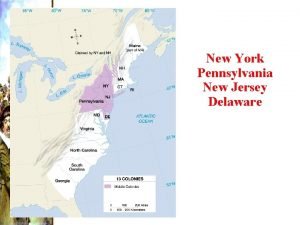
 New york, new jersey, pennsylvania, and delaware
 The orchard new hartford ny
 Articles of confederation characteristics
 Leanne keene french ambassador arrives from paris
 York university bad reputation
 Moodle york
 York university computer science
 Richard anderson york university
 Brenton diaz
 Faculty of education york
 Jeff edmonds york university
 David phipps york university
 Weather model reflection
 Yorksharevle
 Student accommodation university of york
 D jay rahn
 Business etiquette in new york
 Gitlow v new york constitutional question
 Merriweather library buffalo new york
 East and west egg great gatsby
 A famous author candy bar
 Taoki new york
 Philadelphia map outline
 New york kurosu
 New york college of traditional chinese medicine manhattan
 Upfront new york times
 Ccta new york
 New york lega
 New york harm reduction educators
 Zone di new york


