A Comparison of New York State Mesonet Precipitation

 Operations NERFC QPE and Gauge Assimilation")


 1. 2 1. 1 1.")
 1. 05 1")
 0. 52 0.")
 1. 2 1 0. 98 1")


 1. 8 1.")


- Slides: 28
A Comparison of New York State Mesonet Precipitation Data Against Automated Surface Observing System (ASOS) Precipitation Data Across New York State Ronald S. W. Horwood Meteorologist – Sr HAS Forecaster National Weather Service Northeast River Forecast Center Norton MA NROW 2019 6 -7 Novermber 2019
OUTLINE Background on Northeast River Forecast Center (NERFC) Operations NERFC QPE and Gauge Assimilation New York State Mesonet (NYSM) vs. ASOS site seletion Data Collection and Study Period Total Precipitation Amounts and Comparisons Liquid Equivalent Estimates During Snowfall Comparisons Conclusions
Background on NERFC Operations v One of 13 NWS RFCs v Provide over 200 daily river and/or flow forecasts across New England most of New York State v Produce our own QPF and temperature forecasts in collaboration with 8 NWS WFOs v Maintain our own 6 -hourly QPE data sets v Gauge Only (primary input in cold season) v Multisensor Precipitation Estimate (MPE) which is a radar/gauge combination ( primary input in warm season )
NERFC Gauge Network and Problems NERFC receives a complete set of observed 24 -hourly precipitation amounts at 12 z daily which are dis-aggregated into four 6 -hourly periods for the past 24 hour period. This works well for our main daily forecasts which are issued around 11 AM local time
Gauge Network - cont During evening/overnight high water and/or flood forecasts…daily cooperative precipitation reports are unavailable so the NERFC must rely on the MPE radar/gauge combination or automated gauge sources to determine precipitation estimates. Radar can suffer from beam blockage…melting layer contamination or precipitation overshoot in the cool season Automated gauge sources include ASOS and satellite telemetered rain gauges from cooperating agencies like the United States Geological Survey (USGS)…The U. S. Forest Service and New York City Department of Environmental Protection (NYCDEP) to help generate accurate precipitation estimates Many automated gauges suffer from outages and are notoriously poor in freezing/frozen events. The addition of the New York State Mesonet offered the NERFC an opportunity to incorporate more than 125 high quality 24 x 7 x 365 precipitation reporting sites into our operational database.
Image courtesy of New York State Mesonet
NERFC 6 -Hourly Gauge Network Before NYSM Large spatial gaps in data!!
NERFC 6 -Hourly Gauge Network with NYSM Tremendous increase in spatial coverage
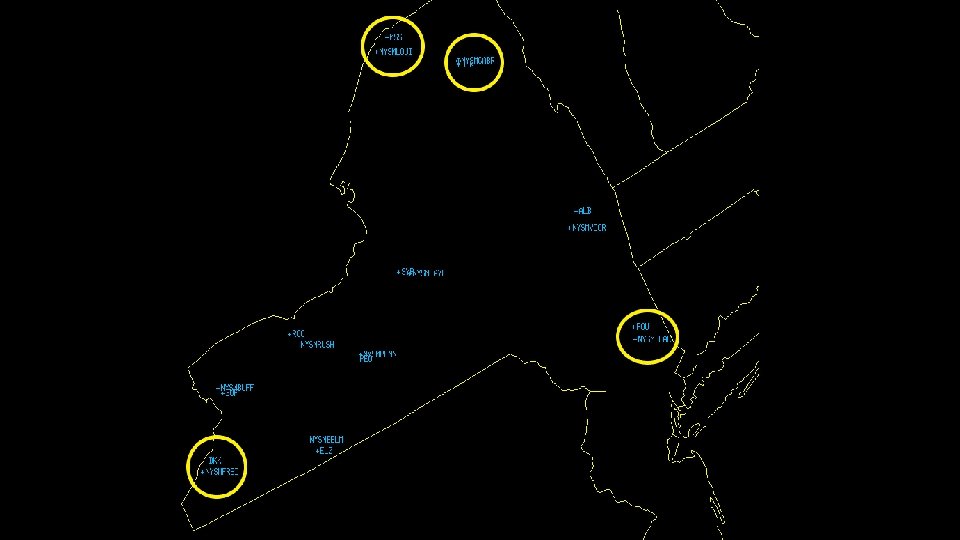
NYSM vs ASOS Site Selection 13 ASOS and NYSM pairs were identified for the study. Sites that were in close proximity to each other 3 pairs in the greater NYC metro area and 10 pairs across interior New York State.
NYSM vs ASOS Site Selection - cont
Data Collection The period of study spanned from 15 January 2019 – 31 May 2019 This period was comprised of mostly “synoptic” precipitation events although late April and May can contain more mesoscale (showery) precipitation events. Allowed for sampling of pure rain as well as freezing/frozen events. Hourly ASOS precipitation amounts are stored in the NERFC database and were summed into daily precipitation amounts for the 24 -hourly period ending at 12 z each day. 5 -minute NYSM precipitation data was obtained for the 13 NYSM sites courtesy of the New York State Mesonet and summed into 24 -hourly totals ending at 12 z each day. Daily totals were calculated for the 26 sites. Data was missing from the PEO ASOS from 26 -31 May 2019 so those days were not included in the study.
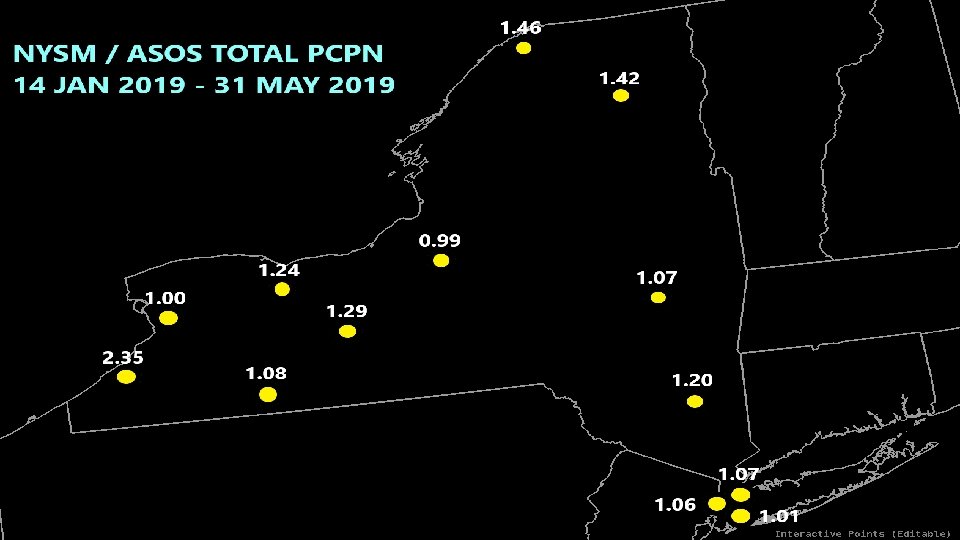
Total Precipitation Comparison v Precipitation for all sites was summed up for the 127 day study period. v Expressed as NYSM/ASOS for the entire period of study on the following image.
Total Precipitation Comparison - cont The New York State Mesonet sites almost always reported higher total precipitation amounts ( 11 of 13 site pairs ) with significant differences ( >10 percent ) at 6 of the 13 site pairs.
Snowfall Comparisons Lets examine some of the sites with large precipitation discrepancies during significant frozen precipitation events ( near or > 6 inches of snow ). SLK and NYSM Gabriels MSS and NYSM Louisville POU and NYSM Beacon DKK and NYSM Fredonia Total liquid equivalent precipitation for the sites were compared with observed precipitation/snowfall from a nearby NWS COOP Observer
SLK ASOS vs NYSMGABR Liquid Equivalent ( inches ) 1. 2 1. 1 1. 06 1 1 0. 84 0. 79 0. 8 0. 6 0. 4 0. 5 0. 48 0. 36 0. 33 Event 1 – 13. 0” observed snowfall at Lake Placid COOP Event 2 – 7. 5” observed snowfall at Lake Placid COOP Event 3 – 10. 5” observed snowfall at Lake Placid COOP 0. 2 0 Event 1 20 -22 Jan 2019 SLK Event 2 13 -15 Feb 2019 NYSMGABR Event 3 22 -24 Mar 2019 Lake Placid COOP
MSS ASOS vs NYSMLOUI 1. 2 Liquid Equivalent ( inches ) 1. 05 1 Missing Precipitation data from Canton COOP 0. 8 Event 1 – 8. 0” observed snowfall at Canton 4 SE COOP 0. 59 0. 6 0. 51 0. 4 Event 2 – 17. 0” observed snowfall at Canton 4 SE COOP 0. 34 0. 21 0. 2 0 T 0 Event 1 21 -22 Jan Event 2 12 -14 Feb Event 3 23 -25 Mar 2019 MSS NYSMLOUI Event 3 – 6. 0” observed snowfall at Canton 4 SE COOP
POU ASOS vs NYSMBEAC 0. 6 Liquid Equivalent ( inches ) 0. 52 0. 5 0. 49 0. 47 0. 45 0. 39 0. 4 0. 33 0. 3 Event 1 – 7. 0” observed snowfall at Poughkeepsie COOP Event 2 – 4. 3” observed snowfall at Poughkeepsie COOP 0. 2 0. 1 0 Event 1 30 -31 Jan 2019 POU NYSMBEAC Event 2 4 -5 Mar 2019 Poughkeepsie COOP
DKK vs NYSMFRED Liquid Equivalent ( inches ) 1. 2 1 0. 98 1 0. 8 12 inches of snow were reported at the Dunkirk NY COOP 0. 6 0. 4 0. 2 0. 02 0 Event 1 20 -21 Jan 2019 DKK NYSMFRED Dunkirk COOP
Snowfall Comparisons - cont Lets look a little closer at the 20 -22 January 2019 snow event which was a real cold event across New York State
20 -22 Jan 2019 Snow Event Liquied Equivalent Precipitation 1. 2 1. 1 1. 06 1 1 0. 92 0. 8 0. 6 0. 4 13 inches of snowfall was reported at the Lake Placid COOP station just east of Saranac Lake with this event. Max temperature during the event was 8 F at SLK with a low of -16 F 12 inches of snowfall was reported at the Dunkirk COOP station with this event. Max temperature during the event was 22 F at DKK with a low of 0 F 0. 33 0. 2 0. 02 0 SLK NYSMGABR Lake Placid COOP DKK NYSMFRED Dunkirk COOP
Snowfall Comparisons - cont Why the big discrepancy in recorded precipitation? ? ? Many of the ASOS systems use a heated tipping bucket which has a serious problem melting snow in cold temperatures. A large quantity of the precipitation is sublimated off before melting resulting in erroneously low observations. The NYSM gauges use a weighing gauge which is far more accurate during winter events ( especially those at low temperatures ).
Snowfall Comparison - cont Now lets look at a wetter snowfall event from March 2019 for all 3 NYC metropolitan ASOS sites and compare them to their NYSM counterparts. Then we will look at a widespread rainfall event from April 2019.
New York City Snowfall/Mixed Event ( 2 -4 March 2019 ) 1. 8 1. 69 1. 58 Liquid Equivalent ( inches ) 1. 6 1. 4 Observed snowfalls were… 1. 48 1. 45 1. 32 1. 2 1 9. 0” at NYC 5. 6” at JFK 8. 6” at LGA In general…the water equivalent observations are much more reasonable for this event…which was much warmer. For NYC…the Max temp during the event was 42 F with a low of 31 F. 0. 8 0. 6 0. 4 0. 2 0 NYC vs NYSMMANN JFK vs NYSMBKLN ASOS NYSM LGA vs NYSMQUEE
Rainfall event 19 -20 April 2019 1. 4 1. 24 Rainfall in Inches 1. 2 1 1 0. 96 0. 83 0. 77 0. 76 0. 73 0. 8 0. 6 0. 4 0. 2 0 ROC NYSMBELM PEO NYSMPENN SLK NYSMGABR SYR NYSMFAYE
Conclusions The New York State Mesonet Precipitation Network has allowed the NERFC to greatly increase its spatial coverage of 24 X 7 real-time gauges across New York State and the coverage is vastly superior to ASOS. The New York State Mesonet gauges perform at least as well as the current Automated Surface Observing System ( ASOS ) network in rainfall events and are vastly superior to most of the ASOS network gauges during freezing/frozen events. This allows for a better estimation of observed precipitation ( QPE ) and snow water equivalent compared to the currently operational gauge network which should directly correlate to better river and flood forecasts from the NERFC across New York State. Additionally…hi elevation ( near or above 2000 feet ) NYSM gauges in the Adirondacks and Catskills allow us to better determine p-type during cool season events. Most high profile climate site ASOS systems have been upgraded to weighing gauges but more rural ASOS systems have not. In the northern United States…winter precipitation amounts from many ASOS systems are unreliable and could be adversely affecting long term climate records
Questions? ?