The Golden Rule He who has the gold


- Slides: 28
The Golden Rule: “He who has the gold makes the rules” Discourse on the Political Economy of the Eurozone 29 March 2012
Agenda Part I. Politics - New economic governance in the EU • The “Sixpack” • The “Fiscal Compact” (“Begrotingspact”/”Pacte Budgétaire”) Part II. Economics – Separating truth from fiction • The myth of excessive public spending • The myth of competitiveness Part III. What to do? • The democratic deficit • Proposals
PART I : POLITICS
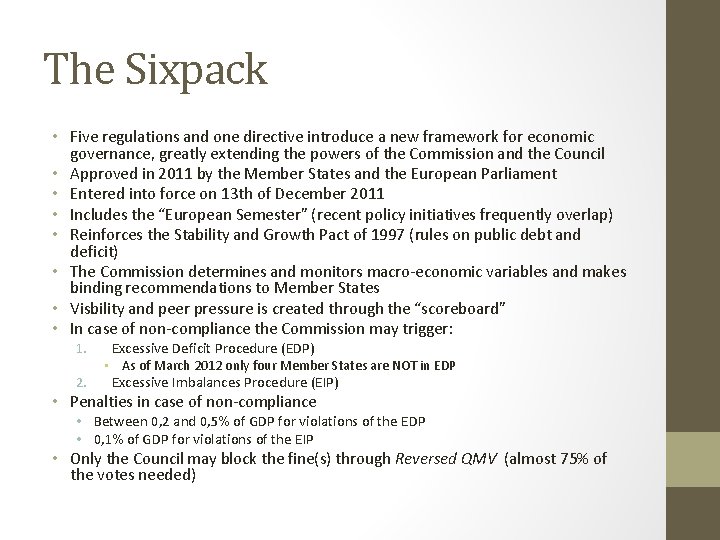
The Sixpack • Five regulations and one directive introduce a new framework for economic governance, greatly extending the powers of the Commission and the Council • Approved in 2011 by the Member States and the European Parliament • Entered into force on 13 th of December 2011 • Includes the “European Semester” (recent policy initiatives frequently overlap) • Reinforces the Stability and Growth Pact of 1997 (rules on public debt and deficit) • The Commission determines and monitors macro-economic variables and makes binding recommendations to Member States • Visbility and peer pressure is created through the “scoreboard” • In case of non-compliance the Commission may trigger: 1. 2. Excessive Deficit Procedure (EDP) • As of March 2012 only four Member States are NOT in EDP Excessive Imbalances Procedure (EIP) • Penalties in case of non-compliance • Between 0, 2 and 0, 5% of GDP for violations of the EDP • 0, 1% of GDP for violations of the EIP • Only the Council may block the fine(s) through Reversed QMV (almost 75% of the votes needed)
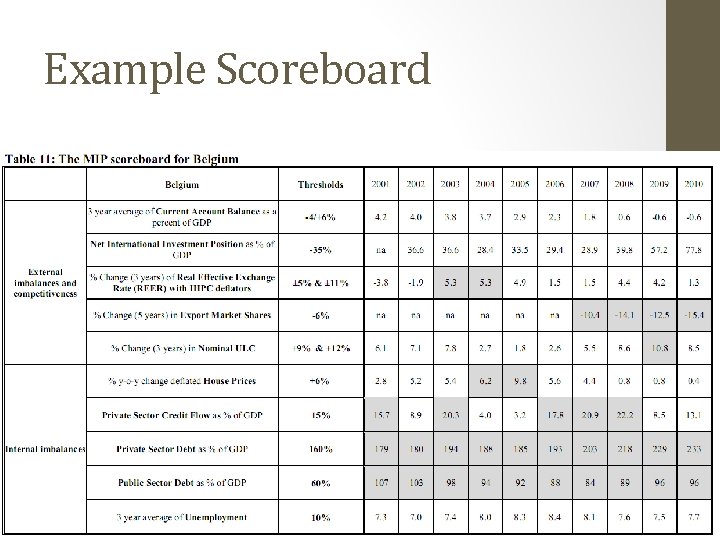
Example Scoreboard
The Scoreboard • Reflect the real priorities of the EU • No social (except unemployment) or ecological variables • Nominal ULC • No lower limit • No academic references proving this variable to be problematic • Unemployment • Constant unemployment levels of 9% are not a problem?
The Fiscal Compact • Is an Intergovernmental Treaty • Ratification is ongoing, will enter into force 1 January 2013 if by then at least 12 Member States have ratified it • … hence a referendum in Ireland can not halt adoption (although the political implications of a “no” would be substantial) • The United Kingdom and Czech Republic haven’t signed it (yet) • Perhaps a novelty: the Treaty is opposed by the European Trade Union Federation (ETUC) • The Treaty reinforces the Sixpack: • Stresses the “Golden Rule”: structural deficit must be lower than 0, 5% of GDP • Only those who agreed to the Fiscal Compact will be able to draw funds from the European Stability Mechanism (ESM), the permanent “rescue fund” • Compulsory anchoring of provisions in the Constitution of Member States • Penalties (European Court of Justice decision): • 0, 1% of GDP if the Treaty is not embedded in the Constitution or equivalent
PART II. ECONOMICS
The Golden Rule • The Golden Rule: the structural deficit must be lower than 0, 5% of GDP, but this policy goal raises a number of questions 1. The Golden Rule relies on “Potential GDP”, an elusive figure • “As a measure of fiscal rectitude, [the Golden Rule] mandates use of a statistic that is unobservable and can be estimated only with a plethora of assumptions about cyclically adjusted revenues, expenditures and output. ” – Prof. David R. Cameron (Yale University) • Example: in 2007 the IMF estimated that Ireland had a structural deficit 0, 1% of GDP, a number which was revised in October of last year to 8, 4% of GDP 2. Public debt will be forced below 60% • The structural deficit limit is raised to 1% of GDP when debt is below 60% • According to Prof. Karl Whelan (University College Dublin) it follows that in the long run, given a nominal GDP growth of 4%, public debt will tend towards 25% of GDP (one unit of debt for four units of growth)
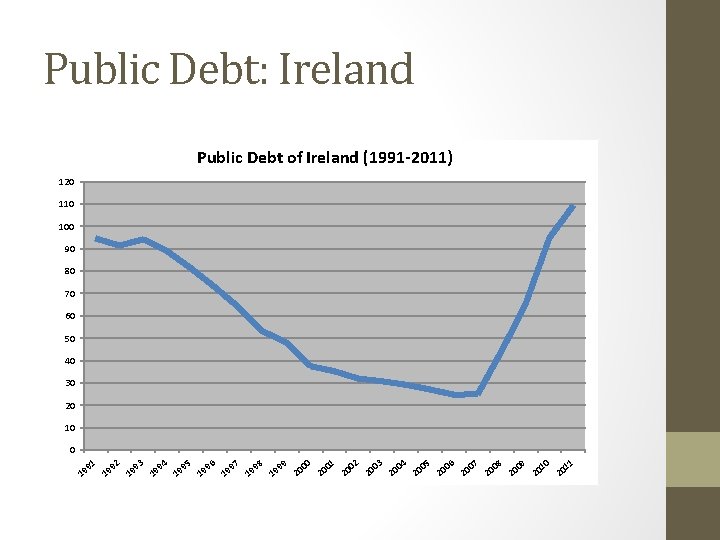
Public Debt: Ireland Public Debt of Ireland (1991 -2011) 120 110 100 90 80 70 60 50 40 30 20 10 0 91 19 19 92 93 19 94 19 95 19 96 19 97 19 98 19 99 000 001 002 003 004 005 006 007 008 009 010 011 2 2 19 2 2 2 2 2
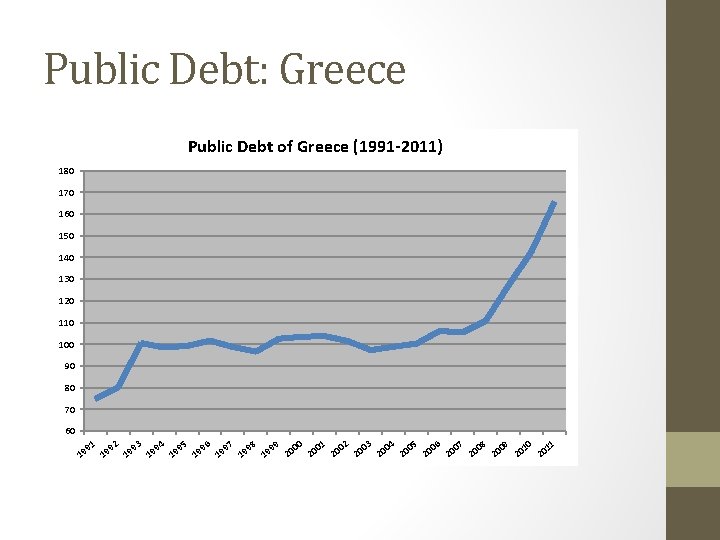
Public Debt: Greece Public Debt of Greece (1991 -2011) 180 170 160 150 140 130 120 110 100 90 80 70 60 19 91 92 19 93 19 94 19 95 19 96 19 97 19 98 19 99 000 001 002 003 004 005 006 007 008 009 010 011 19 2 2 2
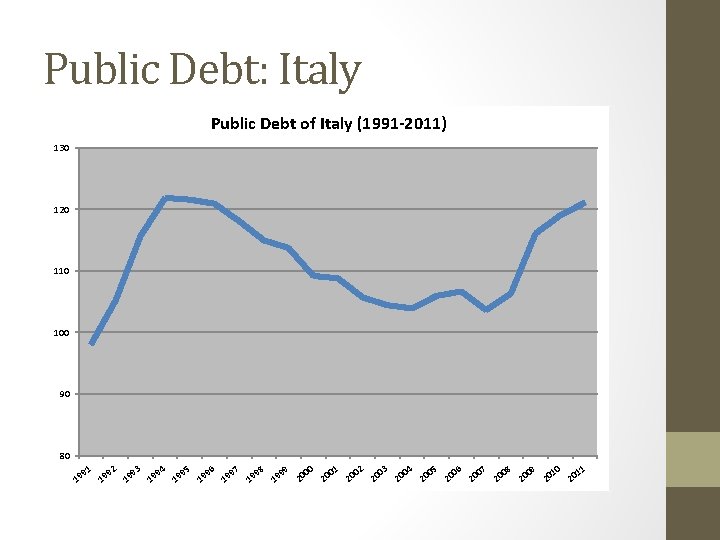
Public Debt: Italy Public Debt of Italy (1991 -2011) 130 120 110 100 90 80 91 19 92 19 93 19 94 19 95 19 96 19 97 19 98 19 99 000 001 002 003 004 005 006 007 008 009 010 011 19 2 2 2
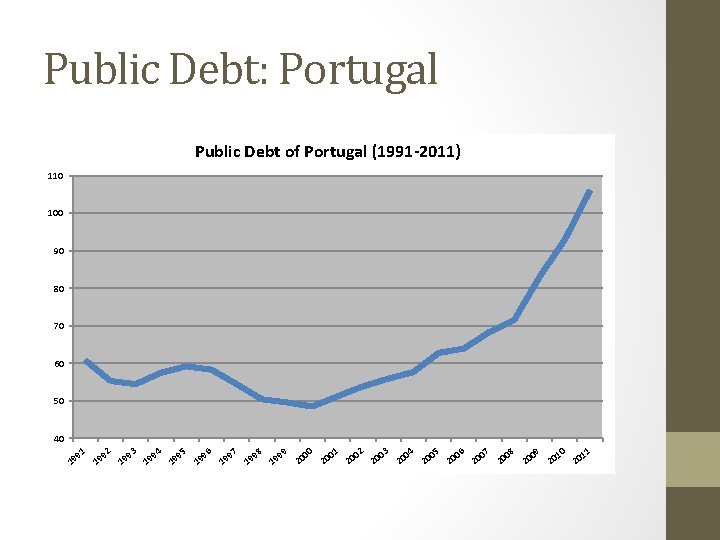
Public Debt: Portugal Public Debt of Portugal (1991 -2011) 110 100 90 80 70 60 50 40 91 19 92 19 93 19 94 19 95 19 96 19 97 19 98 19 99 000 001 002 003 004 005 006 007 008 009 010 011 2 19 2 2 2
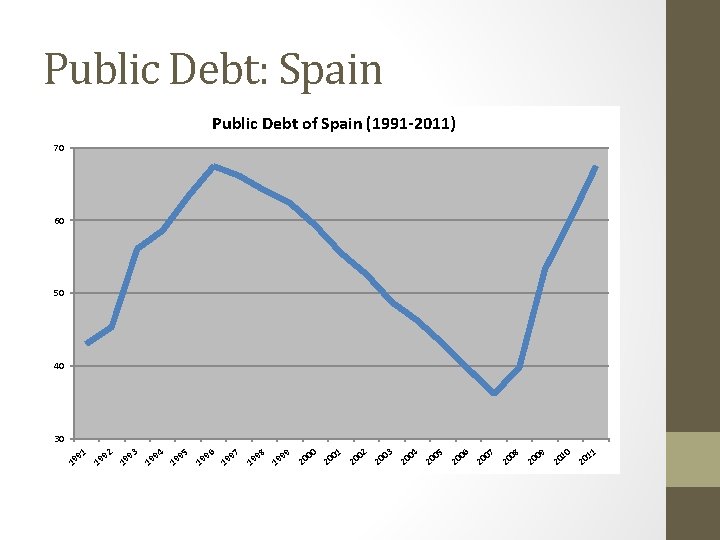
Public Debt: Spain Public Debt of Spain (1991 -2011) 70 60 50 40 30 91 19 19 92 93 19 94 19 95 19 96 19 97 19 98 999 000 001 002 003 004 005 006 007 008 009 010 011 19 1 2 2 2
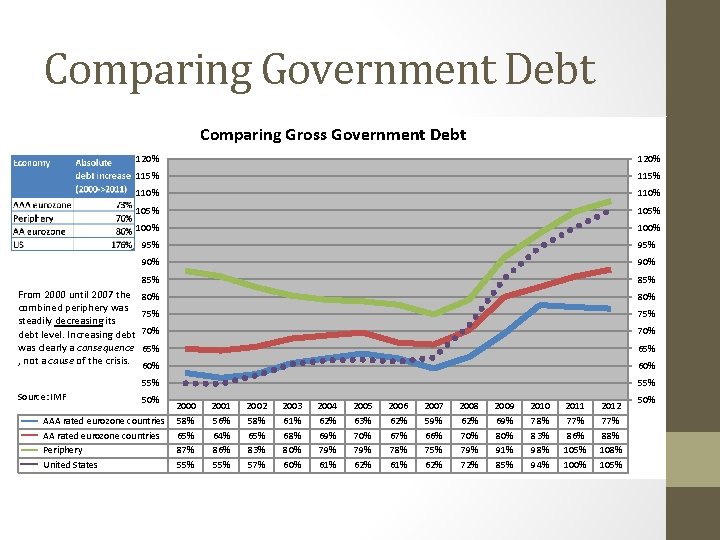
Comparing Government Debt Comparing Gross Government Debt From 2000 until 2007 the combined periphery was steadily decreasing its debt level. Increasing debt was clearly a consequence , not a cause of the crisis. Source: IMF 120% 115% 110% 105% 100% 95% 90% 85% 80% 75% 70% 65% 60% 55% 50% AAA rated eurozone countries Periphery United States 2000 58% 65% 87% 55% 2001 56% 64% 86% 55% 2002 58% 65% 83% 57% 2003 61% 68% 80% 60% 2004 62% 69% 79% 61% 2005 63% 70% 79% 62% 2006 62% 67% 78% 61% 2007 59% 66% 75% 62% 2008 62% 70% 79% 72% 2009 69% 80% 91% 85% 2010 78% 83% 98% 94% 2011 77% 86% 105% 100% 2012 77% 88% 105% 50%
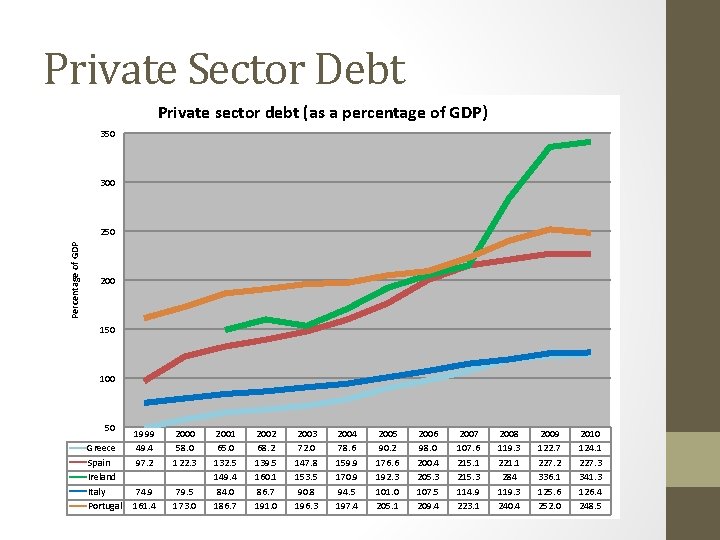
Private Sector Debt Private sector debt (as a percentage of GDP) 350 300 Percentage of GDP 250 200 150 100 50 Greece Spain Ireland Italy Portugal 1999 49. 4 97. 2 2000 58. 0 122. 3 74. 9 161. 4 79. 5 173. 0 2001 65. 0 132. 5 149. 4 84. 0 186. 7 2002 68. 2 139. 5 160. 1 86. 7 191. 0 2003 72. 0 147. 8 153. 5 90. 8 196. 3 2004 78. 6 159. 9 170. 9 94. 5 197. 4 2005 90. 2 176. 6 192. 3 101. 0 205. 1 2006 98. 0 200. 4 205. 3 107. 5 209. 4 2007 107. 6 215. 1 215. 3 114. 9 223. 1 2008 119. 3 221. 1 284 119. 3 240. 4 2009 122. 7 227. 2 336. 1 125. 6 252. 0 2010 124. 1 227. 3 341. 3 126. 4 248. 5
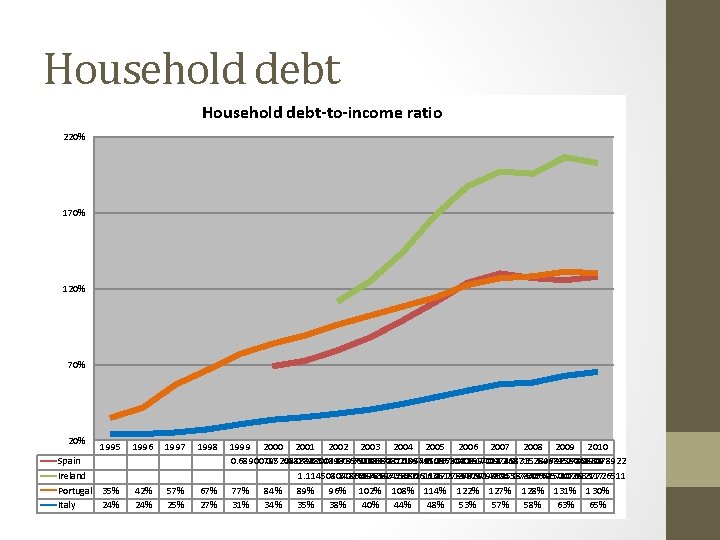
Household debt-to-income ratio 220% 170% 120% 70% 20% Spain Ireland Portugal Italy 1995 1996 1997 1998 35% 24% 42% 24% 57% 25% 67% 27% 1999 2000 2001 2002 2003 2004 2005 2006 2007 2008 2009 2010 0. 689007952088784 0. 72448382801198 0. 793508331679186 0. 878262212808703 0. 989780219579508 1. 10946143620408 1. 23790836170142 1. 29940974183153 1. 2687353899827 1. 25467958068909 1. 27808307892228 1. 11450804026596 1. 24860878597354 1. 43824787215636 1. 68061145111847 1. 87278622979851 1. 96914804317842 1. 95587505695717 2. 06415007692117 2. 02633772651194 77% 84% 89% 96% 102% 108% 114% 122% 127% 128% 131% 130% 31% 34% 35% 38% 40% 44% 48% 53% 57% 58% 63% 65%
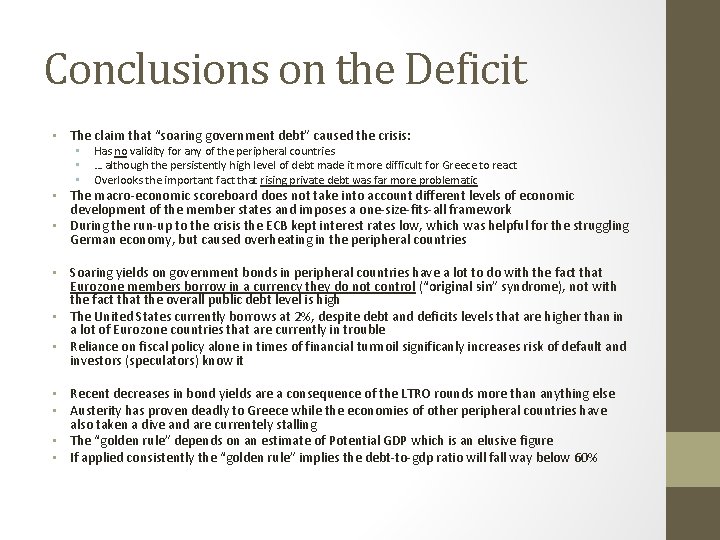
Conclusions on the Deficit • The claim that “soaring government debt” caused the crisis: • • • Has no validity for any of the peripheral countries … although the persistently high level of debt made it more difficult for Greece to react Overlooks the important fact that rising private debt was far more problematic • The macro-economic scoreboard does not take into account different levels of economic development of the member states and imposes a one-size-fits-all framework • During the run-up to the crisis the ECB kept interest rates low, which was helpful for the struggling German economy, but caused overheating in the peripheral countries • Soaring yields on government bonds in peripheral countries have a lot to do with the fact that Eurozone members borrow in a currency they do not control (“original sin” syndrome), not with the fact that the overall public debt level is high • The United States currently borrows at 2%, despite debt and deficits levels that are higher than in a lot of Eurozone countries that are currently in trouble • Reliance on fiscal policy alone in times of financial turmoil significanly increases risk of default and investors (speculators) know it • Recent decreases in bond yields are a consequence of the LTRO rounds more than anything else • Austerity has proven deadly to Greece while the economies of other peripheral countries have also taken a dive and are currentely stalling • The “golden rule” depends on an estimate of Potential GDP which is an elusive figure • If applied consistently the “golden rule” implies the debt-to-gdp ratio will fall way below 60%
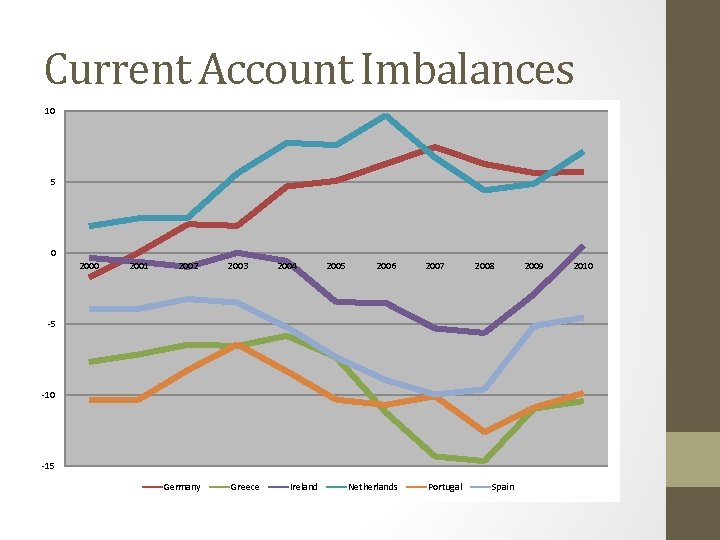
Current Account Imbalances 10 5 0 2001 2002 2003 2004 2005 2006 2007 2008 -5 -10 -15 Germany Greece Ireland Netherlands Portugal Spain 2009 2010
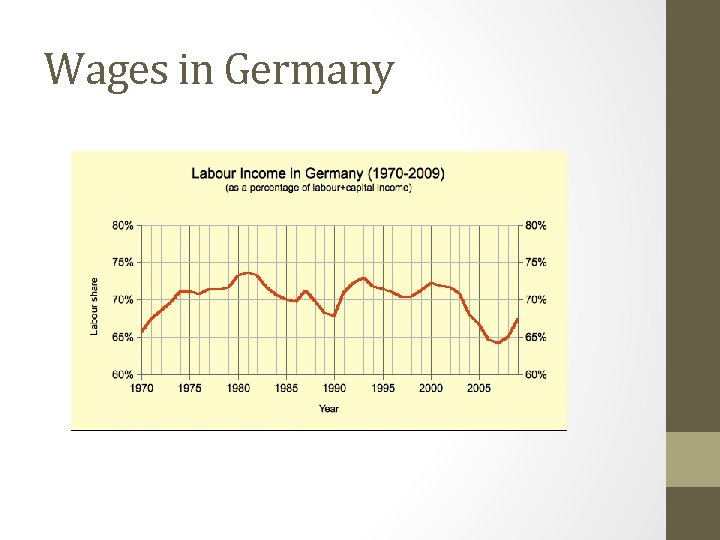
Wages in Germany
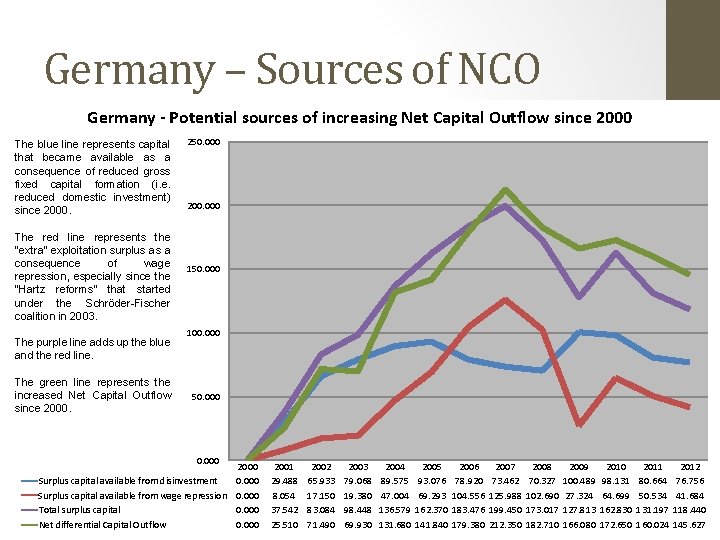
Germany – Sources of NCO Germany - Potential sources of increasing Net Capital Outflow since 2000 The blue line represents capital that became available as a consequence of reduced gross fixed capital formation (i. e. reduced domestic investment) since 2000. The red line represents the "extra" exploitation surplus as a consequence of wage repression, especially since the "Hartz reforms" that started under the Schröder-Fischer coalition in 2003. The purple line adds up the blue and the red line. The green line represents the increased Net Capital Outflow since 2000. 250. 000 200. 000 150. 000 100. 000 50. 000 2000 Surplus capital available from disinvestment 0. 000 Surplus capital available from wage repression 0. 000 Total surplus capital 0. 000 Net differential Capital Outflow 0. 000 2001 29. 488 8. 054 37. 542 25. 510 2002 65. 933 17. 150 83. 084 71. 490 2003 79. 068 19. 380 98. 448 69. 930 2004 89. 575 47. 004 136. 579 131. 680 2005 93. 076 69. 293 162. 370 141. 840 2006 78. 920 104. 556 183. 476 179. 380 2007 73. 462 125. 988 199. 450 212. 350 2008 70. 327 102. 690 173. 017 182. 710 2009 100. 489 27. 324 127. 813 166. 080 2010 98. 131 64. 699 162. 830 172. 650 2011 80. 664 50. 534 131. 197 160. 024 2012 76. 756 41. 684 118. 440 145. 627
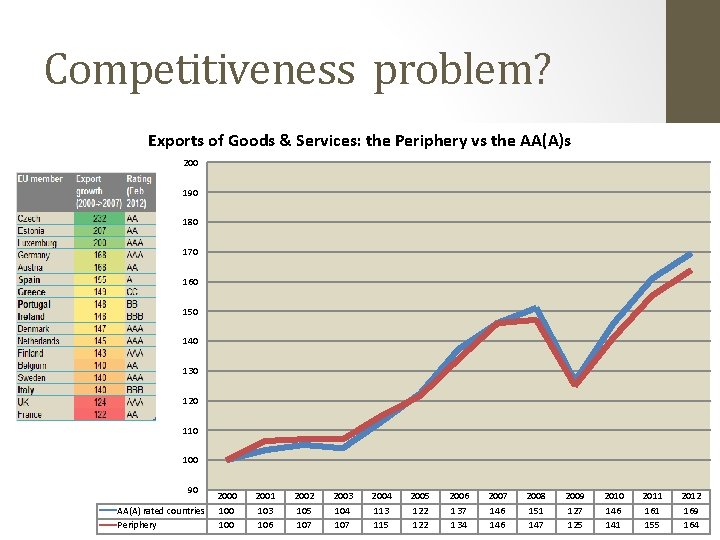
Competitiveness problem? Exports of Goods & Services: the Periphery vs the AA(A)s 200 190 180 170 160 150 140 130 120 110 100 90 AA(A) rated countries Periphery 2000 100 2001 103 106 2002 105 107 2003 104 107 2004 113 115 2005 122 2006 137 134 2007 146 2008 151 147 2009 127 125 2010 146 141 2011 161 155 2012 169 164
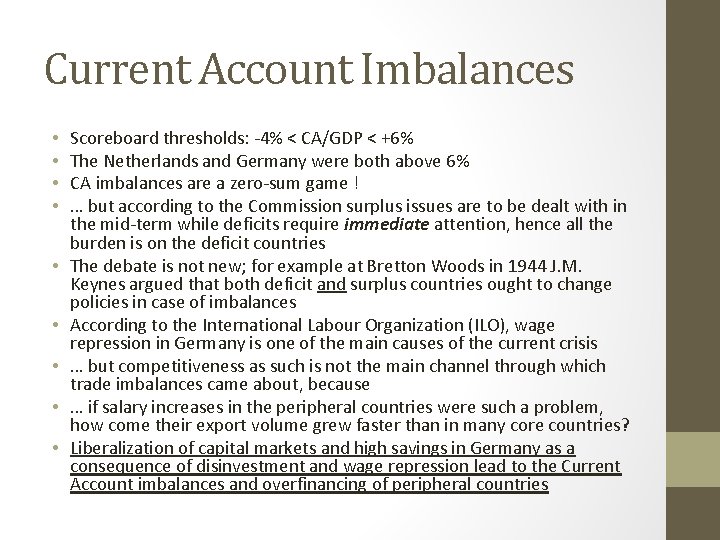
Current Account Imbalances • • • Scoreboard thresholds: -4% < CA/GDP < +6% The Netherlands and Germany were both above 6% CA imbalances are a zero-sum game ! … but according to the Commission surplus issues are to be dealt with in the mid-term while deficits require immediate attention, hence all the burden is on the deficit countries The debate is not new; for example at Bretton Woods in 1944 J. M. Keynes argued that both deficit and surplus countries ought to change policies in case of imbalances According to the International Labour Organization (ILO), wage repression in Germany is one of the main causes of the current crisis … but competitiveness as such is not the main channel through which trade imbalances came about, because … if salary increases in the peripheral countries were such a problem, how come their export volume grew faster than in many core countries? Liberalization of capital markets and high savings in Germany as a consequence of disinvestment and wage repression lead to the Current Account imbalances and overfinancing of peripheral countries
PART III. WHAT TO DO?
The Democratic Deficit • The new treaties, regulations and directives leave the European Parliament (EP) completely out of the picture • The EP can not determine what macro-economic variables are monitored, what the thresholds are, what the recommendations to the Member States will be or whether a Member State will receive a fine • Everything is in the hands of the Commission with limited power to the Council to block a fine (Reversed QMV, almost 75% of the votes) • The EP still has no right of initiative: • This renders elections meaningless because the EP can’t overturn any of the new regulations or directives • The European Parliament can not pass any directive the Commission doesn’t agree with • Motion of censure by the EP against the Commission requires a two third majority • The European Council is the most powerful of EU institutions, but this is the seat of European “realpolitik” (large member states are in control) • When push comes to shove the European Council moves around the treaties at will (cfr. the “no bail-out clause” or the Fiscal Compact)
Proposals • On Current Account Imbalances: • Monitor debt-driven growth • Have surplus countries carry the burden • Re-introduce capital controls to alter the composition of capital flows • Minimum stay requirements • Prefer Foreign Direct Investment (FDI) over debt • To reduce dependency on volatile financial markets, keep 75% of public debt national, even if that implies higher interest rates • On financial stability: • Keep banks small, have public and support cooperative banks • Separate savings from investment banks • Let the EU take responsibility for systemic risk • Have an EU system for orderly bankruptcy of financial institutions • Have a macro-economic scoreboard that monitors social and ecological variables: inequality, poverty, carbon emissions, etc.
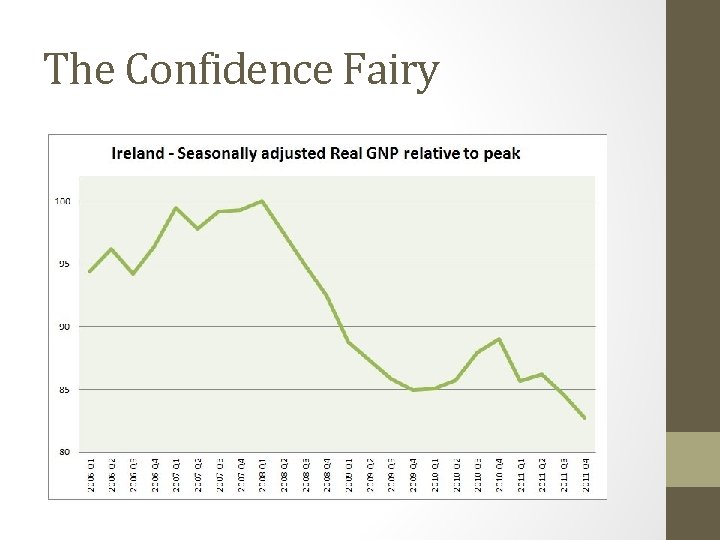
The Confidence Fairy
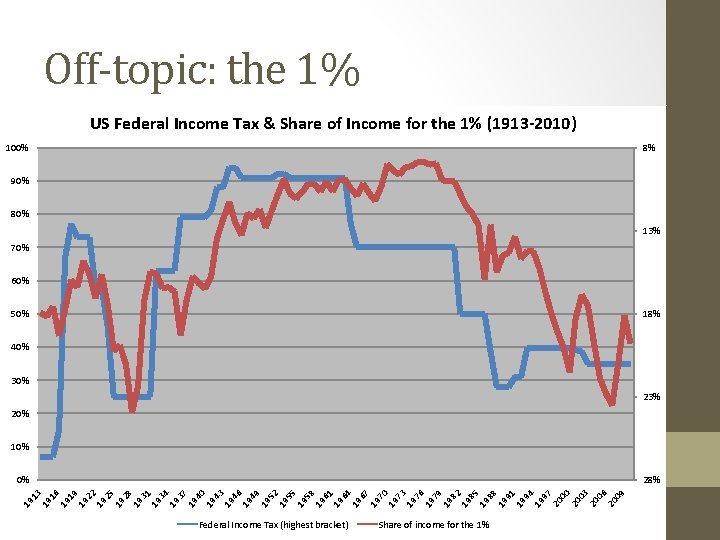
Off-topic: the 1% US Federal Income Tax & Share of Income for the 1% (1913 -2010) 100% 8% 90% 80% 13% 70% 60% 50% 18% 40% 30% 23% 20% 10% 28% 19 13 19 16 19 19 19 22 19 25 19 28 19 31 19 34 19 37 19 40 19 43 19 46 19 49 19 52 19 55 19 58 19 61 19 64 19 67 19 70 19 73 19 76 19 79 19 82 19 85 19 88 19 91 19 94 19 97 20 00 20 03 20 06 20 09 0% Federal Income Tax (highest bracket) Share of income for the 1%