The Changing Structure of the Philippine NonWood Furniture


")

 n n n n N America C America S")


- Slides: 27
The Changing Structure of the Philippine Non-Wood Furniture and Handicraft Industries: Marketing, Trade and Policy Implications Isabelita M. Pabuayon University of the Philippines Los Banos IUFRO All Division 5 Conference Forest “Production and Environment – A Productive Symbiosis” October 29 -November 2, 2007 Taipei, Taiwan
purpose of the paper n n To analyze the structural changes occurring in the Philippine non-wood furniture and handicraft industries To identify the policy implications and provide a framework for NWFP competitiveness
sources of data n n n n n Philippine Forestry Statistics, Department of Environment and Natural Resources (DENR) Department of Trade and Industry (DTI) Philippine Rattan Marketing Study - Pabuayon et al 1988 Philippine Rattan Sector – Pabuayon et al 1996, INBAR Philippine Bamboo Sector – Rivera et al 1996, INBAR Bamboo Master Plan – Pabuayon et al 1997, DTI State of Philippine Furniture Sector Report – Pearl 2, 2004 Philippine NTFPs: Status and Strategies, Pabuayon, 2005 FRAME Philippines Rattan Value Chain Study – USAID, IRG, Enterprise Works/VITA 2006
howsignificant n n Livelihood for upland rural communities and industries - 15, 000 gatherers - 2, 000 handicraft and 15, 000 furniture manufacturers - 768, 000 workers and subcontractors Foreign exchange - 98% of total NWFPs - B&R furniture, chairs, seats, basketware/wickerware Rural housing, materials and infra for agriculture and fishing sectors Unmarketed environmental services
changing industry structure n n Declining comparative and competitive advantage due to dwindling raw material supply and increasing labor costs Impacts on - input sourcing and utilization - product designs - capacity utilization - market shares
inputsourcing n n All raw materials previously locally sourced, cutting permits increasing until 2000 with 370 but dropped to 32 in 2005 Increasing raw material imports (estimated at 14% of current use)
High US$1. 50 M Low US$0. 39 M
Major B&R imports: Raw materials
inpututilization n From 99% pure rattan or bamboo to greater use of smaller diameter and combination of rattan or bamboo and other materials (wood, metal, indigenous fibers) Greater product diversification Has remained generally labor-intensive from raw material harvesting to quality control and packaging of final products for delivery to markets, some degree of mechanization in certain manufacturing stages for large firms
productioncapacity n n n n Capacity utilization for furniture firms from over 90% (1987 survey) to 57 -77% (2004 survey) Predominantly small and medium-scale Majority locally-owned, others partly-owned by foreign nationals 60% of output from Cebu Employ male and female workers Up to 80 of production through sub-contracting arrangements 60 -90% of output for export Target mid-range to high-end market segments
sunvalleyrattan philippines modern
sunvalleyrattan innovative philippines
1978 -1985: 38%/yr 1995 -2006: 5%/yr
High US$7. 74 M Low US$3. 95 M
High US$129 M Low US$66 M
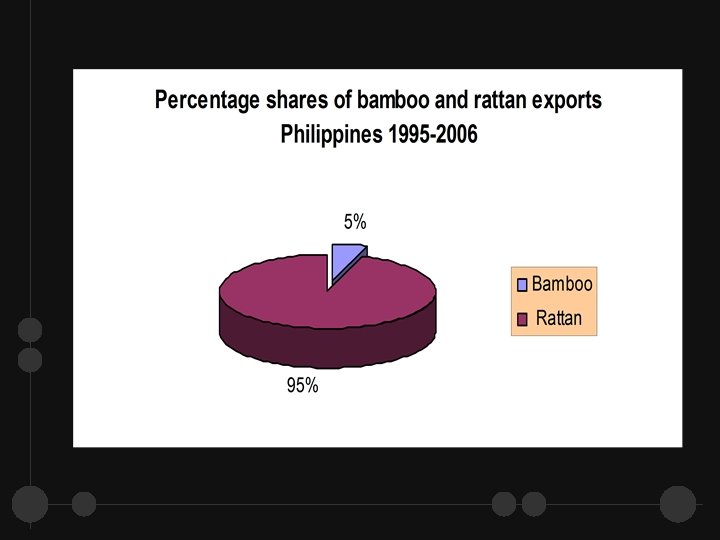
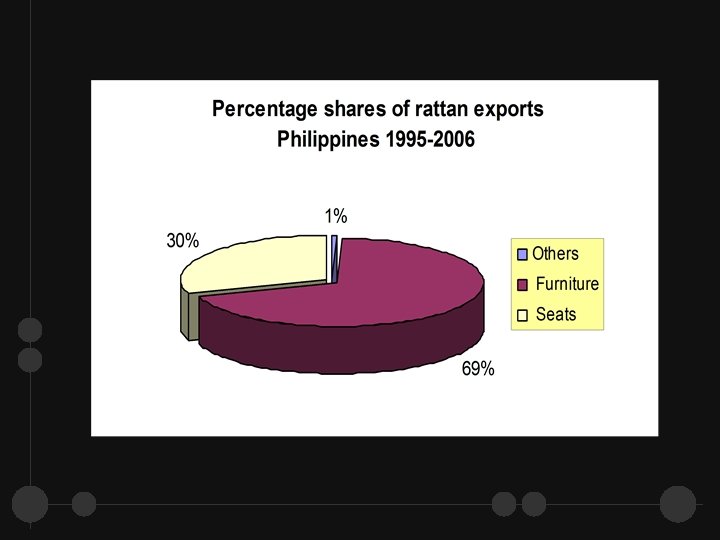
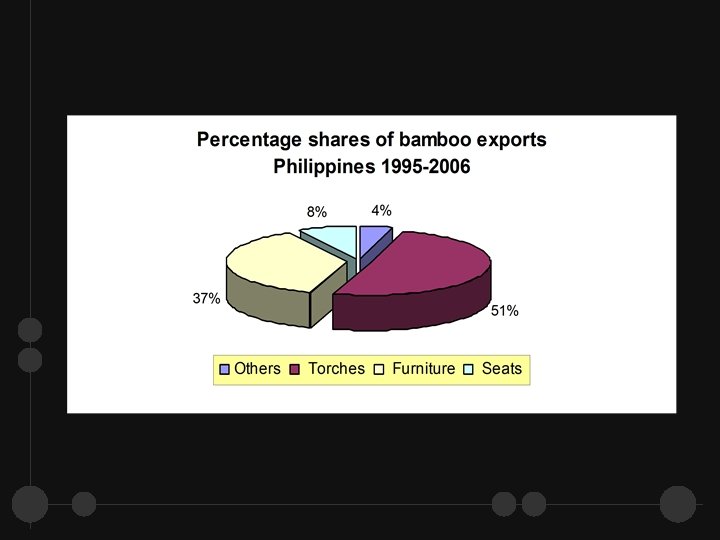
Declining share of B&R furniture: Total US$287 M rattan 73% of US$130 M (1987) Total US$275 M
High US$78 M Low US$52 M
marketdiversification 1997 -1998 (70+ countries) n n n n N America C America S America E Union E Europe W Europe Japan/Australasia ASEAN China/Korea 1. 41 Middle East Africa Caribbean Others 49. 12% 0. 06 1. 64 30. 85 0. 00 0. 43 10. 72 1. 19 1. 85 0. 61 1. 90 0. 26 2005 -2006 (90+ countries) n n n 66. 22% 0. 53 1. 03 14. 83 0. 18 1. 01 9. 10 0. 74 1. 29 3. 60 0. 43 1. 06 ++ + _ __ + ++ _ _ _ ++ _ _
top 10 markets n n n n n USA Japan Australia Hawaii Italy Great Britain Spain France Canada Netherlands Total 61. 31% 5. 10% 3. 37% 2. 74% 2. 42% 2. 21% 2. 08% 1. 79% 1. 58% 84. 80%
potential value n Around US$180 million export industry n Domestic market
implications n n Seek new opportunities for displaced workers and small operators Address the declining competitiveness Need for more organized and concerted courses of action Investments in human and capital resources
challenges and opportunities n n n n n Superior craftsmanship for medium and high-end market segments Growing domestic market Enhanced environmental awareness (ecotourism and green markets) B&R are renewable resources Integration of plantation development in CBFMs Continuing R&D in production, processing and utilization Adaptation strategies in sourcing and use of alternative raw materials Liberalized trade (access to markets and imported inputs) Government support for SMEs
NWFP competitiveness framework Sustainability of the Resource Base • Plantation development • Enrichment planting • Regeneration of existing stands • Efficient harvesting systems productivity efficacy Effective Policies for NWFPs • Facilitative export procedures • Tax incentives/privileges for importing raw mats/inputs • Enhanced domestic trade of outputs and inputs Cost Quality COMPETITIVENESS Flexibility Time values Continuing R&D for new technologies • New designs, products, uses • Efficient production/ operational systems innovation Favorable Support Systems • Improved infra: ports, roads • Education and skills devt • Financing schemes • Market intelligence
thank you