TCAD Process and device simulation of OVERMOS a

- Slides: 33
TCAD Process and device simulation of OVERMOS, a CMOS 180 nm MAPS detector E. G. Villani STFC Rutherford Appleton Laboratory on behalf of OVERMOS project collaboration 34 th RD 50 Workshop, Lancaster University, UK, 12 – 14 June 2019
Overview • OVERMOS description • Charge collection of OVERMOS using calibrated laser • TCAD simulation: comparisons of TCAD simulations with irradiated and non-irradiated OVERMOS devices • Conclusions – next steps 34 th RD 50 Workshop, Lancaster University, UK, 12 – 14 June 2019 1
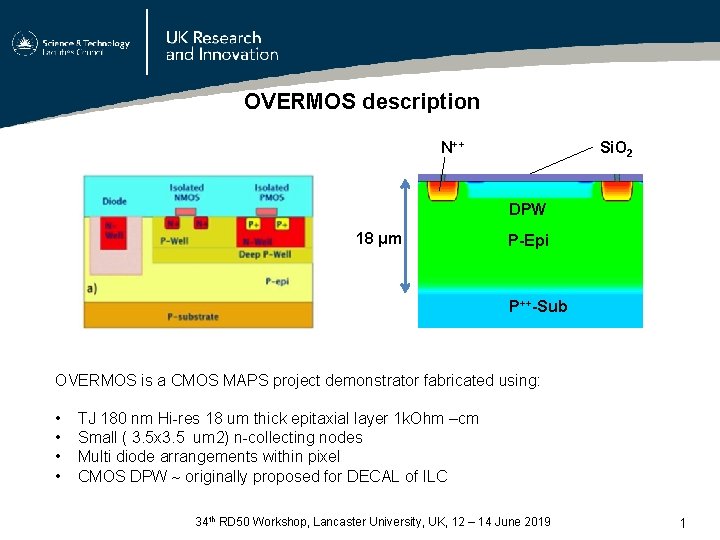
OVERMOS description N++ Si. O 2 DPW 18 μm P-Epi P++-Sub OVERMOS is a CMOS MAPS project demonstrator fabricated using: • • TJ 180 nm Hi-res 18 um thick epitaxial layer 1 k. Ohm –cm Small ( 3. 5 x 3. 5 um 2) n-collecting nodes Multi diode arrangements within pixel CMOS DPW originally proposed for DECAL of ILC 34 th RD 50 Workshop, Lancaster University, UK, 12 – 14 June 2019 1
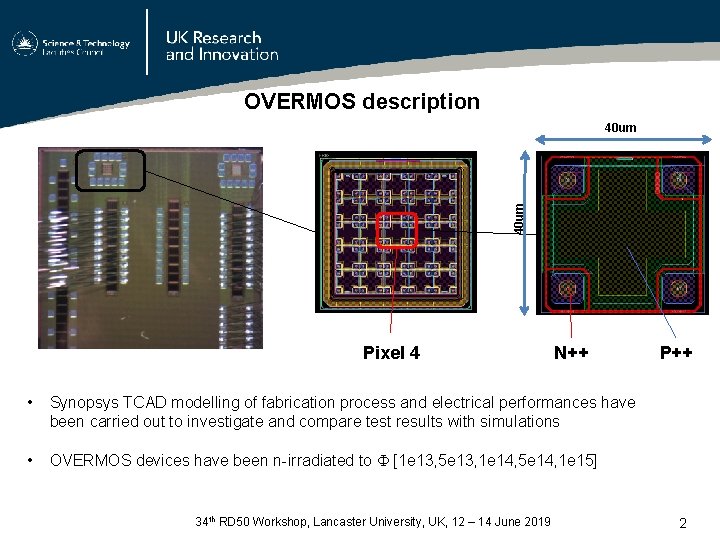
OVERMOS description 40 um Pixel 4 N++ • Synopsys TCAD modelling of fabrication process and electrical performances have been carried out to investigate and compare test results with simulations • OVERMOS devices have been n-irradiated to [1 e 13, 5 e 13, 1 e 14, 5 e 14, 1 e 15] P++ 34 th RD 50 Workshop, Lancaster University, UK, 12 – 14 June 2019 2
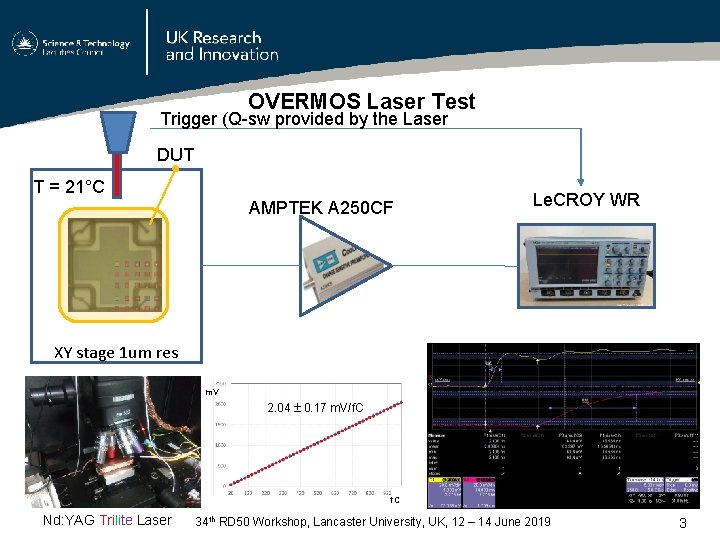
OVERMOS Laser Test Trigger (Q-sw provided by the Laser DUT T = 21°C AMPTEK A 250 CF Le. CROY WR XY stage 1 um res m. V 2. 04 0. 17 m. V/f. C Nd: YAG Trilite Laser 34 th RD 50 Workshop, Lancaster University, UK, 12 – 14 June 2019 3
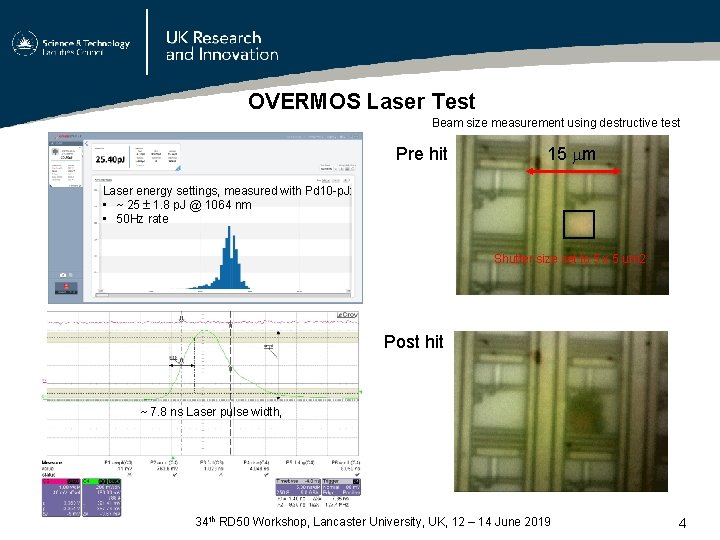
OVERMOS Laser Test Beam size measurement using destructive test Pre hit 15 m Laser energy settings, measured with Pd 10 -p. J: • ~ 25 1. 8 p. J @ 1064 nm • 50 Hz rate Shutter size set to 5 x 5 um 2 Post hit ~ 7. 8 ns Laser pulse width, 34 th RD 50 Workshop, Lancaster University, UK, 12 – 14 June 2019 4
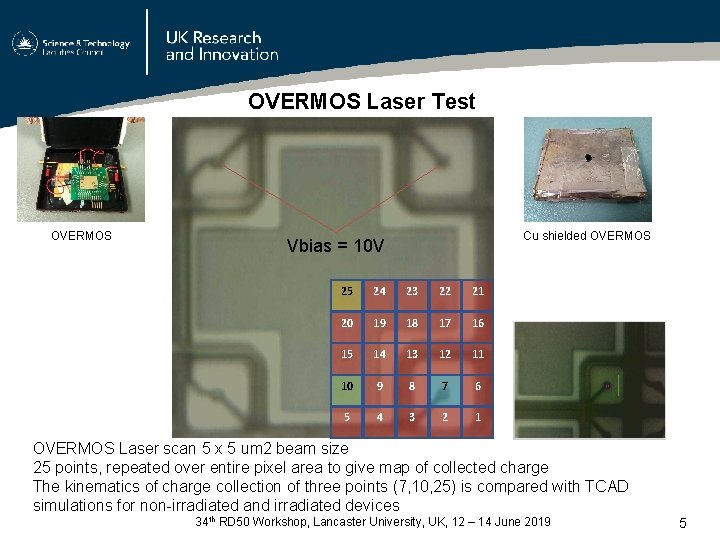
OVERMOS Laser Test OVERMOS Cu shielded OVERMOS Vbias = 10 V 25 24 23 22 21 20 19 18 17 16 15 14 13 12 11 10 9 8 7 6 5 4 3 2 1 OVERMOS Laser scan 5 x 5 um 2 beam size 25 points, repeated over entire pixel area to give map of collected charge The kinematics of charge collection of three points (7, 10, 25) is compared with TCAD simulations for non-irradiated and irradiated devices 34 th RD 50 Workshop, Lancaster University, UK, 12 – 14 June 2019 5
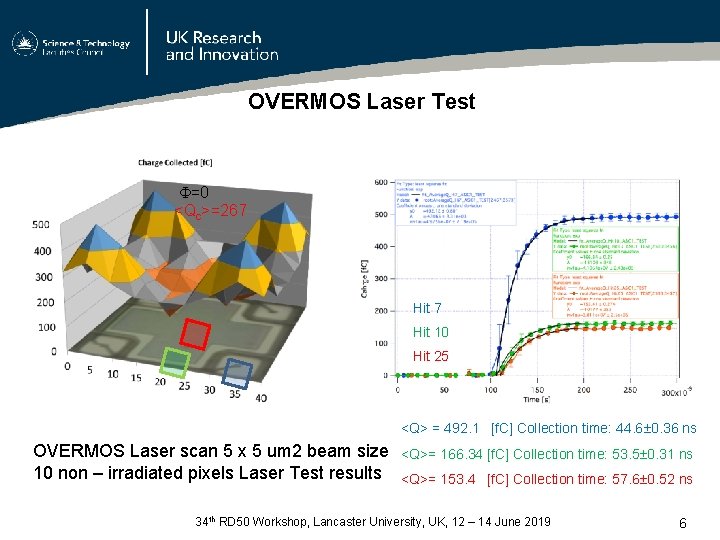
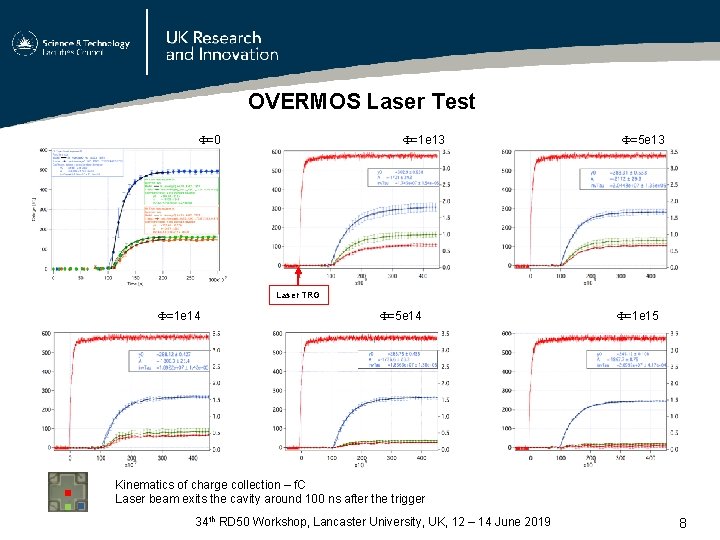
OVERMOS Laser Test =0 <Qc>=267 Hit 10 Hit 25 <Q> = 492. 1 [f. C] Collection time: 44. 6 0. 36 ns OVERMOS Laser scan 5 x 5 um 2 beam size 10 non – irradiated pixels Laser Test results <Q>= 166. 34 [f. C] Collection time: 53. 5 0. 31 ns <Q>= 153. 4 [f. C] Collection time: 57. 6 0. 52 ns 34 th RD 50 Workshop, Lancaster University, UK, 12 – 14 June 2019 6
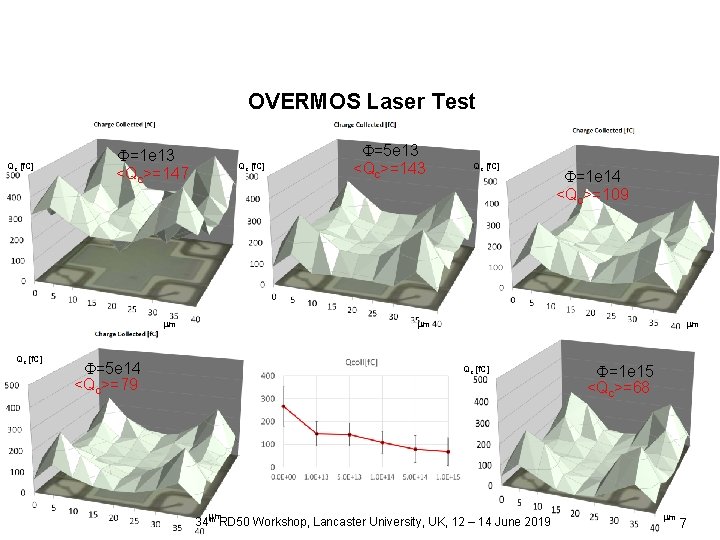
OVERMOS Laser Test Qc [f. C] =1 e 13 <Qc>=147 Qc [f. C] m Qc [f. C] =5 e 13 <Qc>=143 Qc [f. C] =1 e 14 <Qc>=109 m =5 e 14 <Qc>=79 m Qc [f. C] m 34 th RD 50 Workshop, Lancaster University, UK, 12 – 14 June 2019 =1 e 15 <Qc>=68 m 7
OVERMOS Laser Test =0 =1 e 13 =5 e 13 Laser TRG =1 e 14 =5 e 14 =1 e 15 Kinematics of charge collection – f. C Laser beam exits the cavity around 100 ns after the trigger 34 th RD 50 Workshop, Lancaster University, UK, 12 – 14 June 2019 8
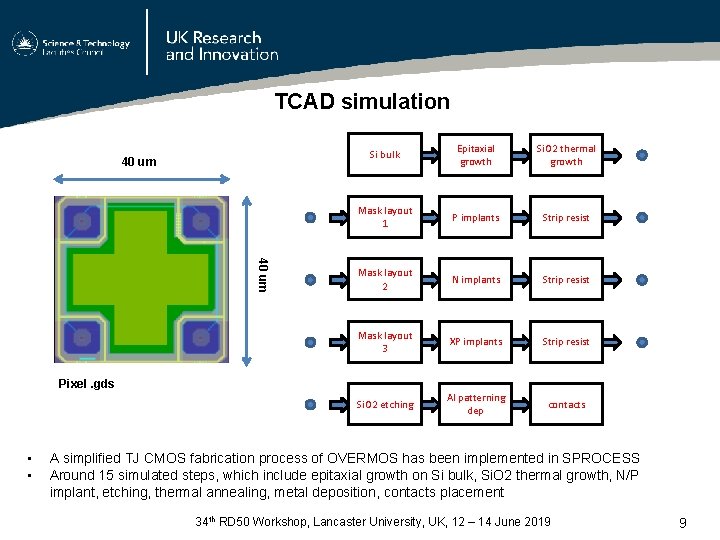
TCAD simulation 40 um Si bulk Epitaxial growth Si. O 2 thermal growth Mask layout 1 P implants Strip resist Mask layout 2 N implants Strip resist Mask layout 3 XP implants Strip resist Si. O 2 etching Al patterning dep contacts Pixel. gds • • A simplified TJ CMOS fabrication process of OVERMOS has been implemented in SPROCESS Around 15 simulated steps, which include epitaxial growth on Si bulk, Si. O 2 thermal growth, N/P implant, etching, thermal annealing, metal deposition, contacts placement 34 th RD 50 Workshop, Lancaster University, UK, 12 – 14 June 2019 9
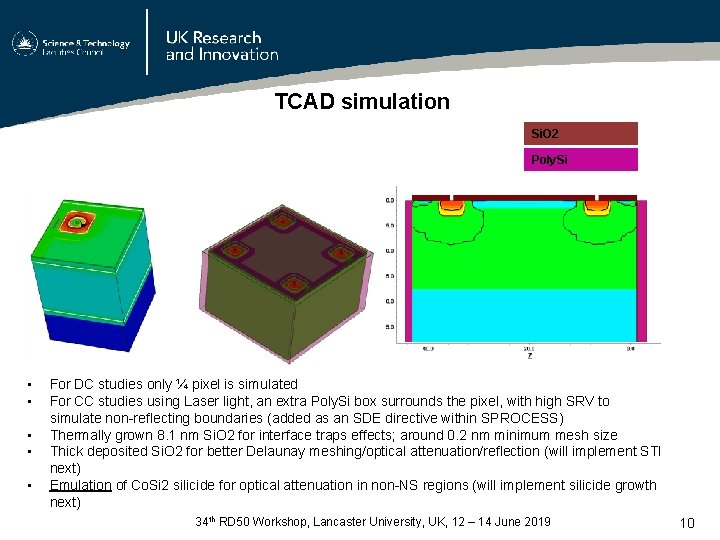
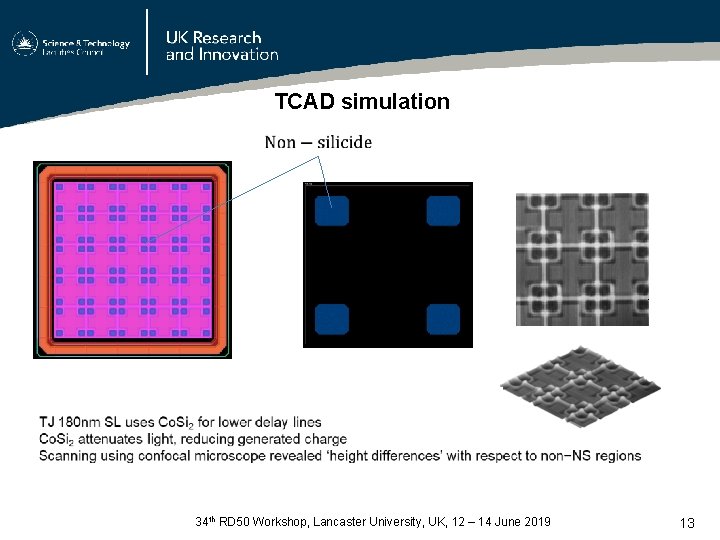
TCAD simulation Si. O 2 Poly. Si • • • For DC studies only ¼ pixel is simulated For CC studies using Laser light, an extra Poly. Si box surrounds the pixel, with high SRV to simulate non-reflecting boundaries (added as an SDE directive within SPROCESS) Thermally grown 8. 1 nm Si. O 2 for interface traps effects; around 0. 2 nm minimum mesh size Thick deposited Si. O 2 for better Delaunay meshing/optical attenuation/reflection (will implement STI next) Emulation of Co. Si 2 silicide for optical attenuation in non-NS regions (will implement silicide growth next) 34 th RD 50 Workshop, Lancaster University, UK, 12 – 14 June 2019 10
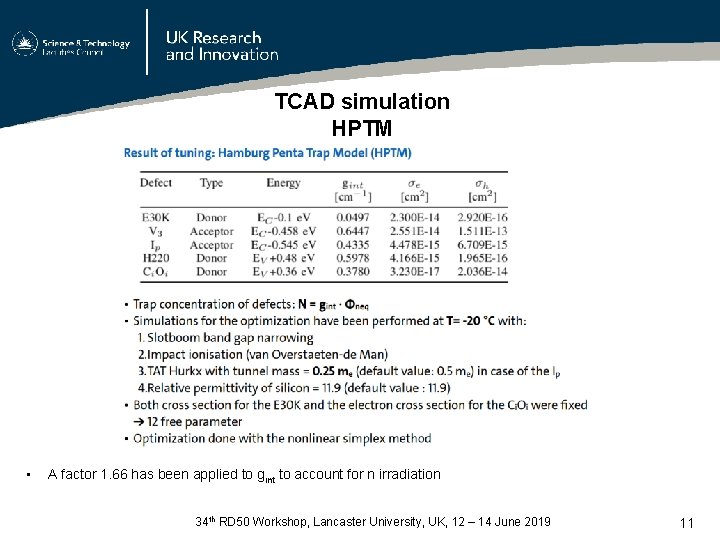
TCAD simulation HPTM • A factor 1. 66 has been applied to gint to account for n irradiation 34 th RD 50 Workshop, Lancaster University, UK, 12 – 14 June 2019 11
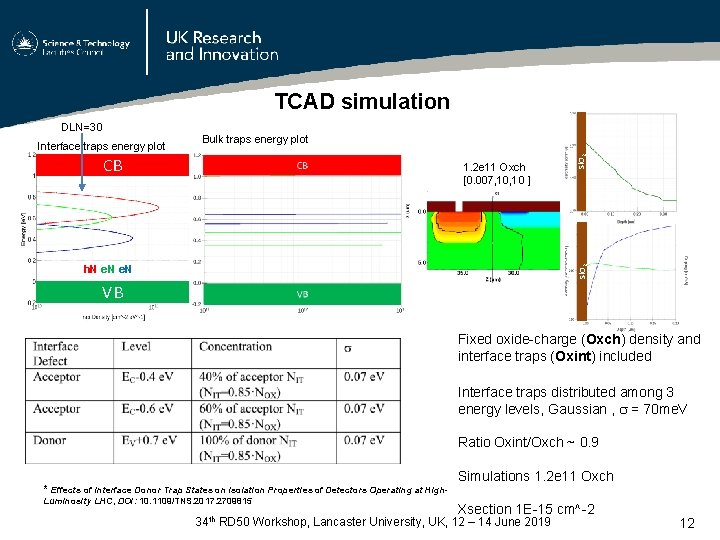
TCAD simulation Interface traps energy plot Bulk traps energy plot CB 1. 2 e 11 Oxch [0. 007, 10 ] Si. O 2 h. N e. N Si. O 2 DLN=30 VB Fixed oxide-charge (Oxch) density and interface traps (Oxint) included Interface traps distributed among 3 energy levels, Gaussian , = 70 me. V Ratio Oxint/Oxch ~ 0. 9 * Effects of Interface Donor Trap States on Isolation Properties of Detectors Operating at High. Luminosity LHC, DOI: 10. 1109/TNS. 2017. 2709815 Simulations 1. 2 e 11 Oxch Xsection 1 E-15 cm^-2 34 th RD 50 Workshop, Lancaster University, UK, 12 – 14 June 2019 12
TCAD simulation 34 th RD 50 Workshop, Lancaster University, UK, 12 – 14 June 2019 13
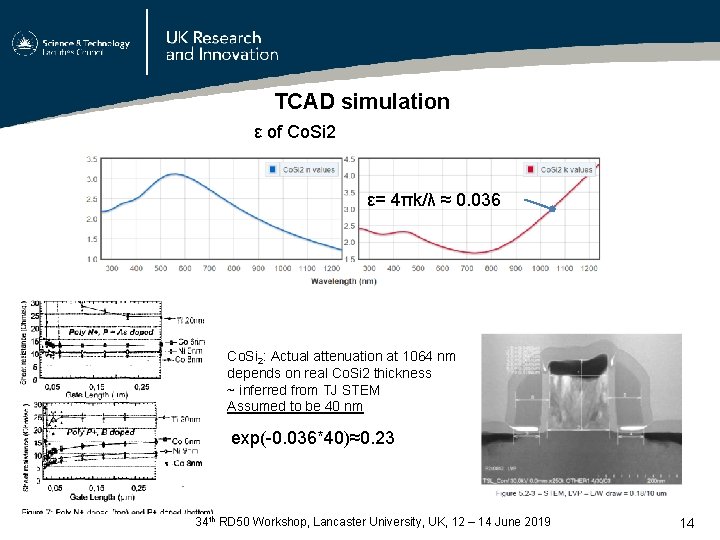
TCAD simulation ε of Co. Si 2 ε= 4πk/λ ≈ 0. 036 Co. Si 2: Actual attenuation at 1064 nm depends on real Co. Si 2 thickness ~ inferred from TJ STEM Assumed to be 40 nm exp(-0. 036*40)≈0. 23 34 th RD 50 Workshop, Lancaster University, UK, 12 – 14 June 2019 14
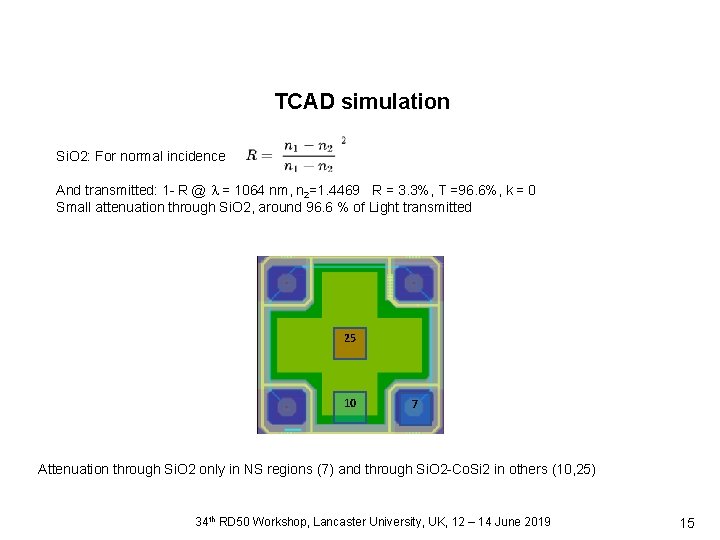
TCAD simulation Si. O 2: For normal incidence And transmitted: 1 - R @ = 1064 nm, n 2=1. 4469 R = 3. 3%, T =96. 6%, k = 0 Small attenuation through Si. O 2, around 96. 6 % of Light transmitted 25 10 7 Attenuation through Si. O 2 only in NS regions (7) and through Si. O 2 -Co. Si 2 in others (10, 25) 34 th RD 50 Workshop, Lancaster University, UK, 12 – 14 June 2019 15
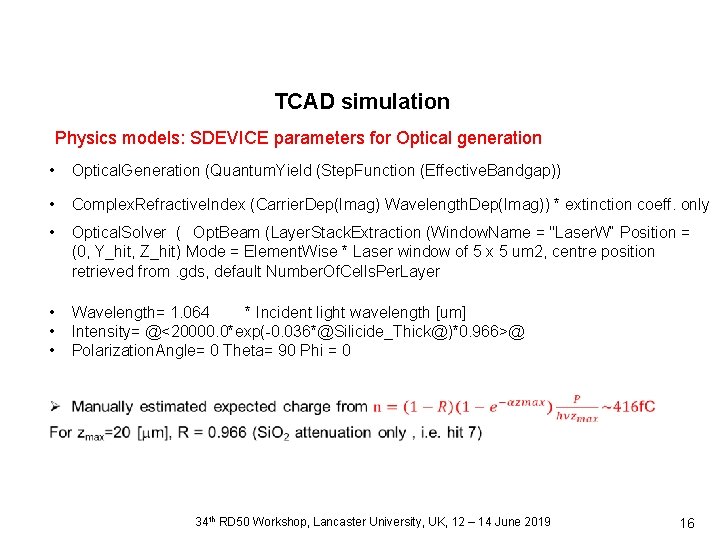
TCAD simulation Physics models: SDEVICE parameters for Optical generation • Optical. Generation (Quantum. Yield (Step. Function (Effective. Bandgap)) • Complex. Refractive. Index (Carrier. Dep(Imag) Wavelength. Dep(Imag)) * extinction coeff. only • Optical. Solver ( Opt. Beam (Layer. Stack. Extraction (Window. Name = "Laser. W“ Position = (0, Y_hit, Z_hit) Mode = Element. Wise * Laser window of 5 x 5 um 2, centre position retrieved from. gds, default Number. Of. Cells. Per. Layer • • • Wavelength= 1. 064 * Incident light wavelength [um] Intensity= @<20000. 0*exp(-0. 036*@Silicide_Thick@)*0. 966>@ Polarization. Angle= 0 Theta= 90 Phi = 0 34 th RD 50 Workshop, Lancaster University, UK, 12 – 14 June 2019 16
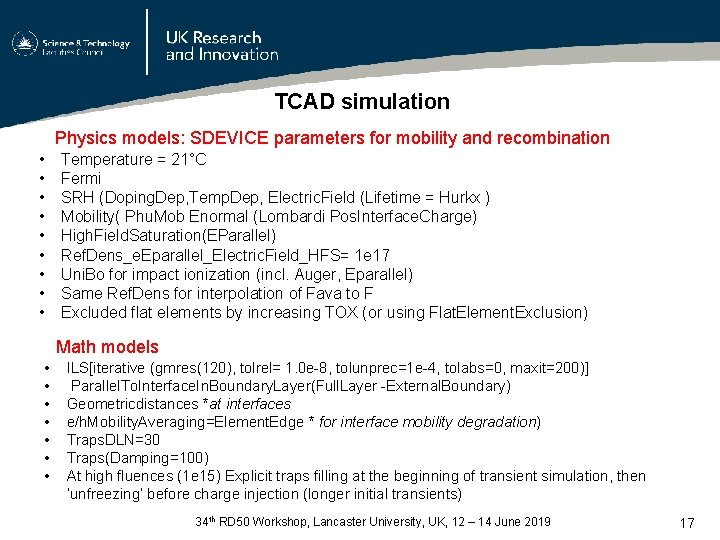
TCAD simulation Physics models: SDEVICE parameters for mobility and recombination • • • Temperature = 21°C Fermi SRH (Doping. Dep, Temp. Dep, Electric. Field (Lifetime = Hurkx ) Mobility( Phu. Mob Enormal (Lombardi Pos. Interface. Charge) High. Field. Saturation(EParallel) Ref. Dens_e. Eparallel_Electric. Field_HFS= 1 e 17 Uni. Bo for impact ionization (incl. Auger, Eparallel) Same Ref. Dens for interpolation of Fava to F Excluded flat elements by increasing TOX (or using Flat. Element. Exclusion) Math models • • ILS[iterative (gmres(120), tolrel= 1. 0 e-8, tolunprec=1 e-4, tolabs=0, maxit=200)] Parallel. To. Interface. In. Boundary. Layer(Full. Layer -External. Boundary) Geometricdistances *at interfaces e/h. Mobility. Averaging=Element. Edge * for interface mobility degradation) Traps. DLN=30 Traps(Damping=100) At high fluences (1 e 15) Explicit traps filling at the beginning of transient simulation, then ‘unfreezing’ before charge injection (longer initial transients) 34 th RD 50 Workshop, Lancaster University, UK, 12 – 14 June 2019 17
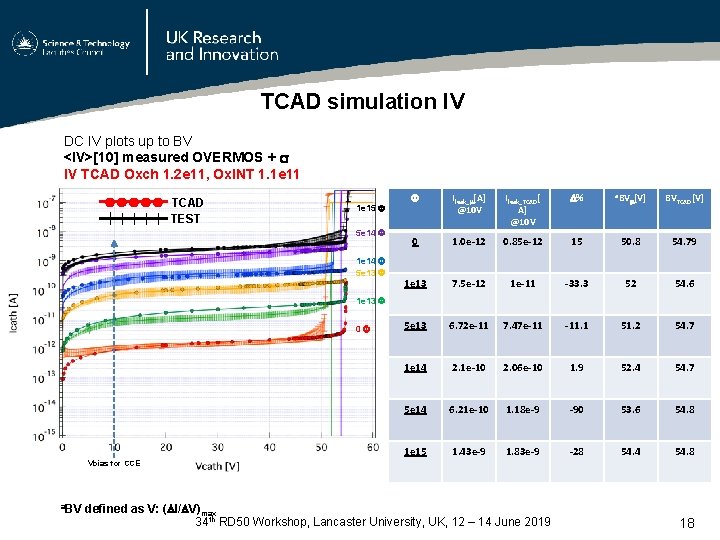
TCAD simulation IV DC IV plots up to BV <IV>[10] measured OVERMOS + IV TCAD Oxch 1. 2 e 11, Ox. INT 1. 1 e 11 TCAD TEST 1 e 15 5 e 14 1 e 14 5 e 13 Ileak_ [A] @10 V Ileak_TCAD[ A] @10 V % a. BV [V] BVTCAD[V] 0 1. 0 e-12 0. 85 e-12 15 50. 8 54. 79 1 e 13 7. 5 e-12 1 e-11 -33. 3 52 54. 6 5 e 13 6. 72 e-11 7. 47 e-11 -11. 1 51. 2 54. 7 1 e 14 2. 1 e-10 2. 06 e-10 1. 9 52. 4 54. 7 5 e 14 6. 21 e-10 1. 18 e-9 -90 53. 6 54. 8 1 e 15 1. 43 e-9 1. 83 e-9 -28 54. 4 54. 8 1 e 13 0 Vbias for CCE a. BV defined as V: ( I/ V)max 34 th RD 50 Workshop, Lancaster University, UK, 12 – 14 June 2019 18
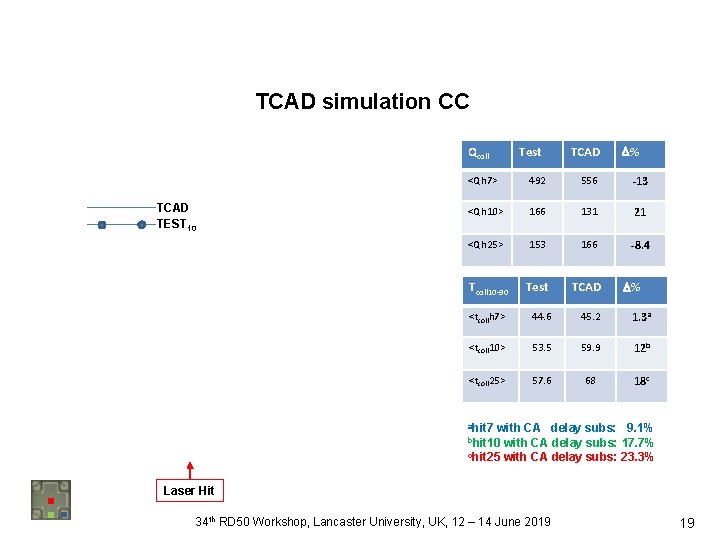
TCAD simulation CC Qcoll TCAD TEST 10 Test TCAD % <Qh 7> 492 556 -13 <Qh 10> 166 131 21 <Qh 25> 153 166 -8. 4 Tcoll 10 -90 Test TCAD <tcollh 7> 44. 6 45. 2 1. 3 a <tcoll 10> 53. 5 59. 9 12 b <tcoll 25> 57. 6 68 18 c % ahit 7 with CA delay subs: 9. 1% with CA delay subs: 17. 7% chit 25 with CA delay subs: 23. 3% bhit 10 Laser Hit 34 th RD 50 Workshop, Lancaster University, UK, 12 – 14 June 2019 19
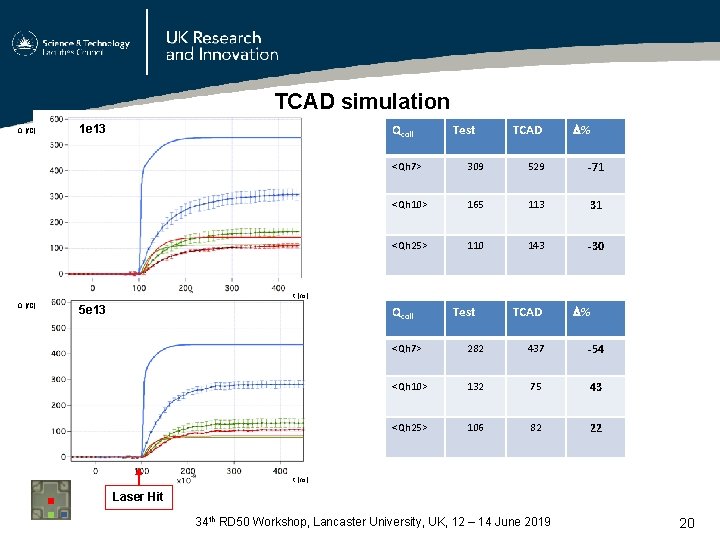
TCAD simulation Q [f. C] Qcoll 1 e 13 Test TCAD % <Qh 7> 309 529 -71 <Qh 10> 165 113 31 <Qh 25> 110 143 -30 t [ns] Q [f. C] 5 e 13 Qcoll Test TCAD % <Qh 7> 282 437 -54 <Qh 10> 132 75 43 <Qh 25> 106 82 22 t [ns] Laser Hit 34 th RD 50 Workshop, Lancaster University, UK, 12 – 14 June 2019 20
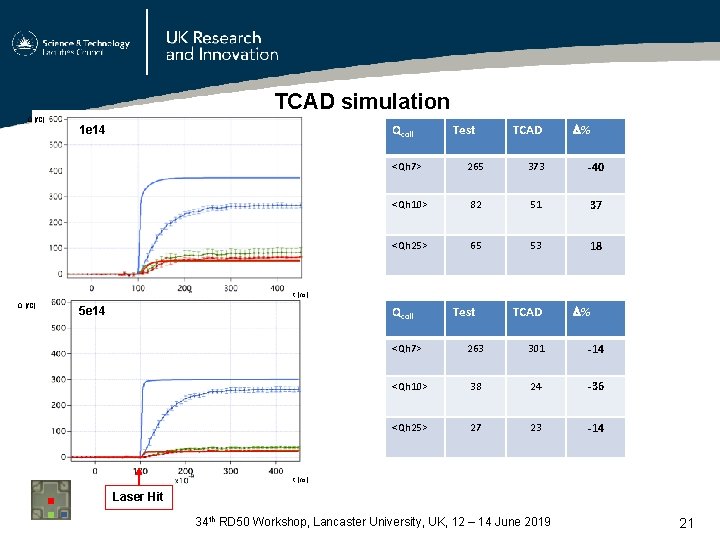
TCAD simulation Q [f. C] Qcoll 1 e 14 Test TCAD % <Qh 7> 265 373 -40 <Qh 10> 82 51 37 <Qh 25> 65 53 18 t [ns] Q [f. C] Qcoll 5 e 14 Test TCAD % <Qh 7> 263 301 -14 <Qh 10> 38 24 -36 <Qh 25> 27 23 -14 t [ns] Laser Hit 34 th RD 50 Workshop, Lancaster University, UK, 12 – 14 June 2019 21
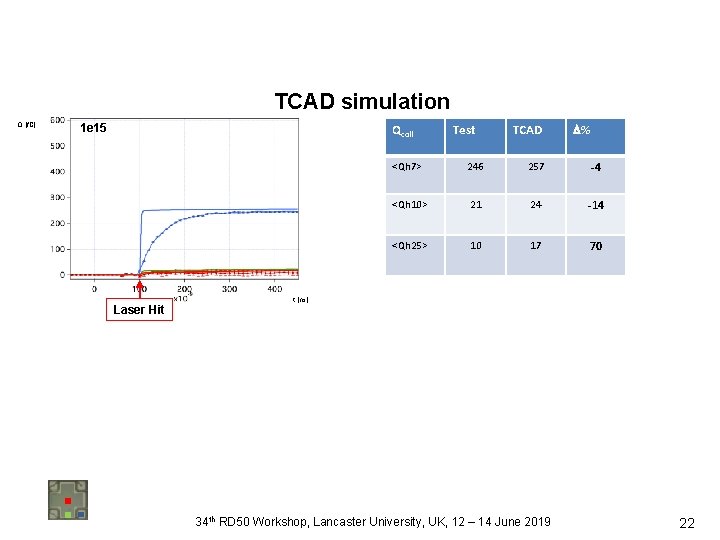
TCAD simulation Q [f. C] 1 e 15 Qcoll Laser Hit Test TCAD % <Qh 7> 246 257 -4 <Qh 10> 21 24 -14 <Qh 25> 10 17 70 t [ns] 34 th RD 50 Workshop, Lancaster University, UK, 12 – 14 June 2019 22
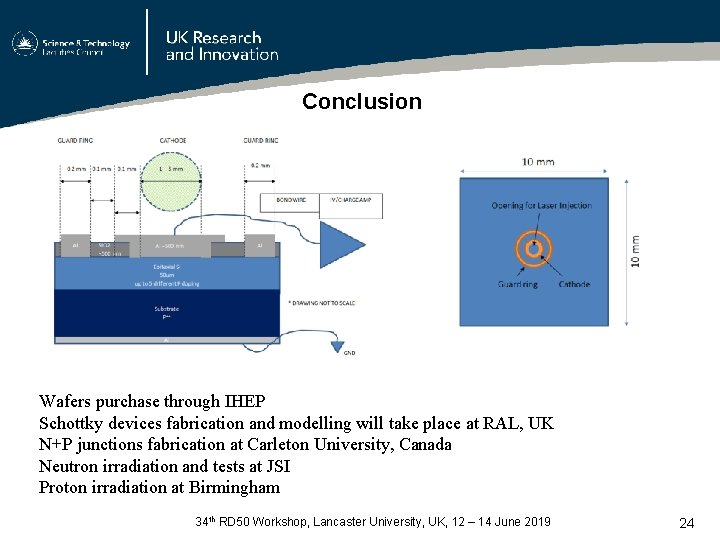
RD 50 funding request 1. RAL PPD, UK 2. IHEP, China 3. JSI, Slovenia 4. University of Birmingham, UK We propose to fabricate a number of Schottky and n+p diodes on p-type epitaxial (50 um thick) silicon wafers, of doping concentration as they are normally used in CMOS MAPS devices, to investigate radiation bulk damage in CMOS sensors The purpose is to gain a deep understanding of radiation damage in such structures with a view to develop reliable damage models that can be implemented in TCAD device simulators (Synopsys or Silvaco). We will purchase 6 inch wafers, 25 x 5 doping levels (1 e 13, 1 e 14, 1 e 15, 1 e 16 and 1 e 17 cm-3 ), total 125 wafers. The remaining wafers, upon agreement, could be distributed among other groups and/or RD 50 institutes interested in participating in this project, whether at device design and/or at device test level 34 th RD 50 Workshop, Lancaster University, UK, 12 – 14 June 2019 23
Conclusion Wafers purchase through IHEP Schottky devices fabrication and modelling will take place at RAL, UK N+P junctions fabrication at Carleton University, Canada Neutron irradiation and tests at JSI Proton irradiation at Birmingham 34 th RD 50 Workshop, Lancaster University, UK, 12 – 14 June 2019 24
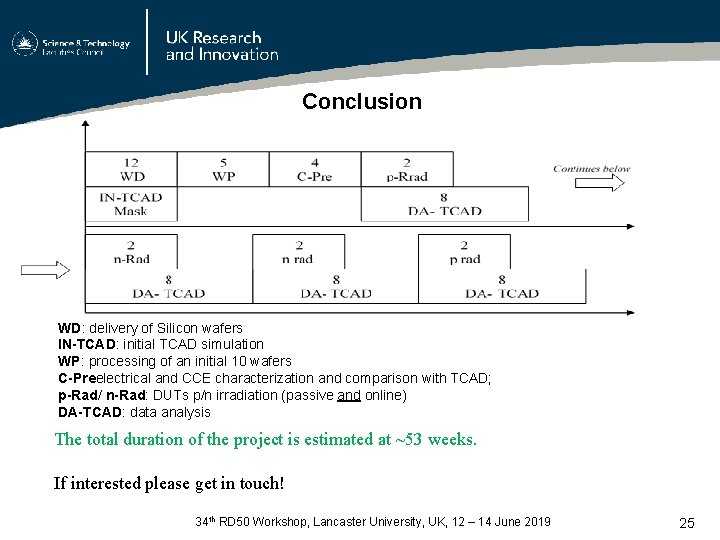
Conclusion WD: delivery of Silicon wafers IN-TCAD: initial TCAD simulation WP: processing of an initial 10 wafers C-Preelectrical and CCE characterization and comparison with TCAD; p-Rad/ n-Rad: DUTs p/n irradiation (passive and online) DA-TCAD: data analysis The total duration of the project is estimated at ~53 weeks. If interested please get in touch! 34 th RD 50 Workshop, Lancaster University, UK, 12 – 14 June 2019 25
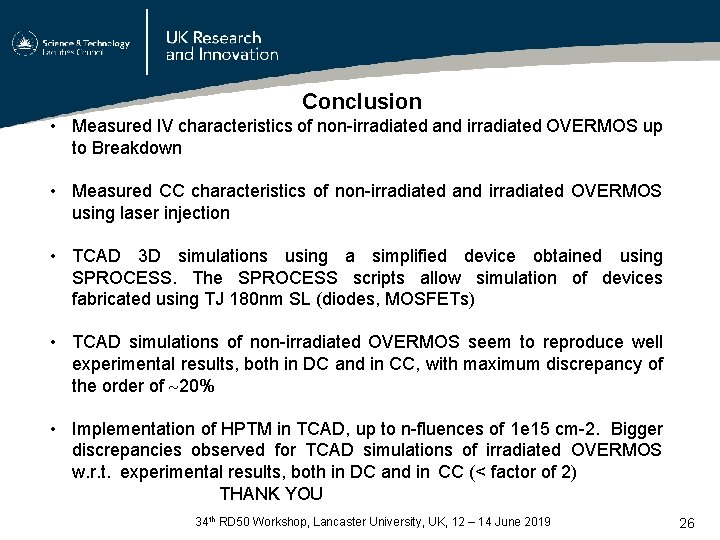
Conclusion • Measured IV characteristics of non-irradiated and irradiated OVERMOS up to Breakdown • Measured CC characteristics of non-irradiated and irradiated OVERMOS using laser injection • TCAD 3 D simulations using a simplified device obtained using SPROCESS. The SPROCESS scripts allow simulation of devices fabricated using TJ 180 nm SL (diodes, MOSFETs) • TCAD simulations of non-irradiated OVERMOS seem to reproduce well experimental results, both in DC and in CC, with maximum discrepancy of the order of 20% • Implementation of HPTM in TCAD, up to n-fluences of 1 e 15 cm-2. Bigger discrepancies observed for TCAD simulations of irradiated OVERMOS w. r. t. experimental results, both in DC and in CC (< factor of 2) THANK YOU 34 th RD 50 Workshop, Lancaster University, UK, 12 – 14 June 2019 26
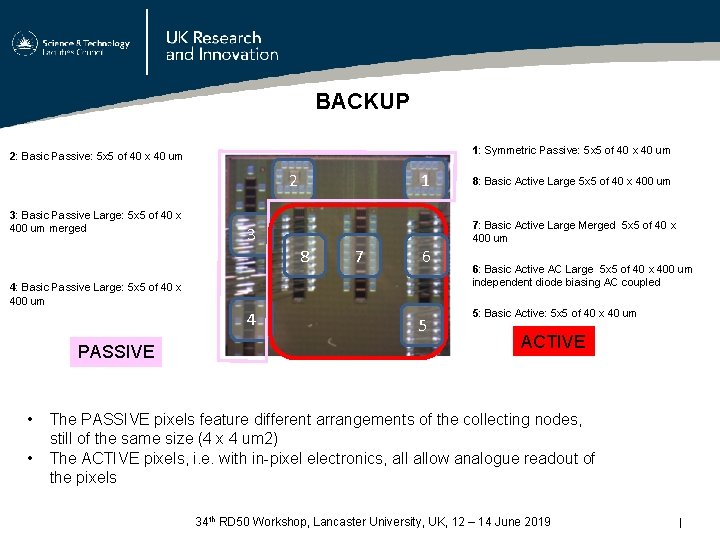
BACKUP 1: Symmetric Passive: 5 x 5 of 40 x 40 um 2: Basic Passive: 5 x 5 of 40 x 40 um 2 3: Basic Passive Large: 5 x 5 of 40 x 400 um merged 3 1 7: Basic Active Large Merged 5 x 5 of 40 x 400 um 8 7 6 4: Basic Passive Large: 5 x 5 of 40 x 400 um 4 PASSIVE • • 8: Basic Active Large 5 x 5 of 40 x 400 um 5 6: Basic Active AC Large 5 x 5 of 40 x 400 um independent diode biasing AC coupled 5: Basic Active: 5 x 5 of 40 x 40 um ACTIVE The PASSIVE pixels feature different arrangements of the collecting nodes, still of the same size (4 x 4 um 2) The ACTIVE pixels, i. e. with in-pixel electronics, allow analogue readout of the pixels 34 th RD 50 Workshop, Lancaster University, UK, 12 – 14 June 2019 I
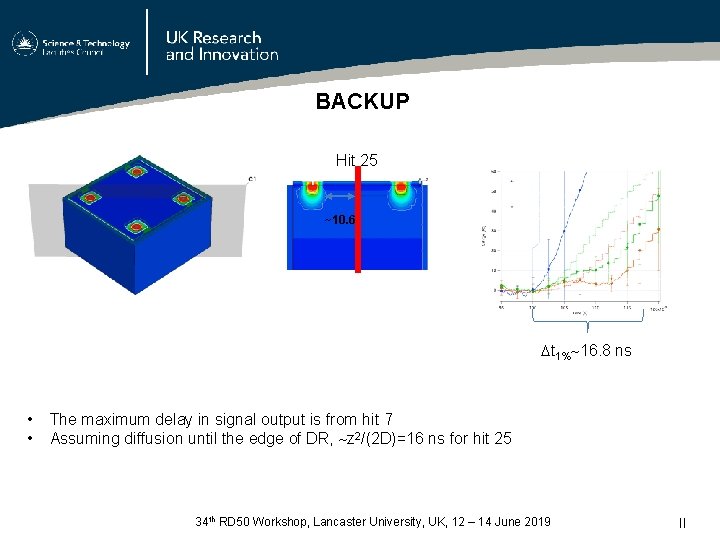
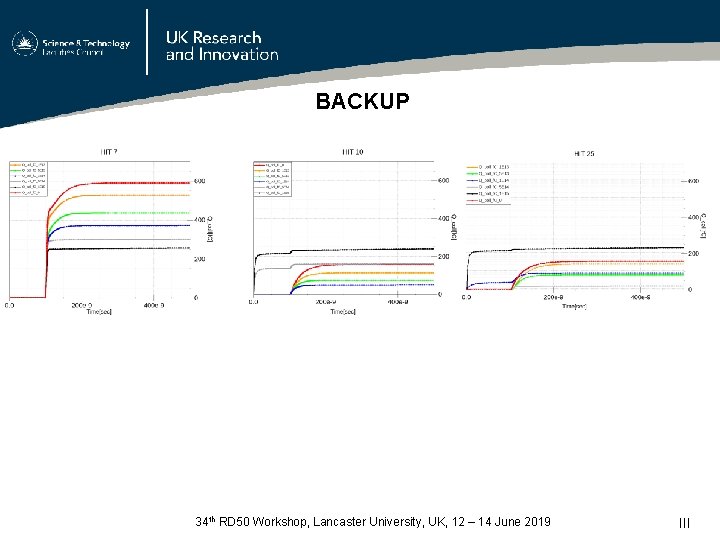
BACKUP Hit 25 ~10. 6 t 1% 16. 8 ns • • The maximum delay in signal output is from hit 7 Assuming diffusion until the edge of DR, z 2/(2 D)=16 ns for hit 25 34 th RD 50 Workshop, Lancaster University, UK, 12 – 14 June 2019 II
BACKUP 34 th RD 50 Workshop, Lancaster University, UK, 12 – 14 June 2019 III
OVERMOS Laser Test =1 e 13 =5 e 13 TRG [V] Q [f. C] =1 e 14 TRG [V] t [s] TRG [V] Q [f. C] t [s] Laser TRG =5 e 14 Q [f. C] =1 e 15 TRG [V] t [s] Q [f. C] t [s-1] [cm-2] TRG [V] t [s] Kinematics of charge collection – charge collection time of point 25 34 th RD 50 Workshop, Lancaster University, UK, 12 – 14 June 2019 IIII
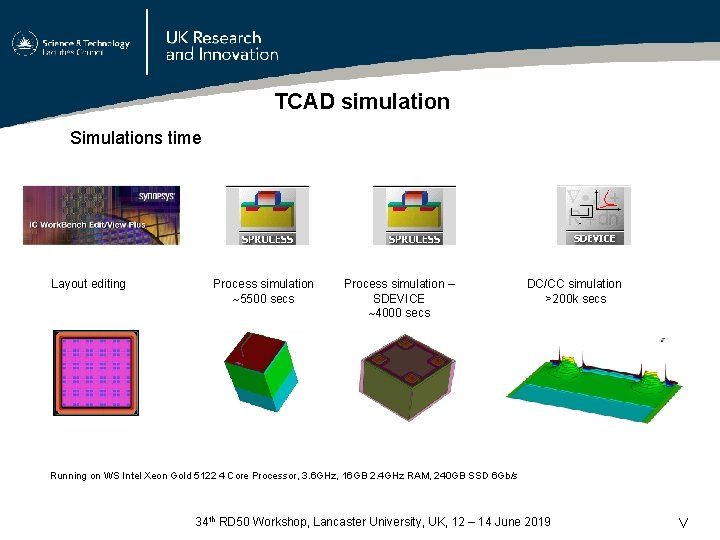
TCAD simulation Simulations time Layout editing Process simulation 5500 secs Process simulation – SDEVICE 4000 secs DC/CC simulation >200 k secs Running on WS Intel Xeon Gold 5122 4 Core Processor, 3. 6 GHz, 16 GB 2. 4 GHz RAM, 240 GB SSD 6 Gb/s 34 th RD 50 Workshop, Lancaster University, UK, 12 – 14 June 2019 V