TAU Performance Tuning Tool Sun Yongzhao Introduction What
- Slides: 15

TAU Performance Tuning Tool Sun Yongzhao

Introduction - What is TAU? r r r Tuning and Analysis Utilities Performance system framework for scalable parallel and distributed high-performance computing Targets a general complex system computation model ¦ ¦ r Integrated toolkit for performance instrumentation, measurement, analysis, and visualization ¦ ¦ r r nodes / contexts / threads Multi-level: system / software / parallelism Portable, configurable performance profiling/tracing facility Open software approach University of Oregon http: //www. cs. uoregon. edu/research/paracomp/tau

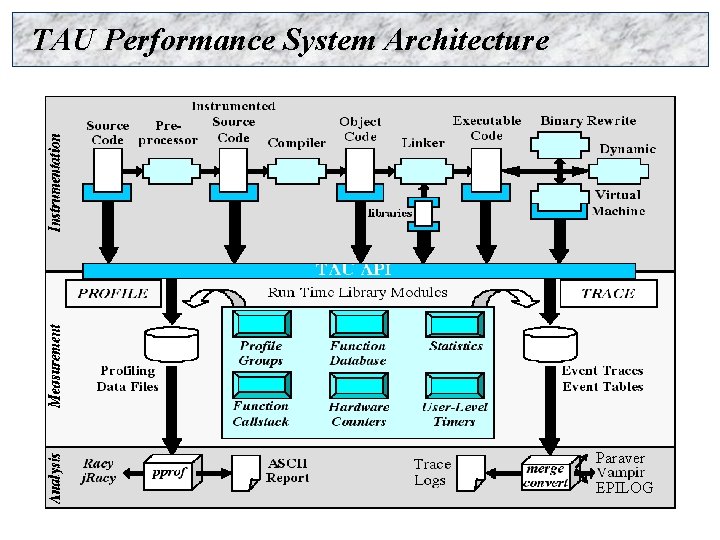
TAU Performance System Architecture Paraver EPILOG

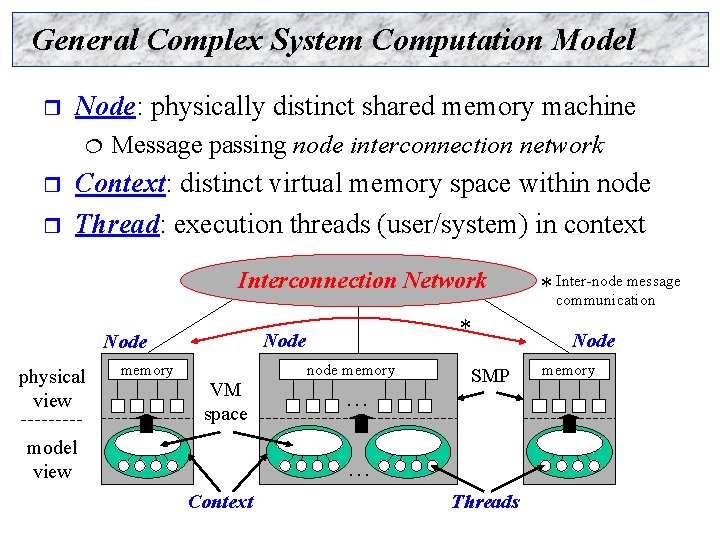
General Complex System Computation Model r Node: physically distinct shared memory machine ¦ r r Message passing node interconnection network Context: distinct virtual memory space within node Thread: execution threads (user/system) in context Interconnection Network physical view memory * Node VM space model view node memory … Node SMP … Context message * Inter-node communication Threads memory

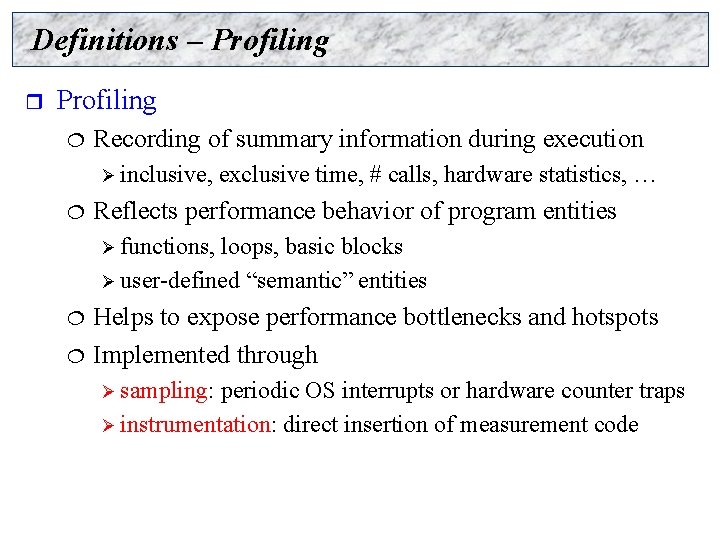
Definitions – Profiling r Profiling ¦ Recording of summary information during execution Ø inclusive, ¦ exclusive time, # calls, hardware statistics, … Reflects performance behavior of program entities Ø functions, loops, basic blocks Ø user-defined “semantic” entities ¦ ¦ Helps to expose performance bottlenecks and hotspots Implemented through Ø sampling: periodic OS interrupts or hardware counter traps Ø instrumentation: direct insertion of measurement code

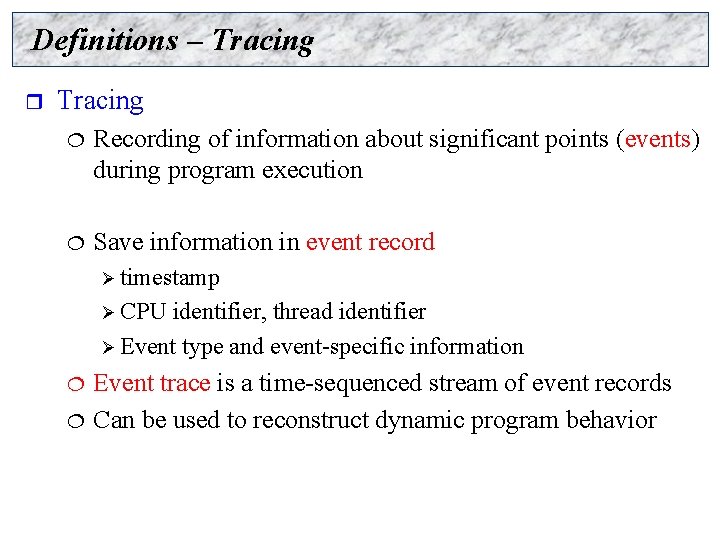
Definitions – Tracing r Tracing ¦ Recording of information about significant points (events) during program execution ¦ Save information in event record Ø timestamp Ø CPU identifier, thread identifier Ø Event type and event-specific information ¦ ¦ Event trace is a time-sequenced stream of event records Can be used to reconstruct dynamic program behavior

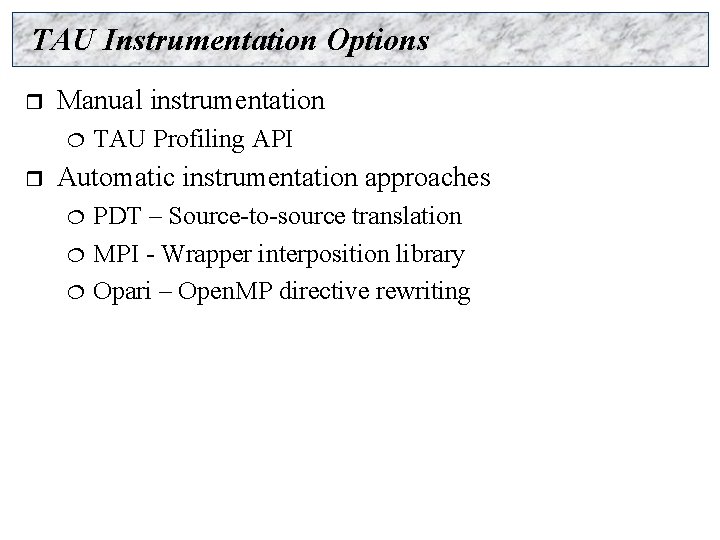
TAU Instrumentation Options r Manual instrumentation ¦ r TAU Profiling API Automatic instrumentation approaches ¦ ¦ ¦ PDT – Source-to-source translation MPI - Wrapper interposition library Opari – Open. MP directive rewriting

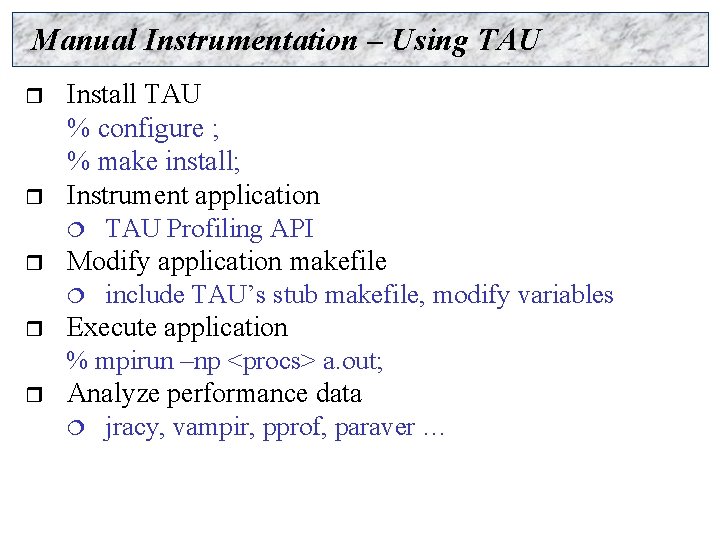
Manual Instrumentation – Using TAU r r r Install TAU % configure ; % make install; Instrument application ¦ TAU Profiling API Modify application makefile ¦ include TAU’s stub makefile, modify variables Execute application % mpirun –np <procs> a. out; Analyze performance data ¦ jracy, vampir, pprof, paraver …

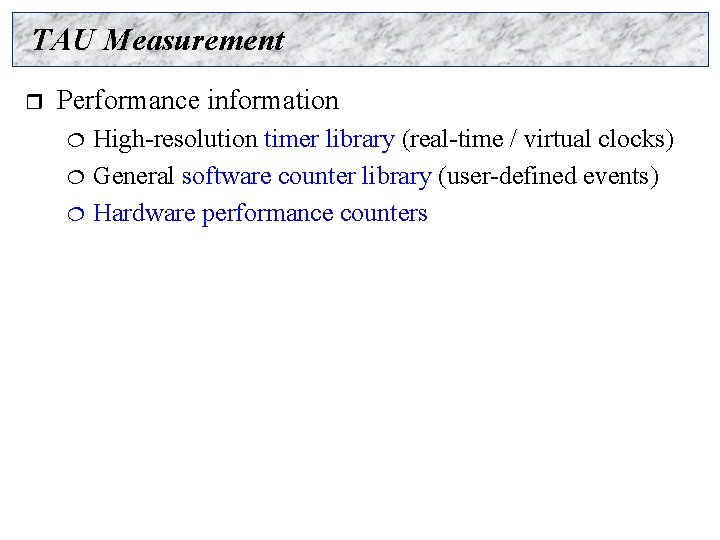
TAU Measurement r Performance information ¦ ¦ ¦ High-resolution timer library (real-time / virtual clocks) General software counter library (user-defined events) Hardware performance counters

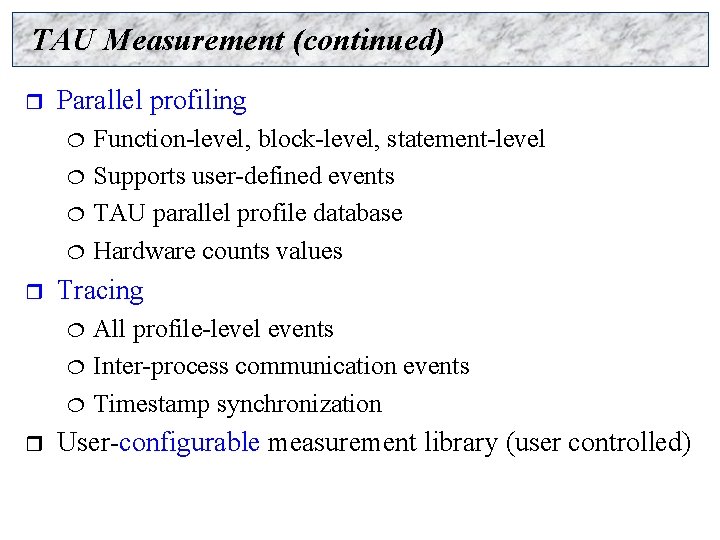
TAU Measurement (continued) r Parallel profiling ¦ ¦ r Tracing ¦ ¦ ¦ r Function-level, block-level, statement-level Supports user-defined events TAU parallel profile database Hardware counts values All profile-level events Inter-process communication events Timestamp synchronization User-configurable measurement library (user controlled)

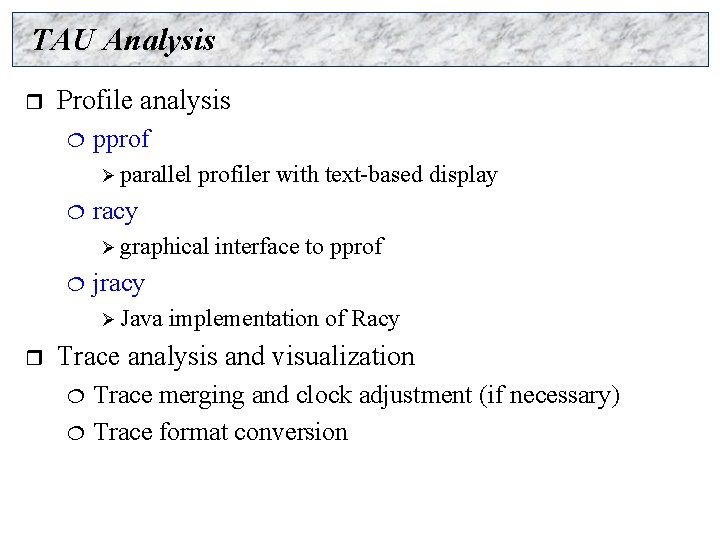
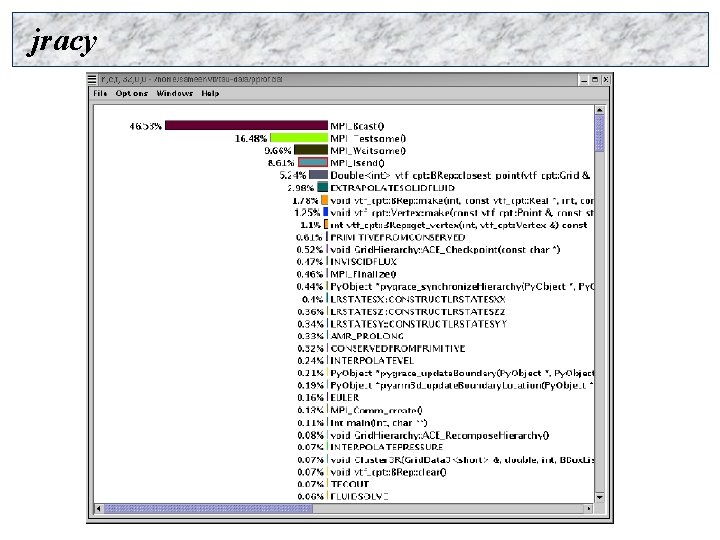
TAU Analysis r Profile analysis ¦ pprof Ø parallel ¦ profiler with text-based display racy Ø graphical ¦ jracy Ø Java r interface to pprof implementation of Racy Trace analysis and visualization ¦ ¦ Trace merging and clock adjustment (if necessary) Trace format conversion

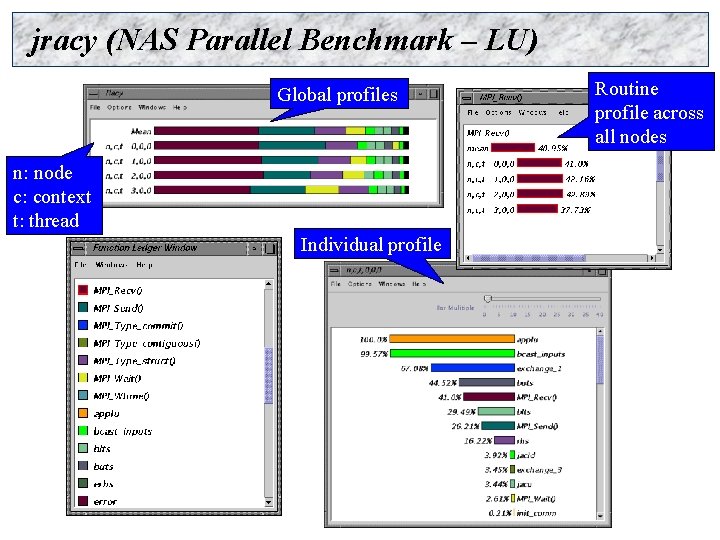
jracy (NAS Parallel Benchmark – LU) Global profiles n: node c: context t: thread Individual profile Routine profile across all nodes

jracy

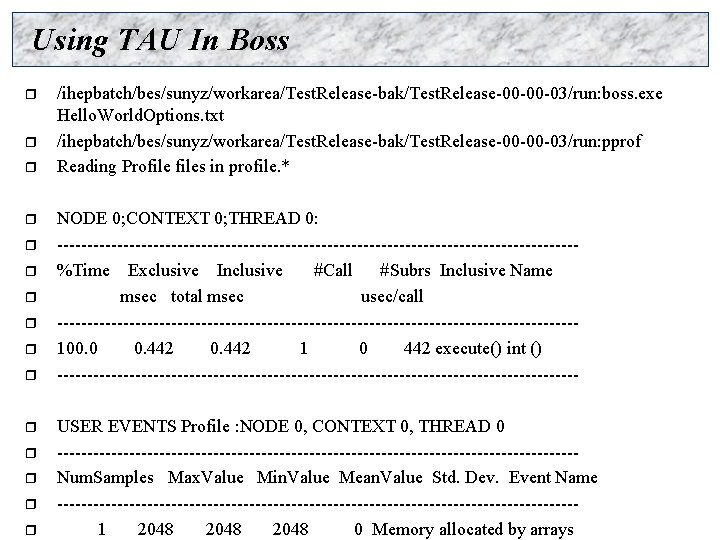
Using TAU In Boss r r r r /ihepbatch/bes/sunyz/workarea/Test. Release-bak/Test. Release-00 -00 -03/run: boss. exe Hello. World. Options. txt /ihepbatch/bes/sunyz/workarea/Test. Release-bak/Test. Release-00 -00 -03/run: pprof Reading Profiles in profile. * NODE 0; CONTEXT 0; THREAD 0: -------------------------------------------%Time Exclusive Inclusive #Call #Subrs Inclusive Name msec total msec usec/call -------------------------------------------100. 0 0. 442 1 0 442 execute() int () -------------------------------------------USER EVENTS Profile : NODE 0, CONTEXT 0, THREAD 0 -------------------------------------------Num. Samples Max. Value Min. Value Mean. Value Std. Dev. Event Name -------------------------------------------1 2048 0 Memory allocated by arrays

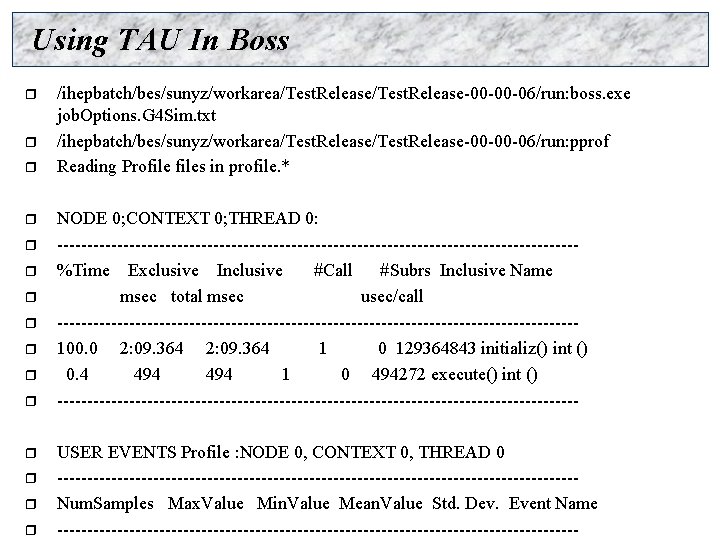
Using TAU In Boss r r r r /ihepbatch/bes/sunyz/workarea/Test. Release-00 -00 -06/run: boss. exe job. Options. G 4 Sim. txt /ihepbatch/bes/sunyz/workarea/Test. Release-00 -00 -06/run: pprof Reading Profiles in profile. * NODE 0; CONTEXT 0; THREAD 0: -------------------------------------------%Time Exclusive Inclusive #Call #Subrs Inclusive Name msec total msec usec/call -------------------------------------------100. 0 2: 09. 364 1 0 129364843 initializ() int () 0. 4 494 1 0 494272 execute() int () -------------------------------------------USER EVENTS Profile : NODE 0, CONTEXT 0, THREAD 0 -------------------------------------------Num. Samples Max. Value Min. Value Mean. Value Std. Dev. Event Name --------------------------------------------