TAU Performance System Framework r r r Tuning
![Pprof Command pprof [-c|-b|-m|-t|-e|-i] [-r] [-s] [-n num] [-f file] [-l] [nodes] ¦ -c Pprof Command pprof [-c|-b|-m|-t|-e|-i] [-r] [-s] [-n num] [-f file] [-l] [nodes] ¦ -c](https://slidetodoc.com/presentation_image_h2/7b3fede430b53be2e233c4eac35c1d90/image-14.jpg)
- Slides: 24

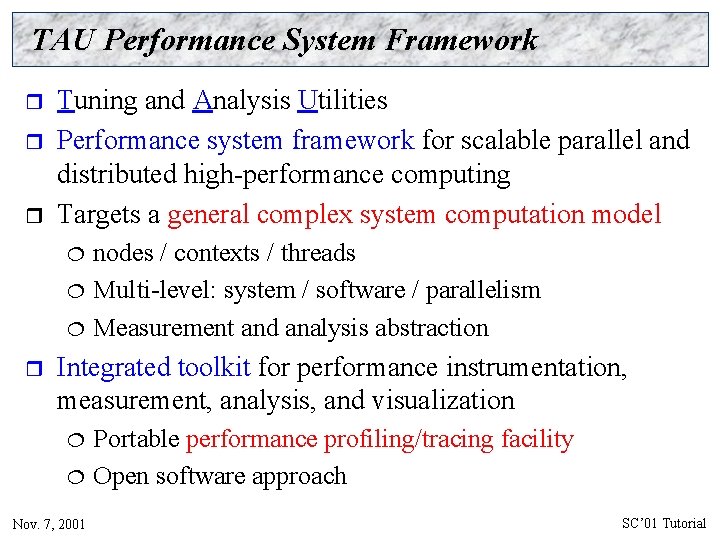
TAU Performance System Framework r r r Tuning and Analysis Utilities Performance system framework for scalable parallel and distributed high-performance computing Targets a general complex system computation model ¦ ¦ ¦ r nodes / contexts / threads Multi-level: system / software / parallelism Measurement and analysis abstraction Integrated toolkit for performance instrumentation, measurement, analysis, and visualization ¦ ¦ Nov. 7, 2001 Portable performance profiling/tracing facility Open software approach SC’ 01 Tutorial

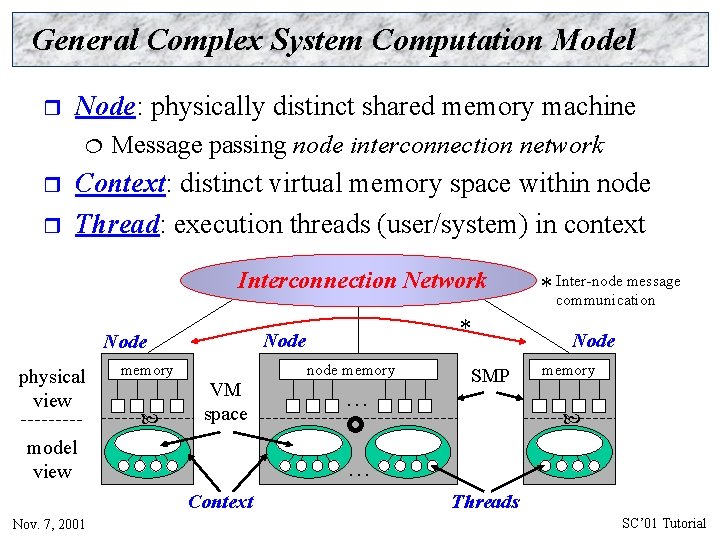
General Complex System Computation Model r Node: physically distinct shared memory machine ¦ r r Message passing node interconnection network Context: distinct virtual memory space within node Thread: execution threads (user/system) in context Interconnection Network physical view memory VM space model view node memory … Node SMP memory … Context Nov. 7, 2001 * Node message * Inter-node communication Threads SC’ 01 Tutorial

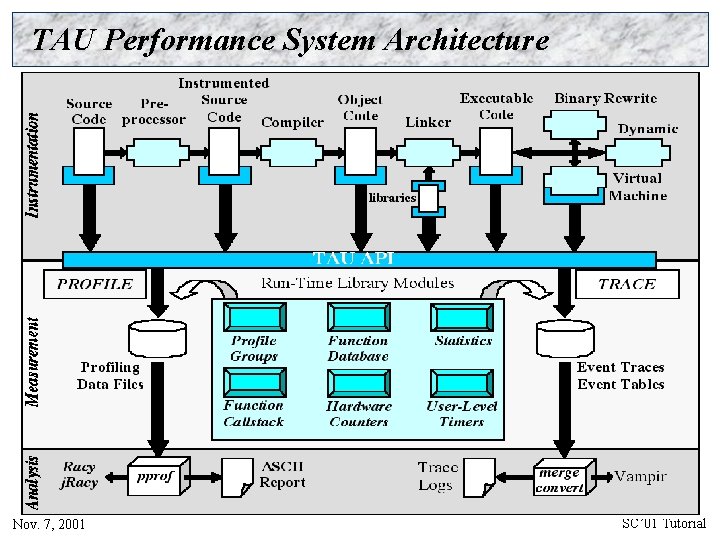
TAU Performance System Architecture Nov. 7, 2001 SC’ 01 Tutorial

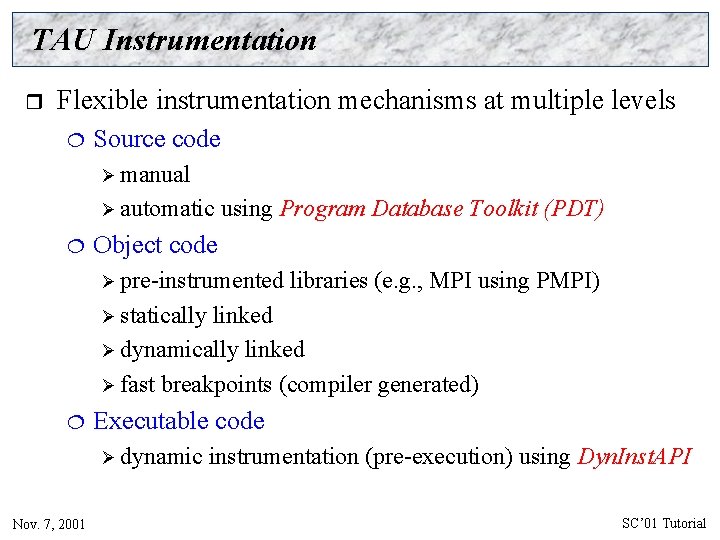
TAU Instrumentation r Flexible instrumentation mechanisms at multiple levels ¦ Source code Ø manual Ø automatic ¦ using Program Database Toolkit (PDT) Object code Ø pre-instrumented libraries (e. g. , MPI using PMPI) Ø statically linked Ø dynamically linked Ø fast breakpoints (compiler generated) ¦ Executable code Ø dynamic Nov. 7, 2001 instrumentation (pre-execution) using Dyn. Inst. API SC’ 01 Tutorial

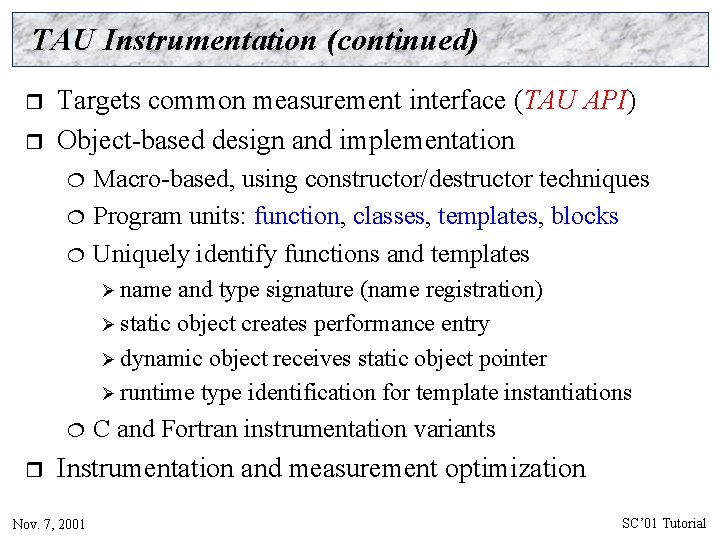
TAU Instrumentation (continued) r r Targets common measurement interface (TAU API) Object-based design and implementation ¦ ¦ ¦ Macro-based, using constructor/destructor techniques Program units: function, classes, templates, blocks Uniquely identify functions and templates Ø name and type signature (name registration) Ø static object creates performance entry Ø dynamic object receives static object pointer Ø runtime type identification for template instantiations ¦ r C and Fortran instrumentation variants Instrumentation and measurement optimization Nov. 7, 2001 SC’ 01 Tutorial

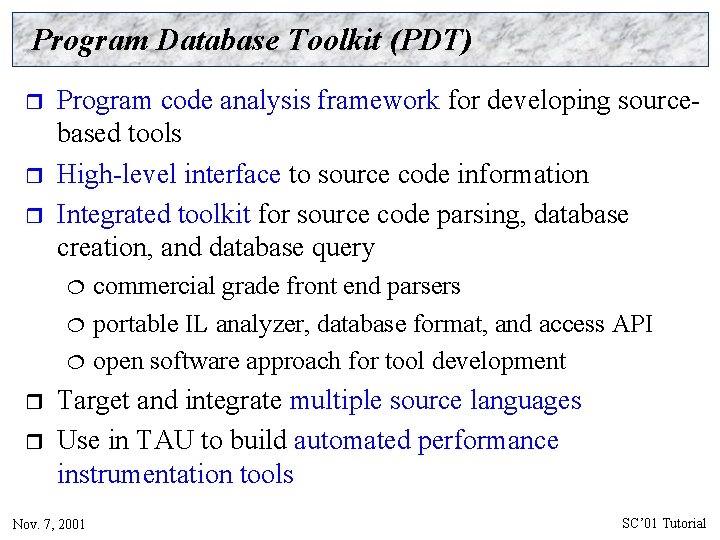
Program Database Toolkit (PDT) r r r Program code analysis framework for developing sourcebased tools High-level interface to source code information Integrated toolkit for source code parsing, database creation, and database query ¦ ¦ ¦ r r commercial grade front end parsers portable IL analyzer, database format, and access API open software approach for tool development Target and integrate multiple source languages Use in TAU to build automated performance instrumentation tools Nov. 7, 2001 SC’ 01 Tutorial

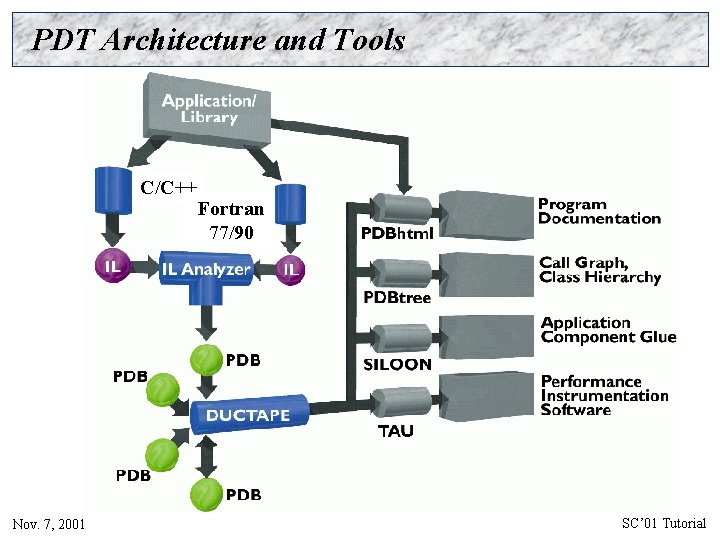
PDT Architecture and Tools C/C++ Fortran 77/90 Nov. 7, 2001 SC’ 01 Tutorial

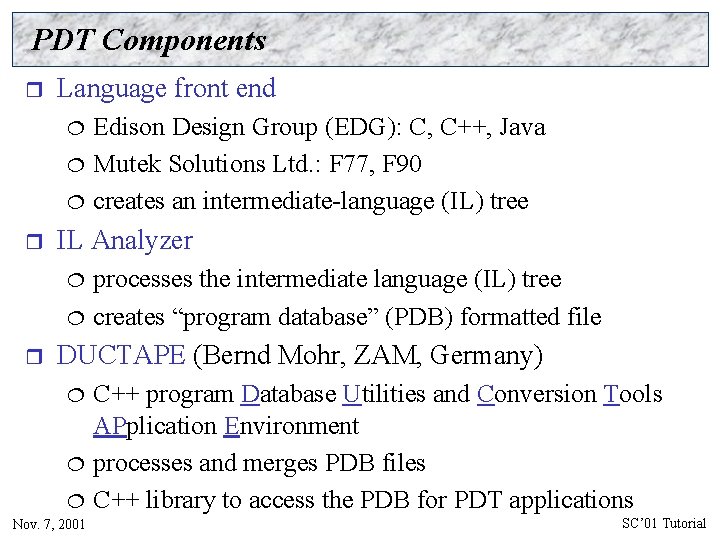
PDT Components r Language front end ¦ ¦ ¦ r IL Analyzer ¦ ¦ r Edison Design Group (EDG): C, C++, Java Mutek Solutions Ltd. : F 77, F 90 creates an intermediate-language (IL) tree processes the intermediate language (IL) tree creates “program database” (PDB) formatted file DUCTAPE (Bernd Mohr, ZAM, Germany) ¦ ¦ ¦ Nov. 7, 2001 C++ program Database Utilities and Conversion Tools APplication Environment processes and merges PDB files C++ library to access the PDB for PDT applications SC’ 01 Tutorial

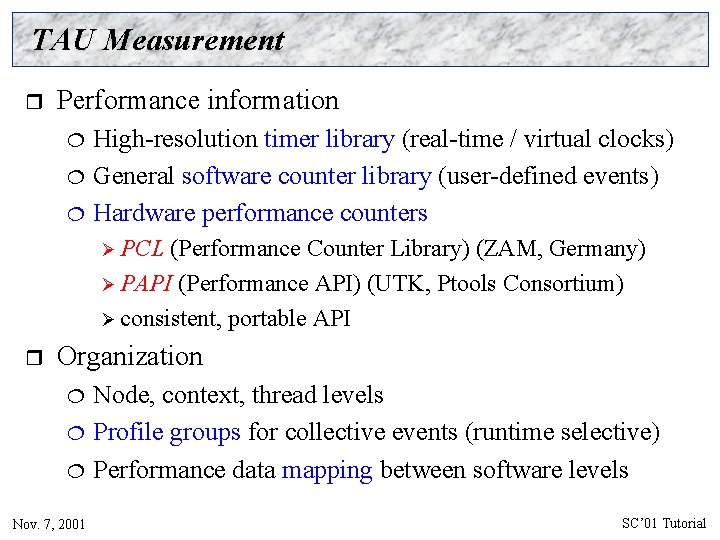
TAU Measurement r Performance information ¦ ¦ ¦ High-resolution timer library (real-time / virtual clocks) General software counter library (user-defined events) Hardware performance counters Ø PCL (Performance Counter Library) (ZAM, Germany) Ø PAPI (Performance API) (UTK, Ptools Consortium) Ø consistent, portable API r Organization ¦ ¦ ¦ Nov. 7, 2001 Node, context, thread levels Profile groups for collective events (runtime selective) Performance data mapping between software levels SC’ 01 Tutorial

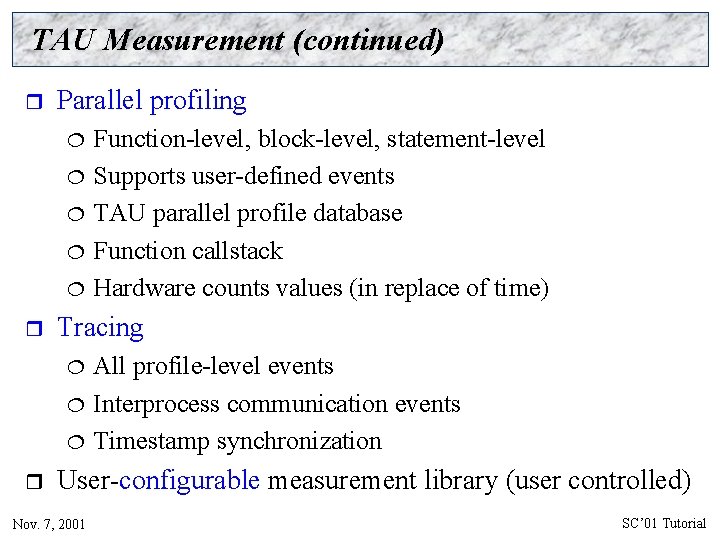
TAU Measurement (continued) r Parallel profiling ¦ ¦ ¦ r Tracing ¦ ¦ ¦ r Function-level, block-level, statement-level Supports user-defined events TAU parallel profile database Function callstack Hardware counts values (in replace of time) All profile-level events Interprocess communication events Timestamp synchronization User-configurable measurement library (user controlled) Nov. 7, 2001 SC’ 01 Tutorial

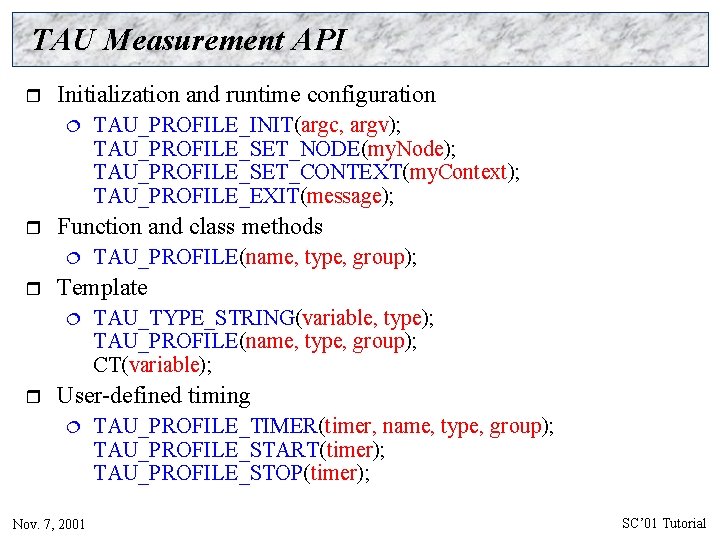
TAU Measurement API r Initialization and runtime configuration ¦ r Function and class methods ¦ r TAU_PROFILE(name, type, group); Template ¦ r TAU_PROFILE_INIT(argc, argv); TAU_PROFILE_SET_NODE(my. Node); TAU_PROFILE_SET_CONTEXT(my. Context); TAU_PROFILE_EXIT(message); TAU_TYPE_STRING(variable, type); TAU_PROFILE(name, type, group); CT(variable); User-defined timing ¦ Nov. 7, 2001 TAU_PROFILE_TIMER(timer, name, type, group); TAU_PROFILE_START(timer); TAU_PROFILE_STOP(timer); SC’ 01 Tutorial

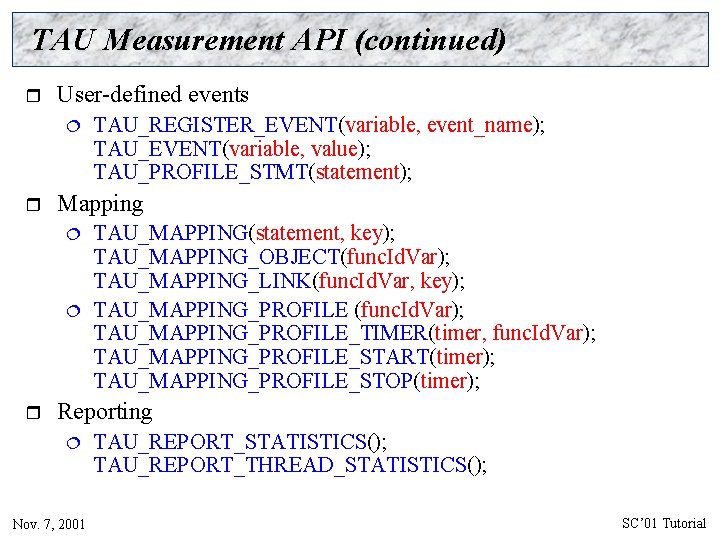
TAU Measurement API (continued) r User-defined events ¦ r Mapping ¦ ¦ r TAU_REGISTER_EVENT(variable, event_name); TAU_EVENT(variable, value); TAU_PROFILE_STMT(statement); TAU_MAPPING(statement, key); TAU_MAPPING_OBJECT(func. Id. Var); TAU_MAPPING_LINK(func. Id. Var, key); TAU_MAPPING_PROFILE (func. Id. Var); TAU_MAPPING_PROFILE_TIMER(timer, func. Id. Var); TAU_MAPPING_PROFILE_START(timer); TAU_MAPPING_PROFILE_STOP(timer); Reporting ¦ Nov. 7, 2001 TAU_REPORT_STATISTICS(); TAU_REPORT_THREAD_STATISTICS(); SC’ 01 Tutorial

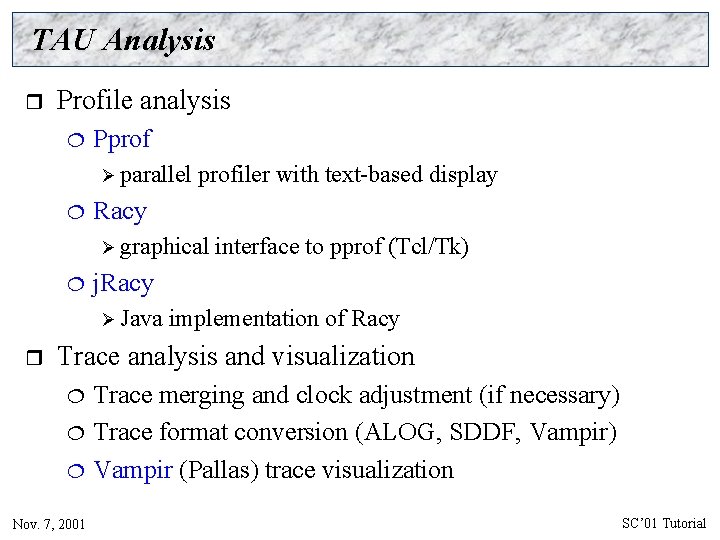
TAU Analysis r Profile analysis ¦ Pprof Ø parallel ¦ profiler with text-based display Racy Ø graphical ¦ j. Racy Ø Java r interface to pprof (Tcl/Tk) implementation of Racy Trace analysis and visualization ¦ ¦ ¦ Nov. 7, 2001 Trace merging and clock adjustment (if necessary) Trace format conversion (ALOG, SDDF, Vampir) Vampir (Pallas) trace visualization SC’ 01 Tutorial
![Pprof Command pprof cbmtei r s n num f file l nodes c Pprof Command pprof [-c|-b|-m|-t|-e|-i] [-r] [-s] [-n num] [-f file] [-l] [nodes] ¦ -c](https://slidetodoc.com/presentation_image_h2/7b3fede430b53be2e233c4eac35c1d90/image-14.jpg)
Pprof Command pprof [-c|-b|-m|-t|-e|-i] [-r] [-s] [-n num] [-f file] [-l] [nodes] ¦ -c Sort according to number of calls ¦ -b Sort according to number of subroutines called ¦ -m Sort according to msecs (exclusive time total) ¦ -t Sort according to total msecs (inclusive time total) ¦ -e Sort according to exclusive time per call ¦ -i Sort according to inclusive time per call ¦ -v Sort according to standard deviation (exclusive usec) ¦ -r Reverse sorting order ¦ -s Print only summary profile information ¦ -n num. Print only first number of functions ¦ -f file Specify full path and filename without node ids ¦ -l nodes List all functions and exit (prints only info SC’ 01 Tutorial Nov. 7, 2001 about all r

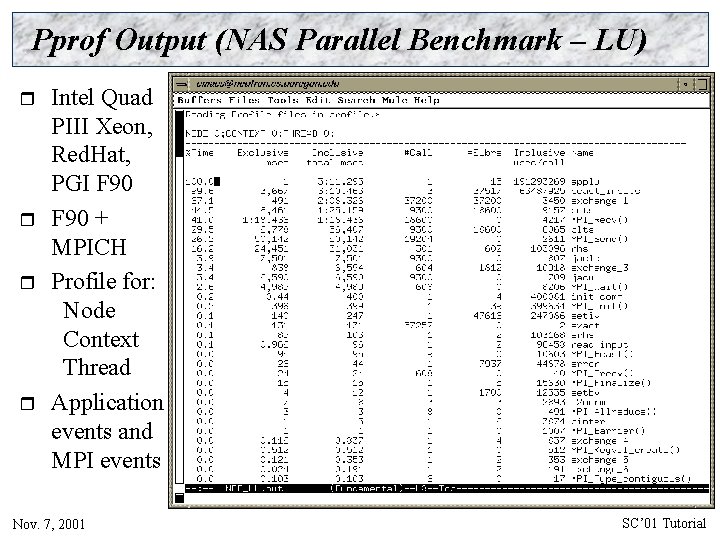
Pprof Output (NAS Parallel Benchmark – LU) r r Intel Quad PIII Xeon, Red. Hat, PGI F 90 + MPICH Profile for: Node Context Thread Application events and MPI events Nov. 7, 2001 SC’ 01 Tutorial

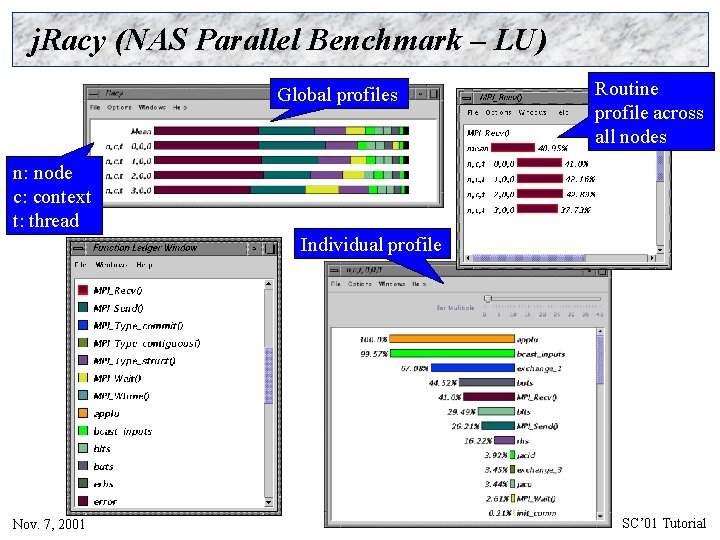
j. Racy (NAS Parallel Benchmark – LU) Global profiles Routine profile across all nodes n: node c: context t: thread Individual profile Nov. 7, 2001 SC’ 01 Tutorial

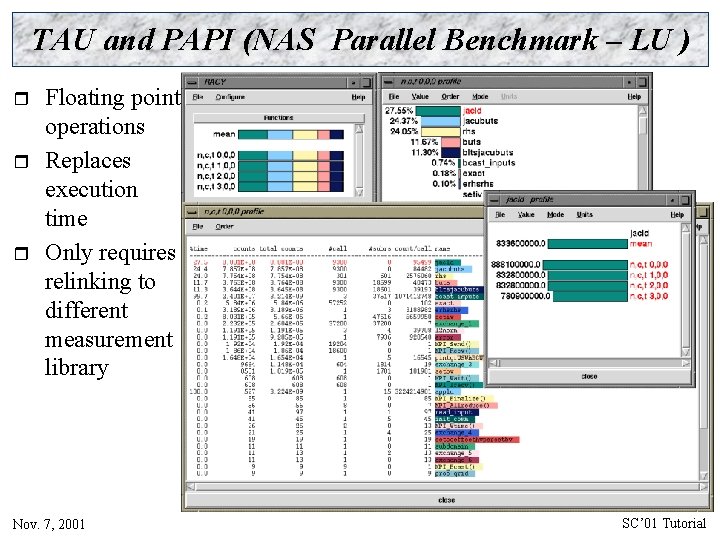
TAU and PAPI (NAS Parallel Benchmark – LU ) r r r Floating point operations Replaces execution time Only requires relinking to different measurement library Nov. 7, 2001 SC’ 01 Tutorial

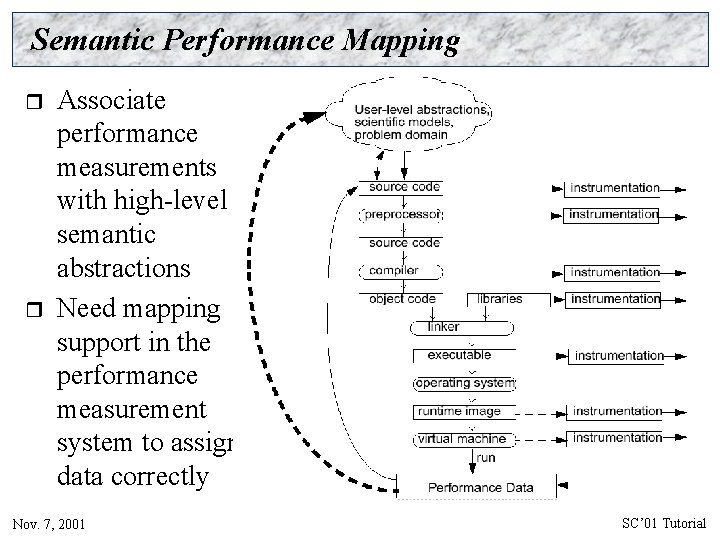
Semantic Performance Mapping r r Associate performance measurements with high-level semantic abstractions Need mapping support in the performance measurement system to assign data correctly Nov. 7, 2001 SC’ 01 Tutorial

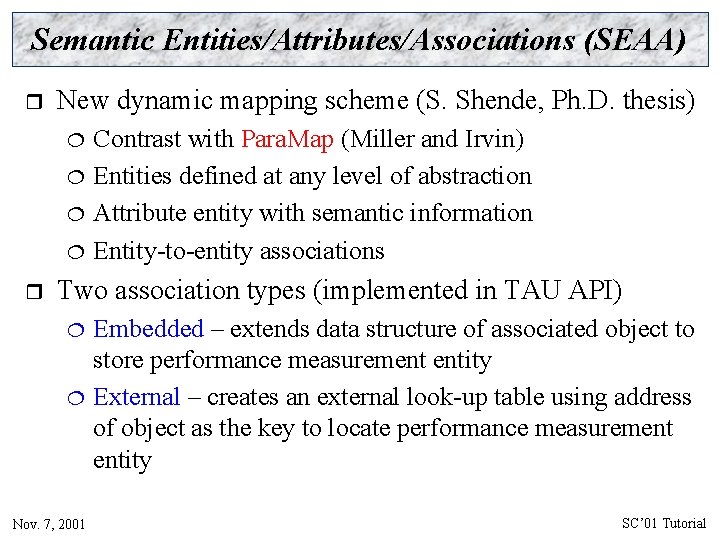
Semantic Entities/Attributes/Associations (SEAA) r New dynamic mapping scheme (S. Shende, Ph. D. thesis) ¦ ¦ r Contrast with Para. Map (Miller and Irvin) Entities defined at any level of abstraction Attribute entity with semantic information Entity-to-entity associations Two association types (implemented in TAU API) ¦ ¦ Nov. 7, 2001 Embedded – extends data structure of associated object to store performance measurement entity External – creates an external look-up table using address of object as the key to locate performance measurement entity SC’ 01 Tutorial

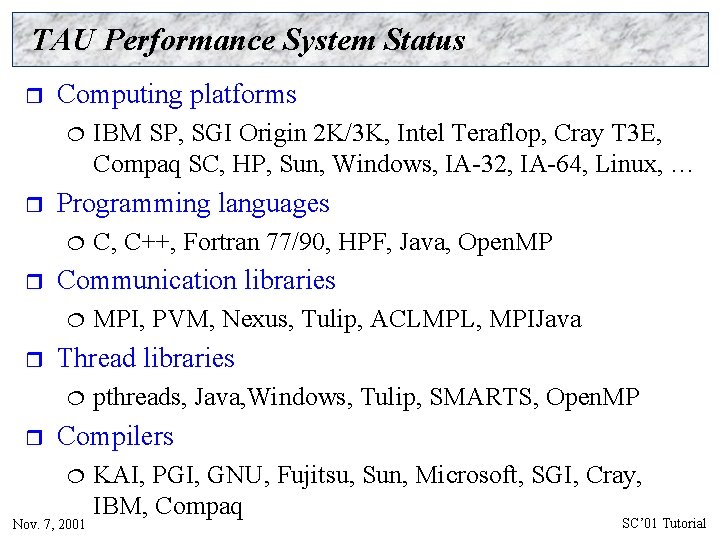
TAU Performance System Status r Computing platforms ¦ r Programming languages ¦ r MPI, PVM, Nexus, Tulip, ACLMPL, MPIJava Thread libraries ¦ r C, C++, Fortran 77/90, HPF, Java, Open. MP Communication libraries ¦ r IBM SP, SGI Origin 2 K/3 K, Intel Teraflop, Cray T 3 E, Compaq SC, HP, Sun, Windows, IA-32, IA-64, Linux, … pthreads, Java, Windows, Tulip, SMARTS, Open. MP Compilers ¦ Nov. 7, 2001 KAI, PGI, GNU, Fujitsu, Sun, Microsoft, SGI, Cray, IBM, Compaq SC’ 01 Tutorial

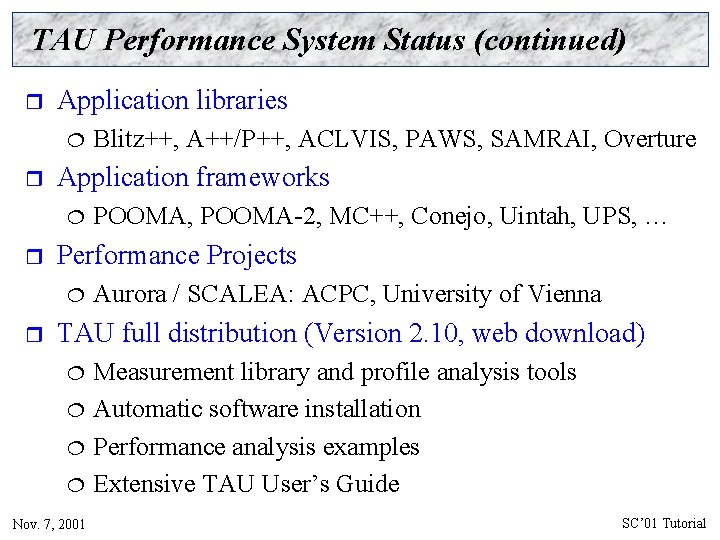
TAU Performance System Status (continued) r Application libraries ¦ r Application frameworks ¦ r POOMA, POOMA-2, MC++, Conejo, Uintah, UPS, … Performance Projects ¦ r Blitz++, A++/P++, ACLVIS, PAWS, SAMRAI, Overture Aurora / SCALEA: ACPC, University of Vienna TAU full distribution (Version 2. 10, web download) ¦ ¦ Nov. 7, 2001 Measurement library and profile analysis tools Automatic software installation Performance analysis examples Extensive TAU User’s Guide SC’ 01 Tutorial

PDT Status r Program Database Toolkit (Version 2. 0, web download) ¦ ¦ ¦ r EDG C++ front end (Version 2. 45. 2) Mutek Fortran 90 front end (Version 2. 4. 1) C++ and Fortran 90 IL Analyzer DUCTAPE library Standard C++ system header files (KCC Version 4. 0 f) PDT-constructed tools ¦ Automatic TAU performance instrumentation Ø C, ¦ Nov. 7, 2001 C++, Fortran 77, and Fortran 90 Program analysis support for SILOON and CHASM SC’ 01 Tutorial

Usage Scenarios r r Message passing computation Multi-threaded computation ¦ ¦ r Mixed-mode parallel computation ¦ ¦ r Integrate messaging events with multi-threading events Open. MP + MPI, Java + MPI, … Object-oriented programming and C++ ¦ ¦ r (Abstract) thread-based performance measurement Multi-threaded parallel execution and asynchronous RTS Performance measurement of template-derived code Object-based performance analysis Hierarchical parallel software frameworks ¦ Nov. 7, 2001 Multi-level software framework and work scheduling SC’ 01 Tutorial

Evolution of the TAU Performance System r r TAU’s existing strength lies in its robust support for performance instrumentation and measurement TAU will evolve to support new performance capabilities ¦ ¦ ¦ ¦ r Online performance data access via application-level API Whole-system, integrative performance monitoring Dynamic performance measurement control Generalize performance mapping Runtime performance analysis and visualization Performance experimentation environment and database Cross-experiment performance analysis Three-year DOE MICS research and development grant Nov. 7, 2001 SC’ 01 Tutorial