Student Performance in the Health Sciences a UKZN





- Slides: 30
Student Performance in the Health Sciences: a UKZN perspective Susan B Higgins-Opitz 1, Mark Tufts 1, Indirani Naidoo 2 and Sabiha Essack 3 1 Discipline of Physiology, School of Medical Sciences, Faculty of Health Sciences, 2 Division of Management Information and 3 Faculty of Health Sciences, University of Kwa. Zulu-Natal
Introduction Ø Challenges facing South African Universities to match the increased access of students from previously disadvantaged backgrounds with increased success (Pandor, 2008) Ø Need for number of holistic and innovative post- admission strategies, inluding curriculum interventions, academic and psycho-social student support Ø At UKZN, Faculty of Health Sciences offers a number of professional programmes, from audiology, sports science, to physiotherapy and pharmacy etc
Physiology § An integral part of all FHS programmes § Difficult for students to grasp § Development of student-focused support programmes & appointment of ADP officers § Still remains one of the disciplines with an anecdotal track record of having lower pass rates than other modules in the same FHS programme
Aim of Study To assess FHS student performance in physiology as compared with their performance in professionspecific modules and any associated contributory factors
Method • Ethical approval was sought (FECHSCH 007/10) FECHSCH 007/10 • Overall pass rates and average, maximum, and minimum marks were obtained for the period 2004 – 2010 for all qualifications • Data were further stratified – Matriculation/National Senior Certificate achievement (proxy for Mainstream/Alternative access) – Language (Advantaged/Previously disadvantaged) Essack et al (2009) South African Journal of Higher Education 23 (2): 275 -292
Physiology Modules • The physiology modules, HPHS 111 & 112 and HPHS 111 & 112 HPHS 211 & 222, are taken by FHS students HPHS 211 & 222 enrolled for multiple qualifications • Student performance data in physiology was thus – First separated in terms of their degree course First – Then compared with their performance in their Then other modules for which they were registered for at the time • Best illustrated by following tables
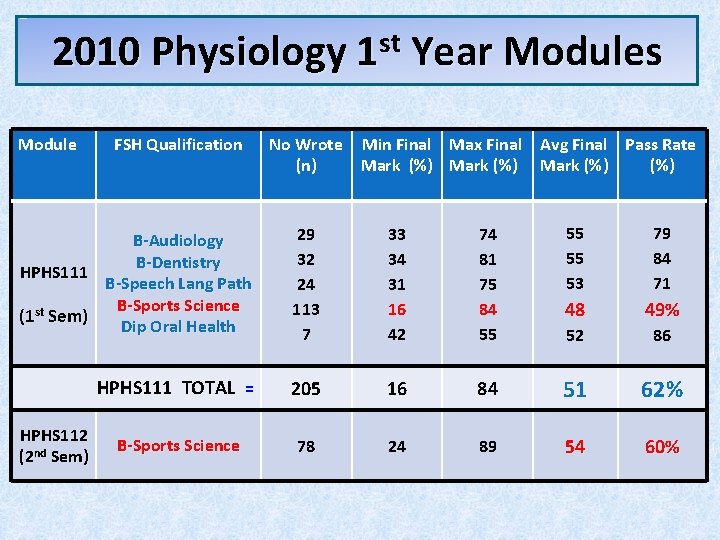
2010 Physiology 1 st Year Modules Module FSH Qualification No Wrote Min Final Max Final Avg Final Pass Rate (n) Mark (%) 55 55 53 79 84 71 48 49% 52 86 84 51 62% 89 54 60% B-Audiology B-Dentistry HPHS 111 B-Speech Lang Path B-Sports Science (1 st Sem) Dip Oral Health 29 32 24 113 7 33 34 31 16 42 74 81 75 84 55 HPHS 111 TOTAL = 205 16 78 24 HPHS 112 (2 nd Sem) B-Sports Science
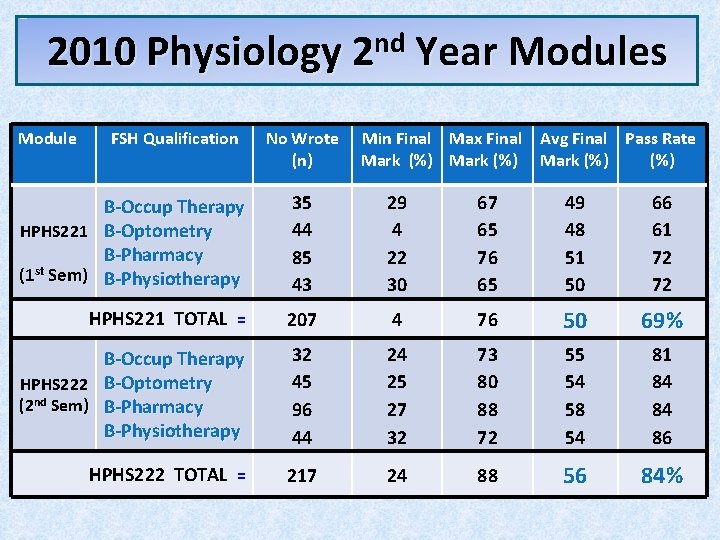
2010 Physiology 2 nd Year Modules Module FSH Qualification No Wrote Min Final Max Final Avg Final Pass Rate (n) Mark (%) B-Occup Therapy HPHS 221 B-Optometry B-Pharmacy st (1 Sem) B-Physiotherapy 35 44 85 43 29 4 22 30 67 65 76 65 49 48 51 50 66 61 72 72 HPHS 221 TOTAL = 207 4 76 50 69% B-Occup Therapy HPHS 222 B-Optometry (2 nd Sem) B-Pharmacy B-Physiotherapy 32 45 96 44 24 25 27 32 73 80 88 72 55 54 58 54 81 84 84 86 HPHS 222 TOTAL = 217 24 88 56 84%
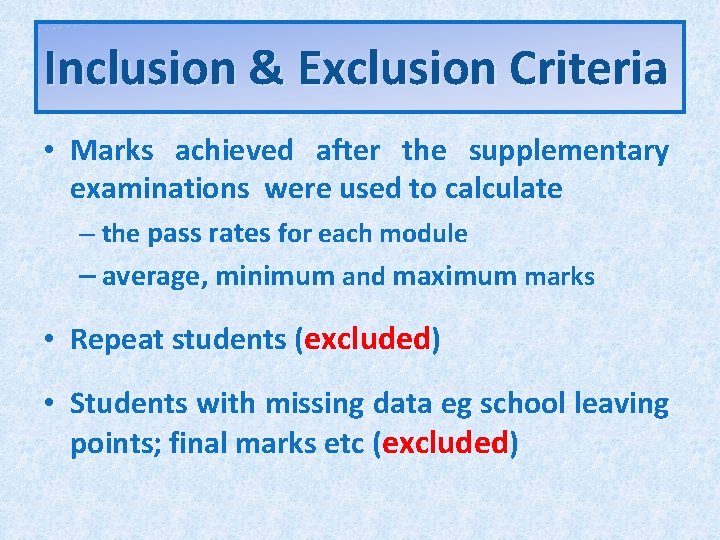
Inclusion & Exclusion Criteria • Marks achieved after the supplementary examinations were used to calculate examinations – the pass rates for each module – average, minimum and maximum marks • Repeat students (excluded) • Students with missing data eg school leaving points; final marks etc (excluded)
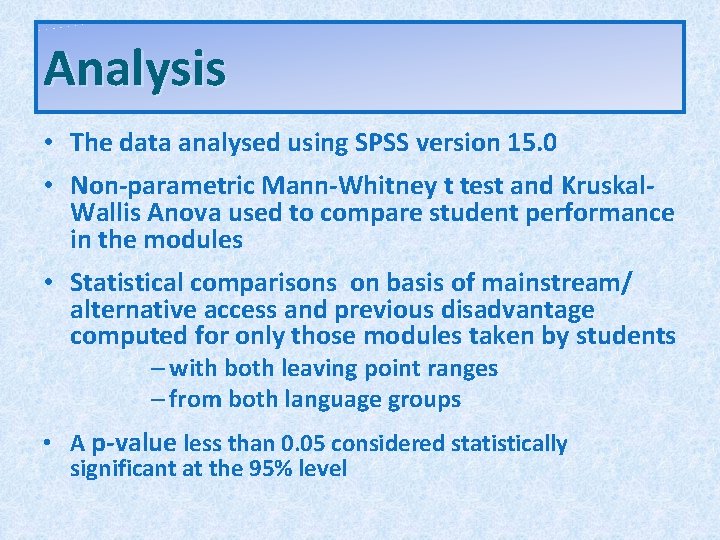
Analysis • The data analysed using SPSS version 15. 0 • Non-parametric Mann-Whitney t test and Kruskal. Wallis Anova used to compare student performance in the modules • Statistical comparisons on basis of mainstream/ alternative access and previous disadvantage alternative access computed for only those modules taken by students – with both leaving point ranges both – from both language groups both • A p-value less than 0. 05 considered statistically significant at the 95% level
Results • For the purposes of this presentation, only the performance of those 1 st and 2 nd year FHS students will be reported on, namely Ømodules taken in the 1 st semester Øover years 2008, 2009 and 2010 2008, 2009 Øin terms of pass rates and average marks pass rates • Results of the statistical analyses (pass rates and final marks) are summarized in the following tables
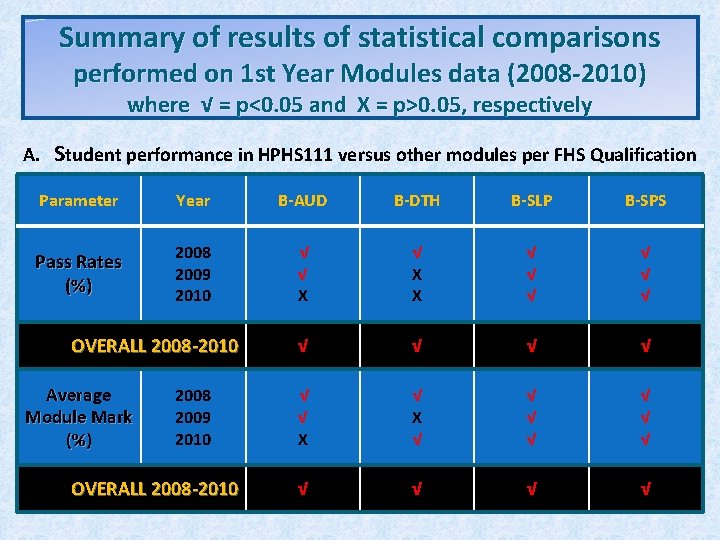
Summary of results of statistical comparisons performed on 1 st Year Modules data (2008 -2010) where √ = p<0. 05 and X = p>0. 05, respectively A. Student performance in HPHS 111 versus other modules per FHS Qualification Parameter Year B-AUD B-DTH B-SLP B-SPS Pass Rates (%) 2008 2009 2010 √ √ X X √ √ √ √ √ X √ √ √ √ √ √ OVERALL 2008 -2010 Average Module Mark (%) 2008 2009 2010 OVERALL 2008 -2010
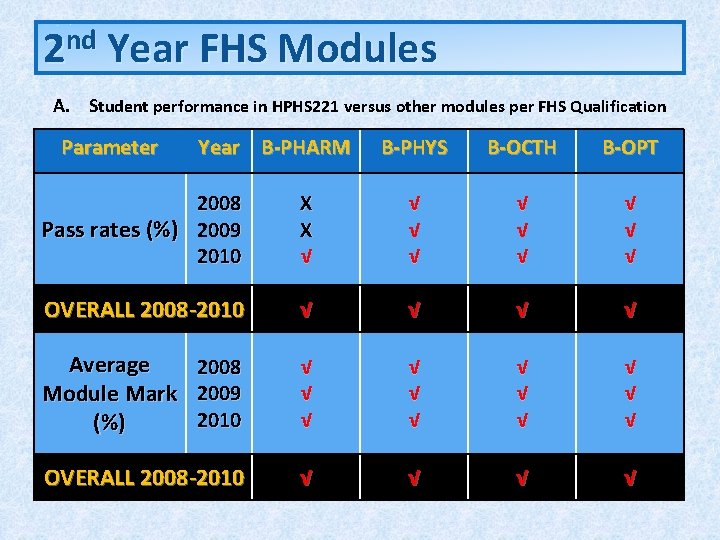
2 nd Year FHS Modules A. Student performance in HPHS 221 versus other modules per FHS Qualification Parameter Year B-PHARM B-PHYS B-OCTH B-OPT 2008 Pass rates (%) 2009 2010 X X √ √ √ √ √ OVERALL 2008 -2010 √ √ Average 2008 Module Mark 2009 2010 (%) √ √ √ OVERALL 2008 -2010 √ √
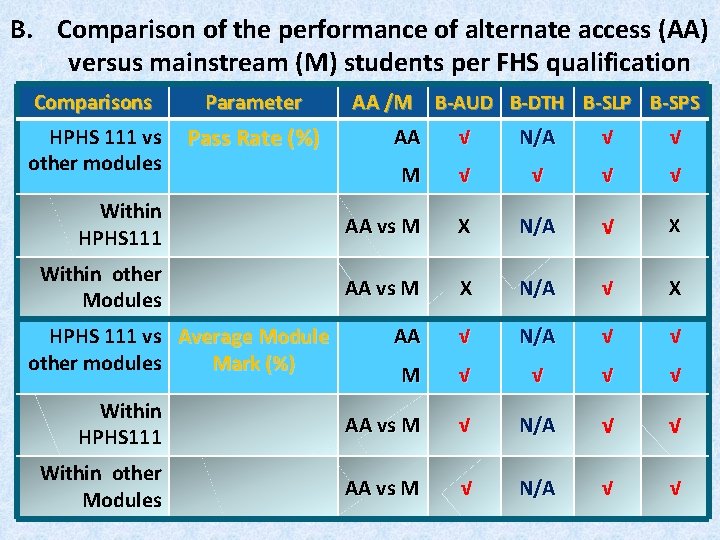
B. Comparison of the performance of alternate access (AA) versus mainstream (M) students per FHS qualification Comparisons Parameter HPHS 111 vs Pass Rate (%) other modules AA /M B-AUD B-DTH B-SLP B-SPS AA √ N/A √ √ M √ √ √ Within HPHS 111 AA vs M X N/A √ X Within other Modules AA vs M X N/A √ X AA √ N/A √ √ M √ √ √ Within HPHS 111 AA vs M √ N/A √ √ Within other Modules AA vs M √ N/A √ √ HPHS 111 vs Average Module other modules Mark (%)
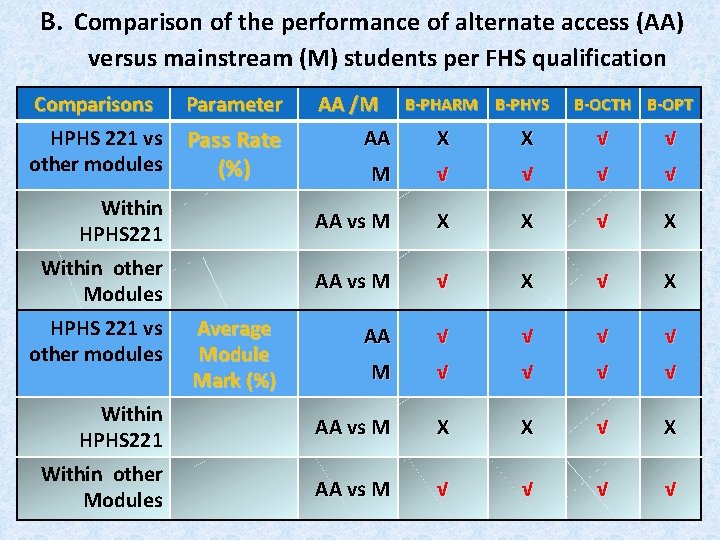
B. Comparison of the performance of alternate access (AA) versus mainstream (M) students per FHS qualification Comparisons Parameter HPHS 221 vs Pass Rate other modules (%) AA /M B-PHARM B-PHYS AA X X B-OCTH B-OPT √ √ M √ √ Within HPHS 221 AA vs M X X √ X Within other Modules AA vs M √ X AA √ √ M √ √ Within HPHS 221 AA vs M X X √ X Within other Modules AA vs M √ √ HPHS 221 vs other modules Average Module Mark (%)
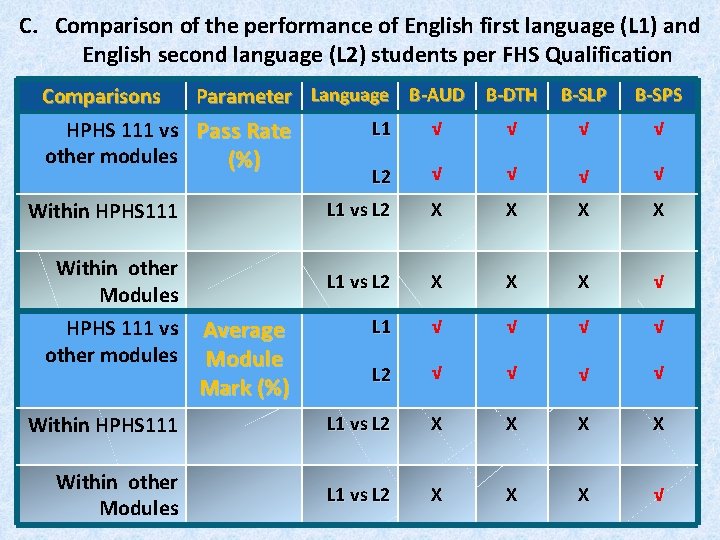
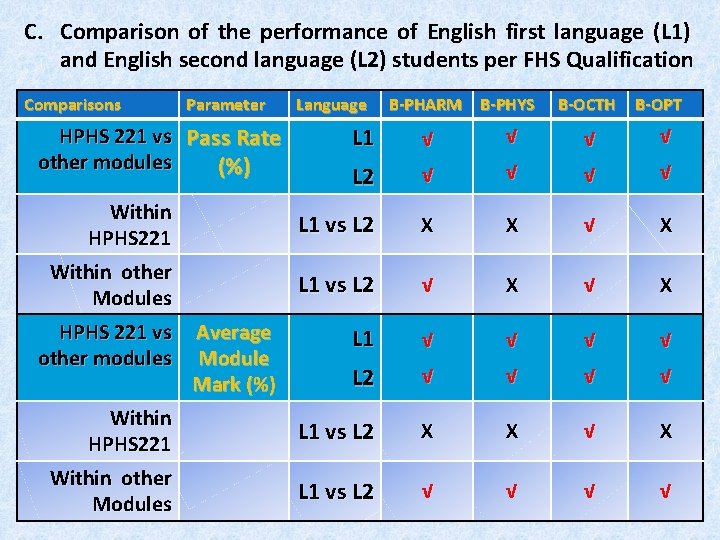
C. Comparison of the performance of English first language (L 1) and English second language (L 2) students per FHS Qualification Comparisons Parameter Language B-AUD B-DTH B-SLP L 1 √ √ √ HPHS 111 vs Pass Rate other modules (%) B-SPS √ L 2 √ √ Within HPHS 111 L 1 vs L 2 X X Within other Modules L 1 vs L 2 X X X √ L 1 √ √ √ √ L 2 √ √ Within HPHS 111 L 1 vs L 2 X X Within other Modules L 1 vs L 2 X X X √ HPHS 111 vs Average other modules Module Mark (%)
C. Comparison of the performance of English first language (L 1) and English second language (L 2) students per FHS Qualification Comparisons Parameter HPHS 221 vs Pass Rate other modules (%) Within HPHS 221 Within other Modules HPHS 221 vs Average other modules Module Mark (%) Within HPHS 221 Within other Modules Language B-PHARM B-PHYS B-OCTH B-OPT L 1 √ √ L 2 √ √ L 1 vs L 2 X X √ X L 1 vs L 2 √ X L 1 √ √ L 2 √ √ L 1 vs L 2 X X √ X L 1 vs L 2 √ √
The key findings of the study, illustrated using figures, are as follows:
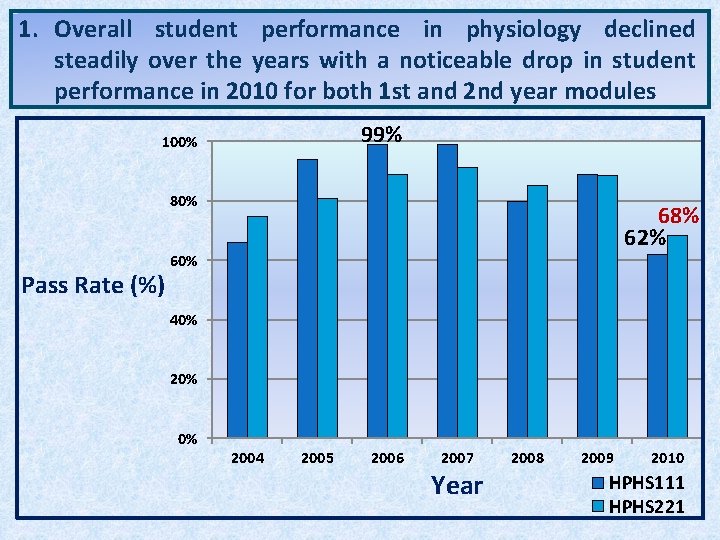
1. Overall student performance in physiology declined steadily over the years with a noticeable drop in student performance in 2010 for both 1 st and 2 nd year modules 99% 100% 80% Pass Rate (%) 68% 62% 60% 40% 20% 0% 2004 2005 2006 2007 Year 2008 2009 2010 HPHS 111 HPHS 221
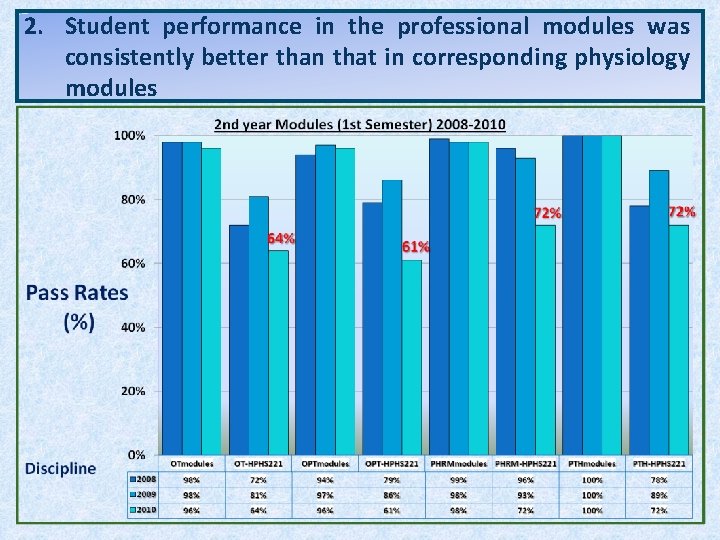
2. Student performance in the professional modules was consistently better than that in corresponding physiology modules
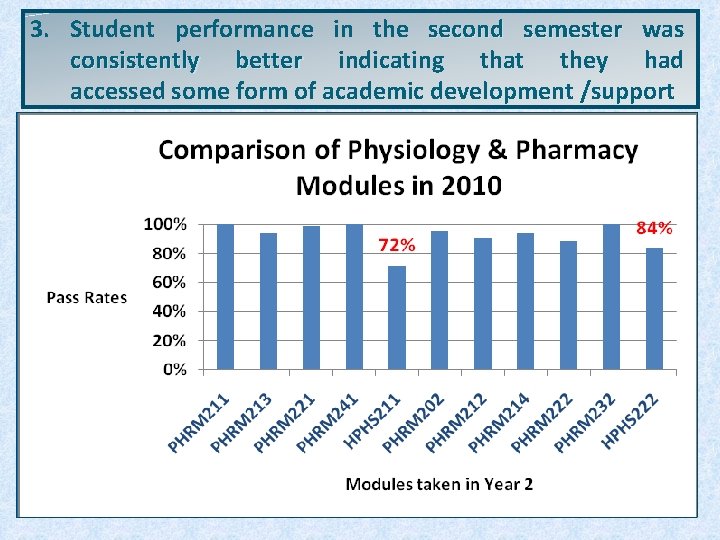
3. Student performance in the second semester was consistently better indicating that they had accessed some form of academic development /support
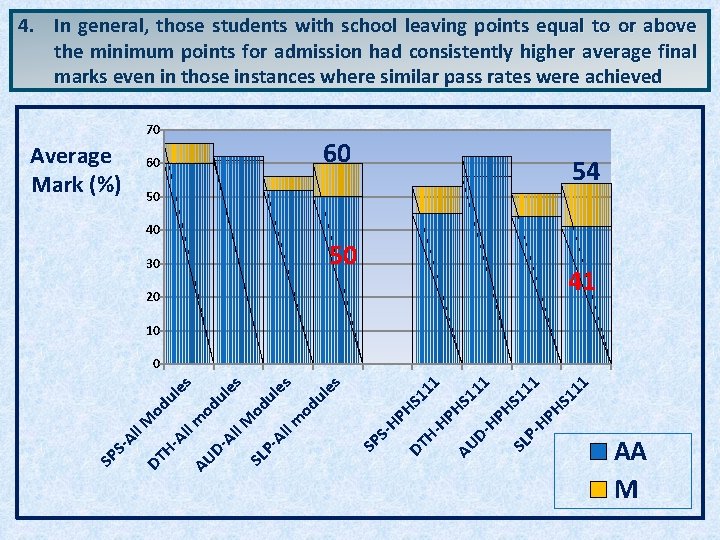
4. In general, those students with school leaving points equal to or above the minimum points for admission had consistently higher average final marks even in those instances where similar pass rates were achieved marks 70 Average Mark (%) 60 60 54 50 40 30 50 41 20 10 11 HP 11 SL P- HS HS 1 1 1 HP DAU H- HP HS 11 11 S 1 HP H SSP DT SP S- Al l M DT od Hul Al es l m AU od Dul Al l M es od SL Pul Al es l m od ul es 0 AA M
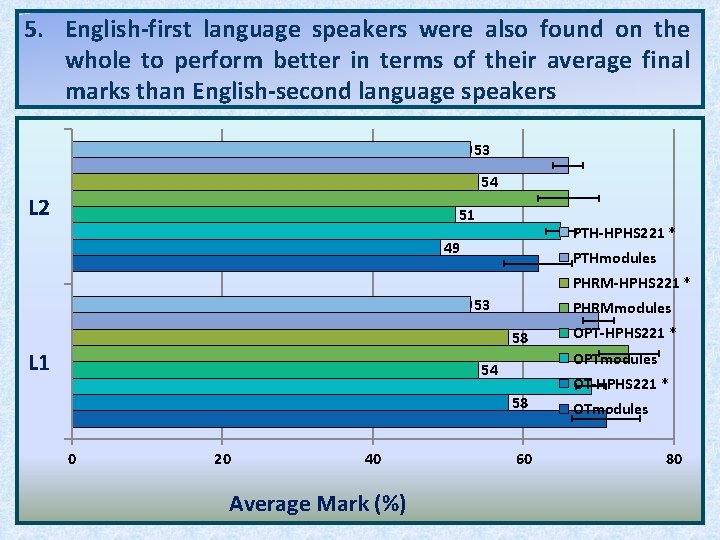
5. English-first language speakers were also found on the whole to perform better in terms of their average final marks than English-second language speakers 53 54 L 2 51 PTH-HPHS 221 * 49 PTHmodules PHRM-HPHS 221 * 53 PHRMmodules 58 L 1 OPTmodules 54 58 0 20 40 Average Mark (%) OPT-HPHS 221 * 60 OT-HPHS 221 * OTmodules 80
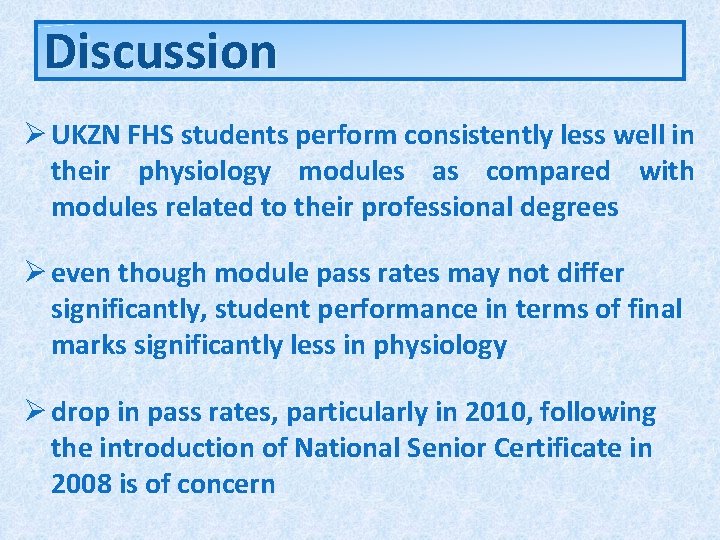
Discussion Ø UKZN FHS students perform consistently less well in consistently their physiology modules as compared with modules related to their professional degrees Ø even though module pass rates may not differ significantly, student performance in terms of final marks significantly less in physiology marks Ø drop in pass rates, particularly in 2010, following the introduction of National Senior Certificate in introduction 2008 is of concern
Implications Ø Findings have particular bearing in terms of content, pedagogy, assessment, and the student support currently in operation Ø In SA growing enrolment of students from marginalized groups with diverse ethnic, social and educational backgrounds Ø inadequate secondary school preparation and thus encounter several and diverse learning barriers (Morrison et al. , 2006; Botha et al. , 2005)
Ø Given the increasing diversity within the FHS, there is a need to ensure the use of appropriate teaching, learning & assessment methodologies (Koch et al. , 2001; Venter et al. , 2001) Ø positive impact of one or more components of the student counseling services (Morrison et al. , 2006) √ on retention rates, student learning and achievement of academic targets √ on students in stressful situations √ on students at risk of drop-out √ on positive personal outcomes, eg improvement of self-esteem, anxiety, motivation
Further Research Embarked on two further studies on üthe early detection of first year students struggling academically with physiology (i. e. before their first formative assessment) üthe impact of a computer-based practical delivery on student performance and learning in their physiology module
Acknowledgement The authors are grateful to the UKZN Teaching & Learning Office for financial support
References 1. Pandor, N. 2008. Education: Minister’s Budget Speech. Cape Town (http: //www. pmg. org. za/briefing/20080515 -education-ministers-budget-speech. Accessed 23 May 2008) 2. Essack, S. Y. , Barnes, G. , Jackson, L. , Majozi, Mc. Inerney, P. , Mtshali, Naidoo, I. , Oosthuizen, F. , and Suleman, F. 2009. Maximizing Income via the Higher Education Funding Framework in Health Sciences. South African Journal of Higher Education 23 (2): 275 -292. 3. Morrison, J. M. , Brand, H. J. and Cilliers, C. D. 2006. Assessing the impact of student counseling service centers at tertiary education institutions: How should it be approached? South African Journal of Higher Education 20 (5): 655 -678. 4. Botha, H. L. , Brand, H. J. , Cilliers, C. D. , Davidow, A. , de Jager A. C. and Smith, D. 2005. Student counseling and development services in higher education institutions in South African Journal of Higher Education 19 (1): 655 -678. 5. Venter, I. M. , Blignaut, R. J. and Stoltz, D. 2001. Research methodologies explored for a paradigm shift in university teaching. South African Journal of Higher Education 15 (2): 162 -169. 6. Koch, E. , Foxcroft, C. and Watson, A. 2001. A development focus to student access at the University of Port Elizabeth: process and preliminary insights in placement assessments. South African Journal of Higher Education 15 (2): 126 -131.