State District Partnerships Sustaining Implementation Capacity Carolyn Cherry
- Slides: 45
State District Partnerships: Sustaining Implementation Capacity Carolyn Cherry, Minnesota Department of Education Rochelle Cox, Minneapolis Public Schools Caryn Ward, SISEP Center 2019 OSEP LEADERSHIP CONFERENCE 1
State Systemic Improvement Plan— Minnesota’s Approach Examine the various ways in which linked implementation teams, informed by data, evolve and support the capacity of SEA, Regions, Districts and schools to manage implementation and move towards results. 2 2019 OSEP LEADERSHIP CONFERENCE
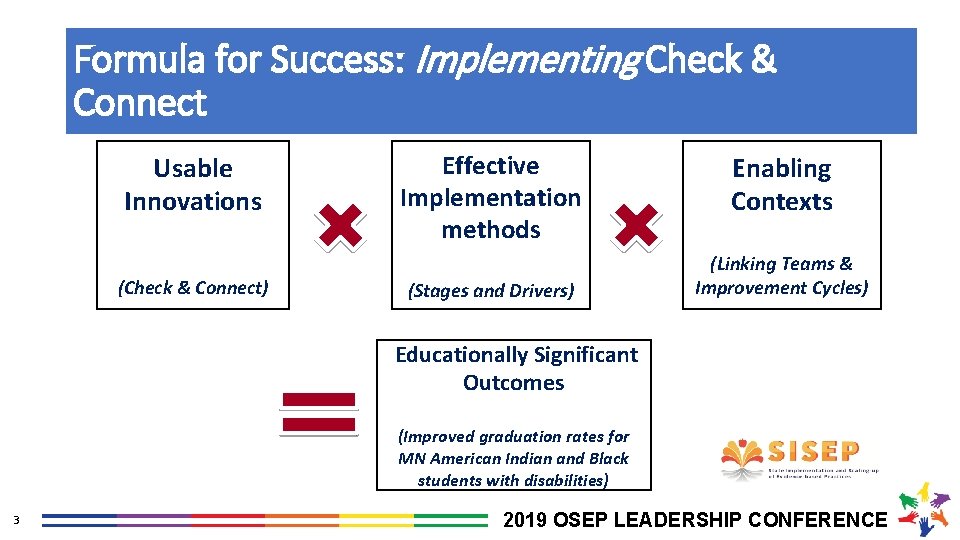
Formula for Success: Implementing Check & Connect Usable Innovations (Check & Connect) Effective Implementation methods (Stages and Drivers) Enabling Contexts (Linking Teams & Improvement Cycles) Educationally Significant Outcomes (Improved graduation rates for MN American Indian and Black students with disabilities) 3 2019 OSEP LEADERSHIP CONFERENCE
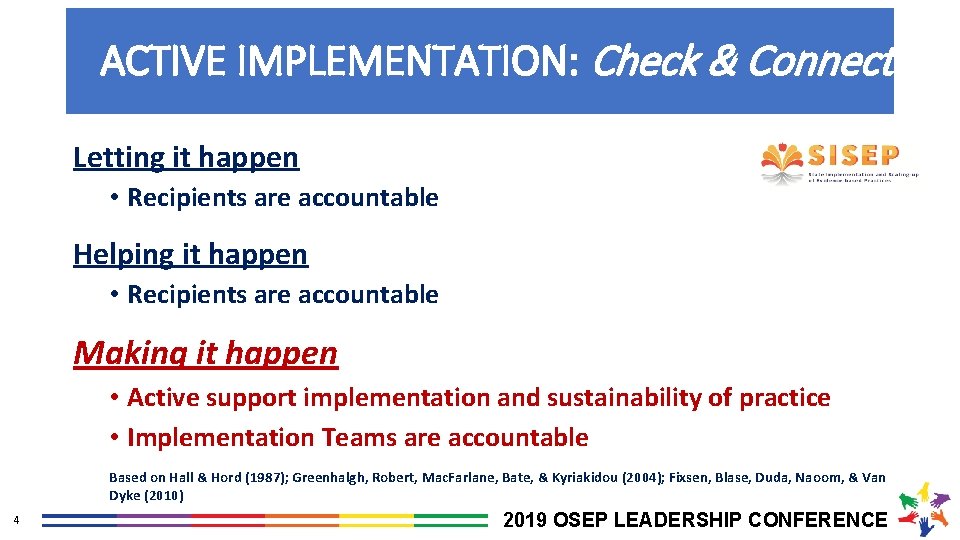
ACTIVE IMPLEMENTATION: Check & Connect Letting it happen • Recipients are accountable Helping it happen • Recipients are accountable Making it happen • Active support implementation and sustainability of practice • Implementation Teams are accountable Based on Hall & Hord (1987); Greenhalgh, Robert, Mac. Farlane, Bate, & Kyriakidou (2004); Fixsen, Blase, Duda, Naoom, & Van Dyke (2010) 4 2019 OSEP LEADERSHIP CONFERENCE
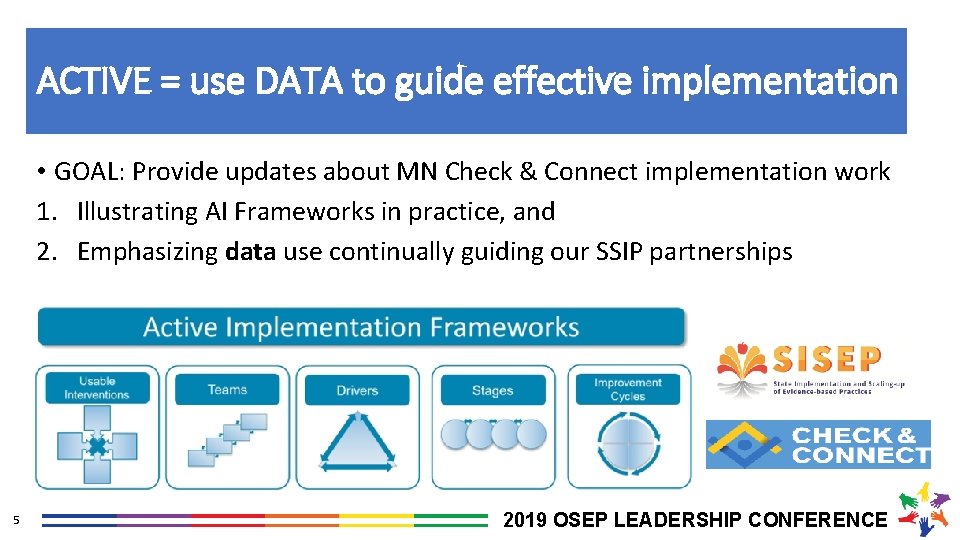
ACTIVE = use DATA to guide effective implementation • GOAL: Provide updates about MN Check & Connect implementation work 1. Illustrating AI Frameworks in practice, and 2. Emphasizing data use continually guiding our SSIP partnerships 5 2019 OSEP LEADERSHIP CONFERENCE
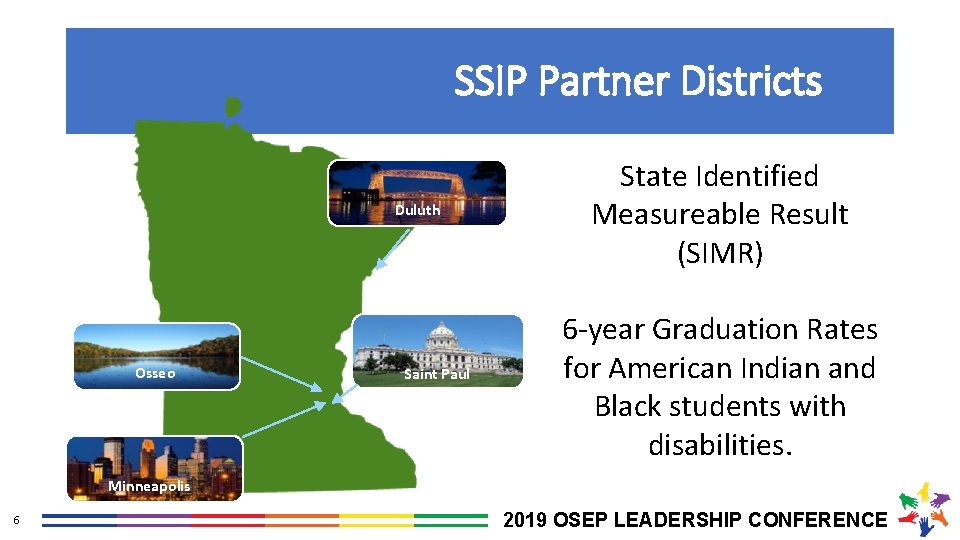
SSIP Partner Districts Duluth Osseo Saint Paul State Identified Measureable Result (SIMR) 6 -year Graduation Rates for American Indian and Black students with disabilities. Minneapolis 6 2019 OSEP LEADERSHIP CONFERENCE
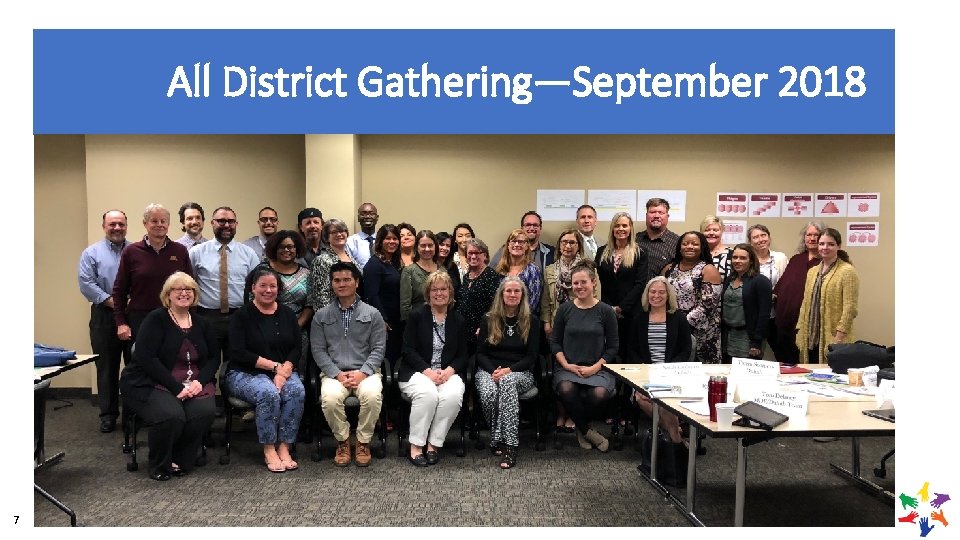
All District Gathering—September 2018 7 2019 OSEP LEADERSHIP CONFERENCE
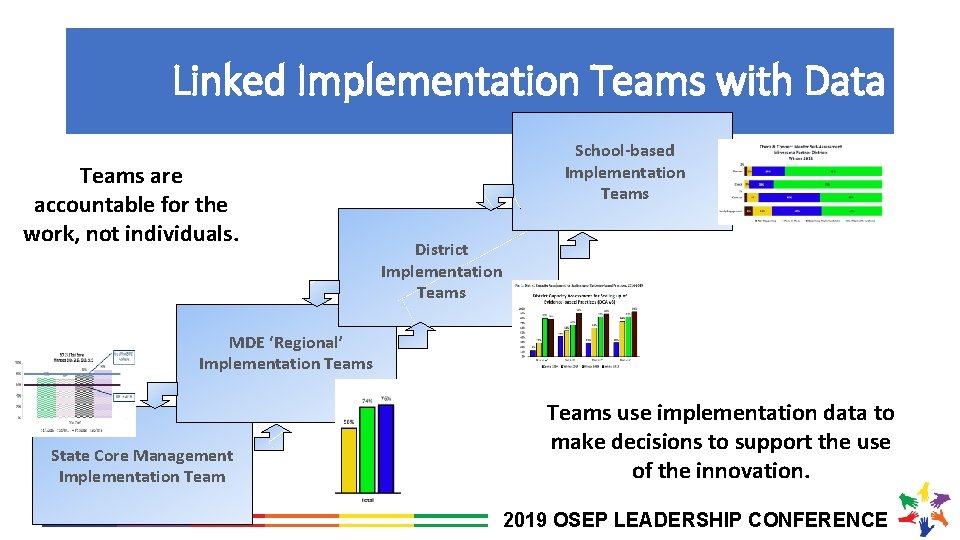
Linked Implementation Teams with Data Teams are accountable for the work, not individuals. School-based Implementation Teams District Implementation Teams MDE ‘Regional’ Implementation Teams State Core Management Implementation Teams use implementation data to make decisions to support the use of the innovation. 2019 OSEP LEADERSHIP CONFERENCE
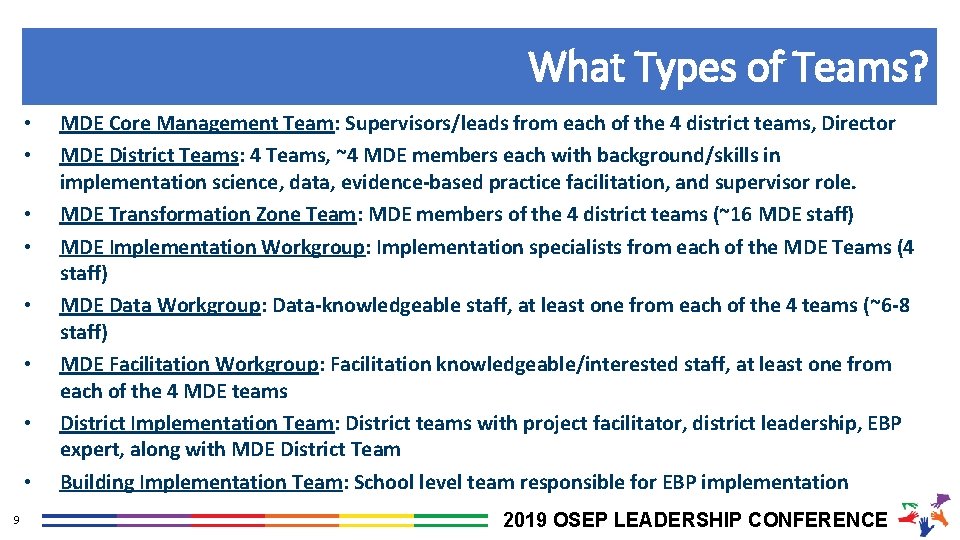
What Types of Teams? • • 9 MDE Core Management Team: Supervisors/leads from each of the 4 district teams, Director MDE District Teams: 4 Teams, ~4 MDE members each with background/skills in implementation science, data, evidence-based practice facilitation, and supervisor role. MDE Transformation Zone Team: MDE members of the 4 district teams (~16 MDE staff) MDE Implementation Workgroup: Implementation specialists from each of the MDE Teams (4 staff) MDE Data Workgroup: Data-knowledgeable staff, at least one from each of the 4 teams (~6 -8 staff) MDE Facilitation Workgroup: Facilitation knowledgeable/interested staff, at least one from each of the 4 MDE teams District Implementation Team: District teams with project facilitator, district leadership, EBP expert, along with MDE District Team Building Implementation Team: School level team responsible for EBP implementation 2019 OSEP LEADERSHIP CONFERENCE
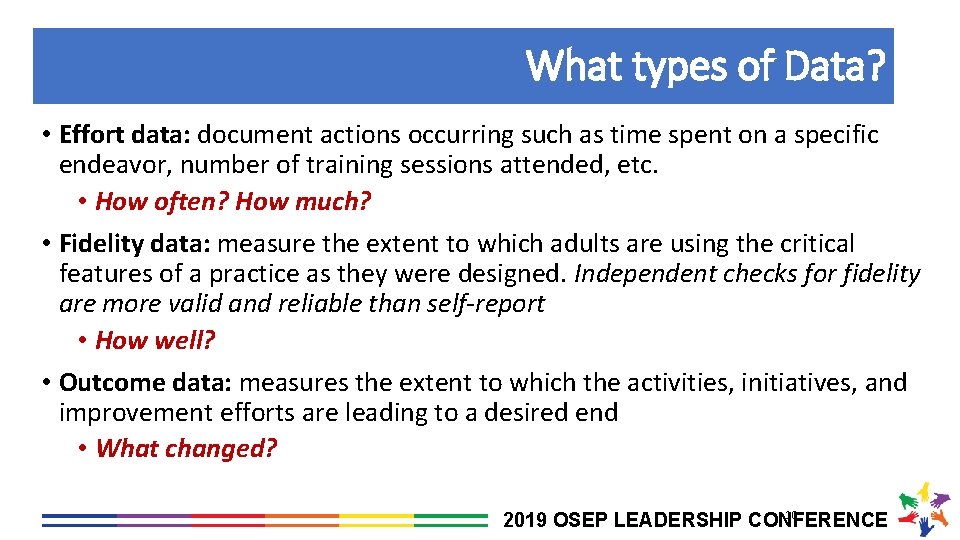
What types of Data? • Effort data: document actions occurring such as time spent on a specific endeavor, number of training sessions attended, etc. • How often? How much? • Fidelity data: measure the extent to which adults are using the critical features of a practice as they were designed. Independent checks for fidelity are more valid and reliable than self-report • How well? • Outcome data: measures the extent to which the activities, initiatives, and improvement efforts are leading to a desired end • What changed? 10 2019 OSEP LEADERSHIP CONFERENCE
Entering into a Partnership with MDE • • Mutual Goal • Sustainability • • 11 Health of the District and Department Alignment with District Priorities School Buy-in 2019 OSEP LEADERSHIP CONFERENCE
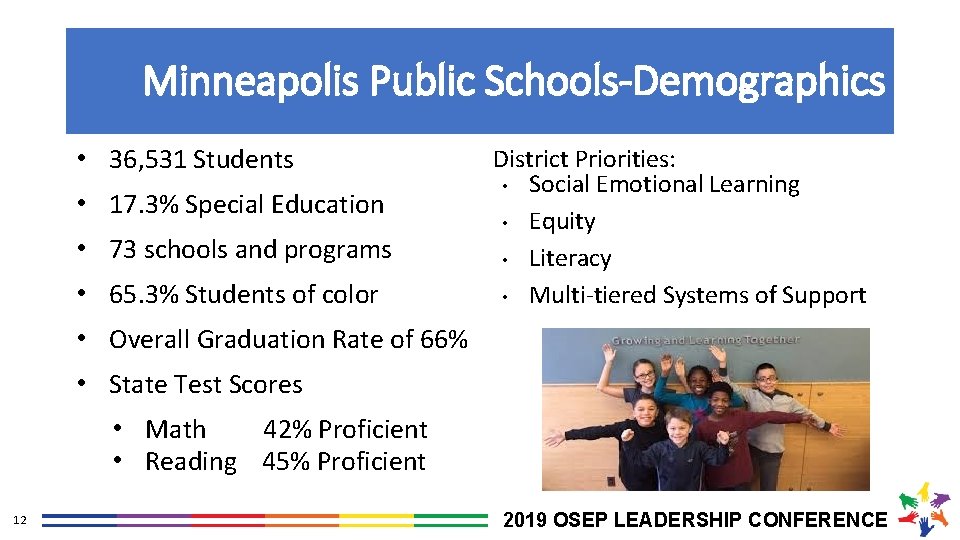
Minneapolis Public Schools-Demographics • • • 36, 531 Students 17. 3% Special Education 73 schools and programs 65. 3% Students of color District Priorities: • Social Emotional Learning • Equity • Literacy • Multi-tiered Systems of Support Overall Graduation Rate of 66% State Test Scores • Math 42% Proficient • Reading 45% Proficient 12 2019 OSEP LEADERSHIP CONFERENCE
Strategy Selection: District Perspective 13 • Check & Connect history in MPS • Understanding the Data • Navigating Relationships • Cross Departmental Work 2019 OSEP LEADERSHIP CONFERENCE
District Comprehensive Assessment Process • Year 1 to Year 3 Experiences • Information Sharing • • 14 Implementation Science in a World of Urgency Fiscal Resource Sharing Improves Cross Departmental Work 2019 OSEP LEADERSHIP CONFERENCE
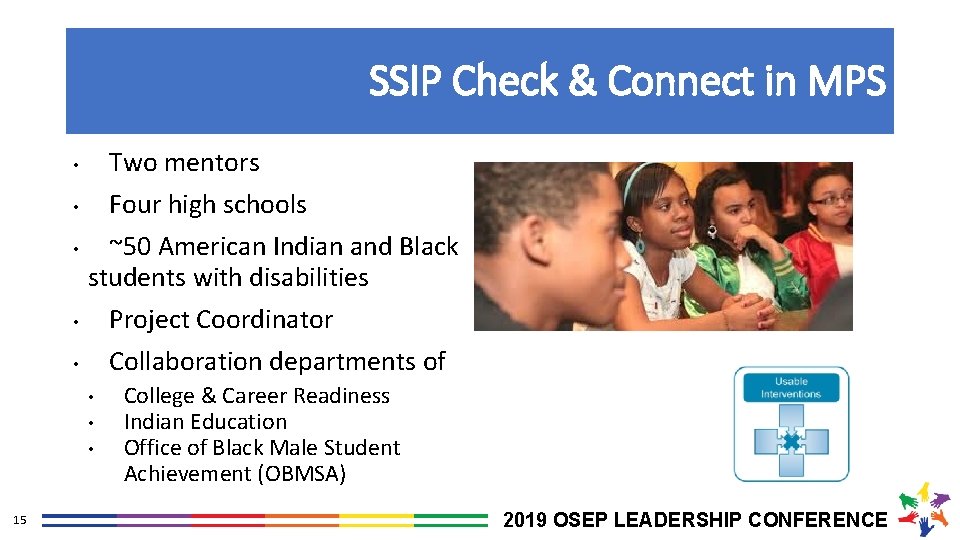
SSIP Check & Connect in MPS • Two mentors • Four high schools • ~50 American Indian and Black students with disabilities • Project Coordinator • Collaboration departments of • • • 15 College & Career Readiness Indian Education Office of Black Male Student Achievement (OBMSA) 2019 OSEP LEADERSHIP CONFERENCE
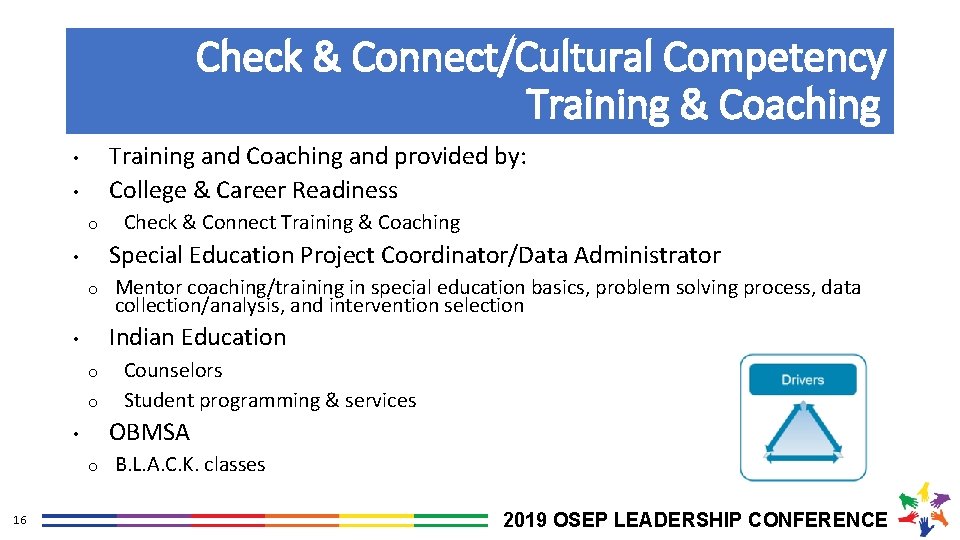
Check & Connect/Cultural Competency Training & Coaching Training and Coaching and provided by: College & Career Readiness • • o Special Education Project Coordinator/Data Administrator • o Mentor coaching/training in special education basics, problem solving process, data collection/analysis, and intervention selection Indian Education • o o Counselors Student programming & services OBMSA • o 16 Check & Connect Training & Coaching B. L. A. C. K. classes 2019 OSEP LEADERSHIP CONFERENCE
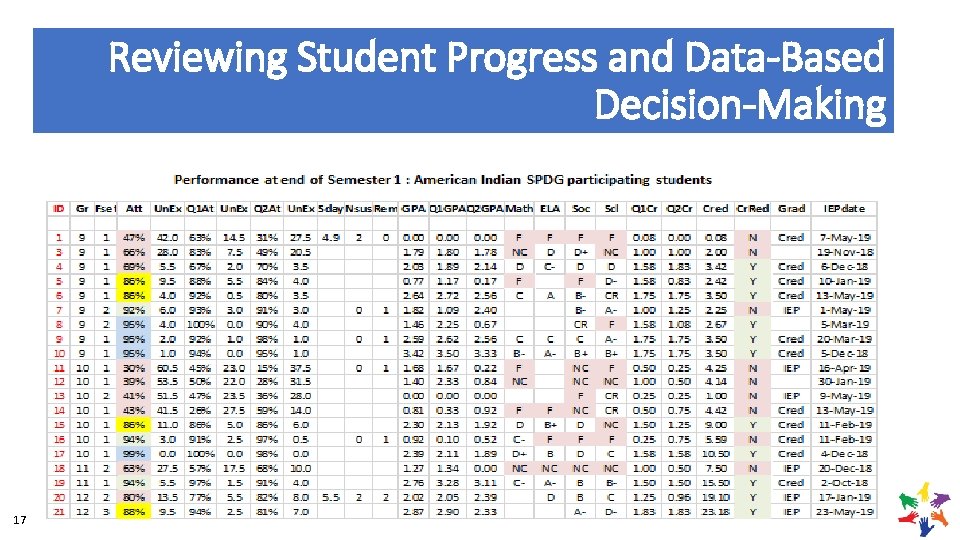
Reviewing Student Progress and Data-Based Decision-Making 17 2019 OSEP LEADERSHIP CONFERENCE
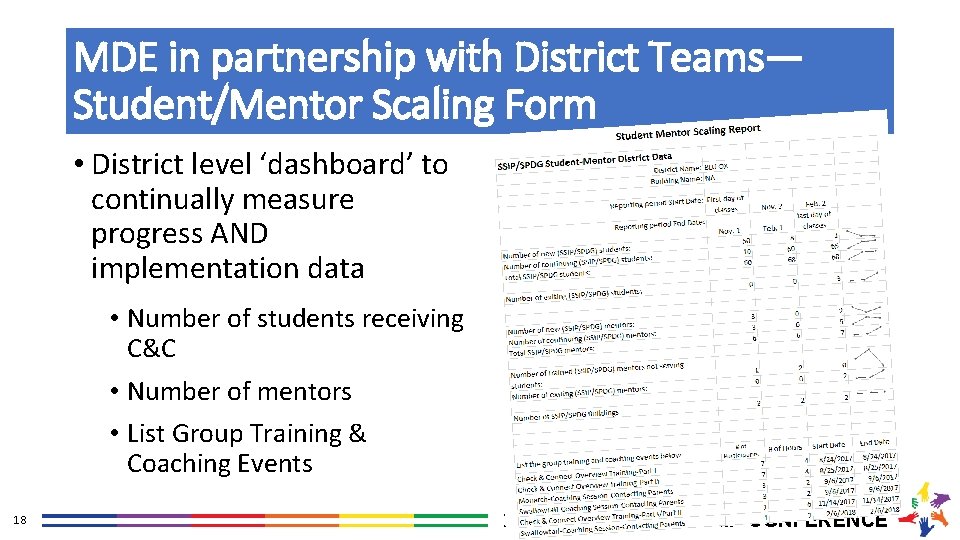
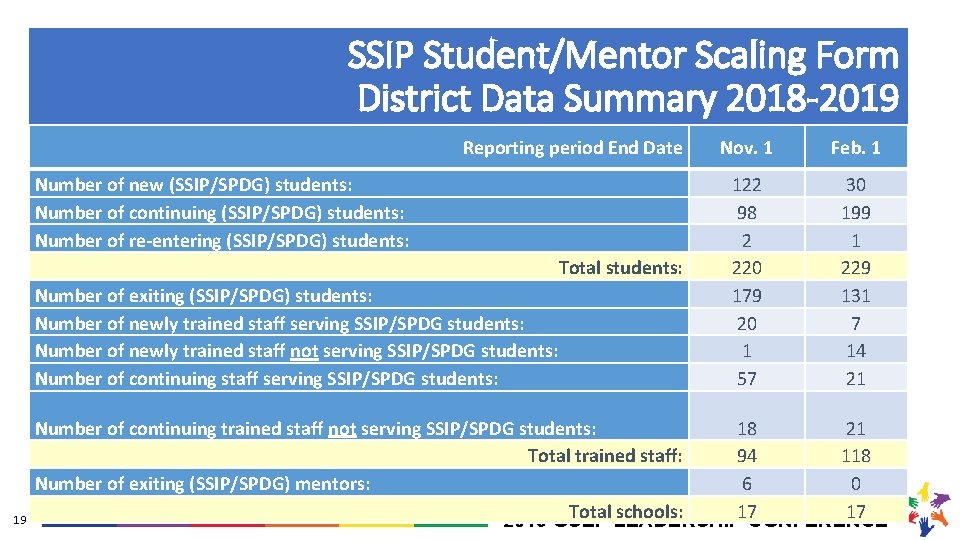
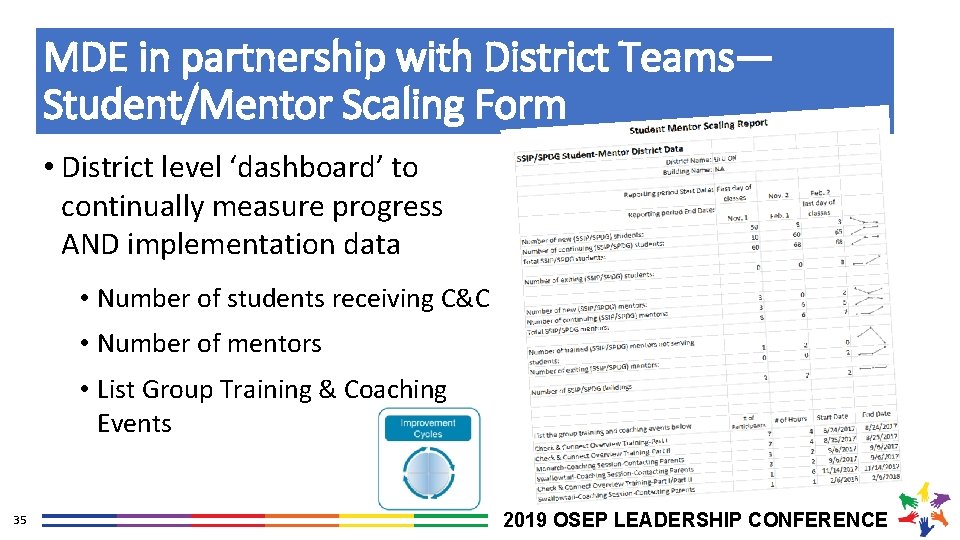
MDE in partnership with District Teams— Student/Mentor Scaling Form • District level ‘dashboard’ to continually measure progress AND implementation data • Number of students receiving C&C • Number of mentors • List Group Training & Coaching Events 18 2019 OSEP LEADERSHIP CONFERENCE
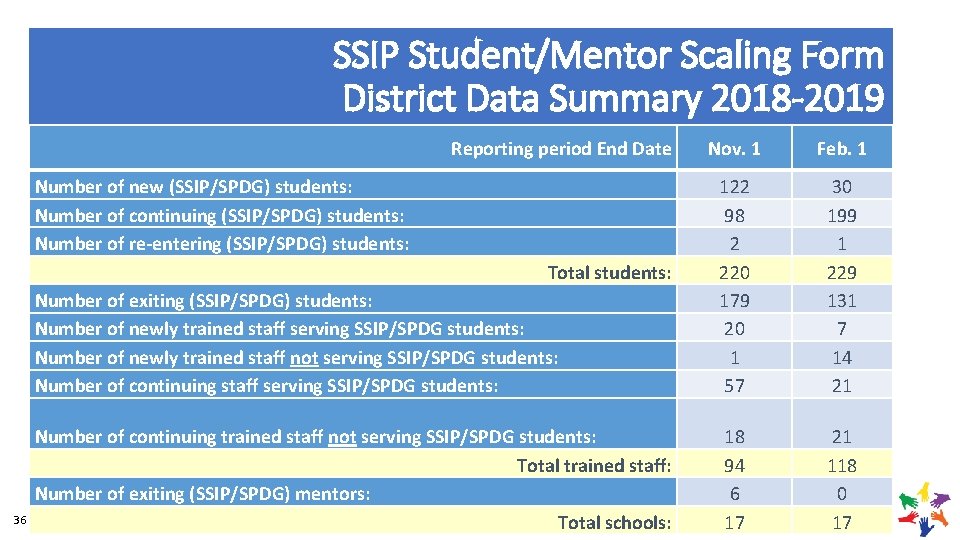
SSIP Student/Mentor Scaling Form District Data Summary 2018 -2019 Reporting period End Date Number of new (SSIP/SPDG) students: Number of continuing (SSIP/SPDG) students: Number of re-entering (SSIP/SPDG) students: Total students: Number of exiting (SSIP/SPDG) students: Number of newly trained staff serving SSIP/SPDG students: Number of newly trained staff not serving SSIP/SPDG students: Number of continuing staff serving SSIP/SPDG students: 19 Nov. 1 Feb. 1 122 98 2 220 179 20 1 57 30 199 1 229 131 7 14 21 Number of continuing trained staff not serving SSIP/SPDG students: 18 21 Total trained staff: 94 118 Number of exiting (SSIP/SPDG) mentors: 6 0 Total LEADERSHIP schools: 17 CONFERENCE 17 2019 OSEP
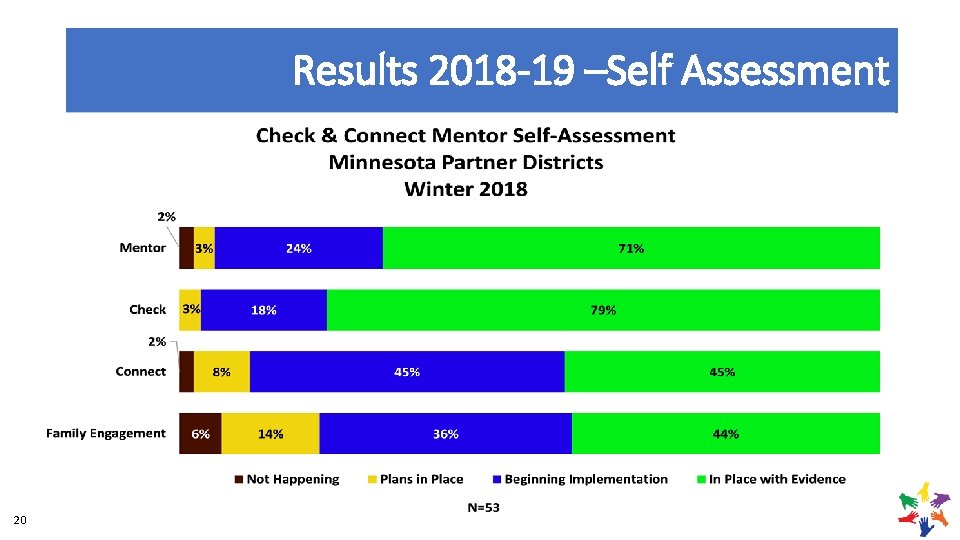
Results 2018 -19 –Self Assessment 20 2019 OSEP LEADERSHIP CONFERENCE
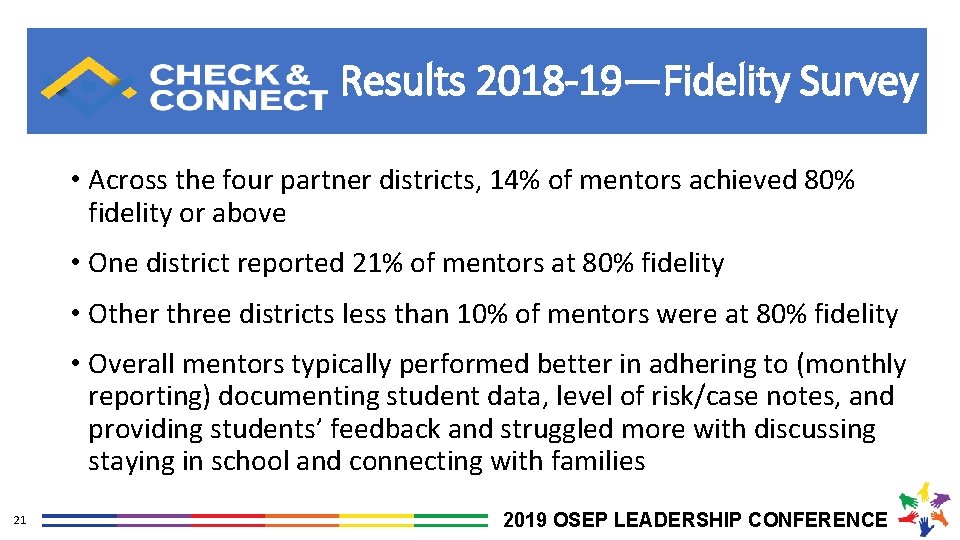
Results 2018 -19—Fidelity Survey • Across the four partner districts, 14% of mentors achieved 80% fidelity or above • One district reported 21% of mentors at 80% fidelity • Other three districts less than 10% of mentors were at 80% fidelity • Overall mentors typically performed better in adhering to (monthly reporting) documenting student data, level of risk/case notes, and providing students’ feedback and struggled more with discussing staying in school and connecting with families 21 2019 OSEP LEADERSHIP CONFERENCE
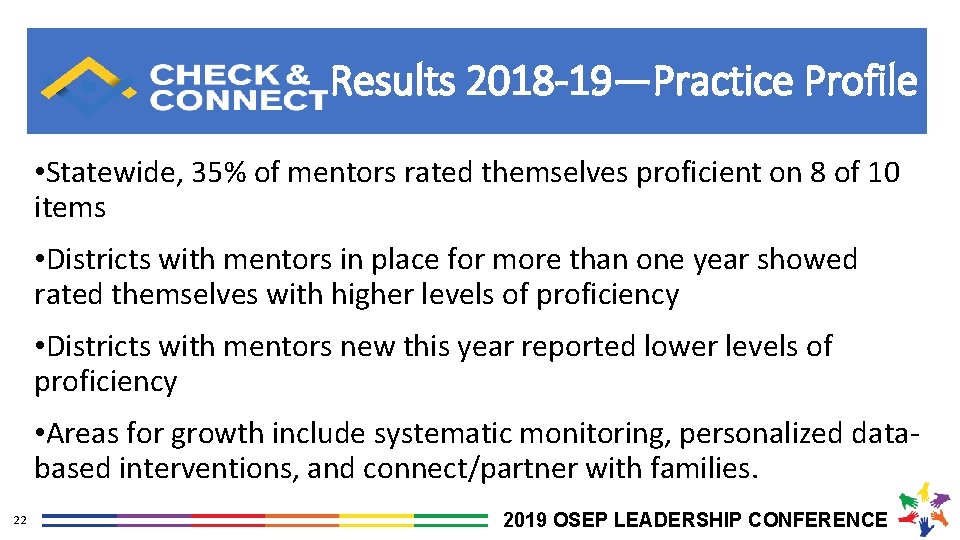
Results 2018 -19—Practice Profile • Statewide, 35% of mentors rated themselves proficient on 8 of 10 items • Districts with mentors in place for more than one year showed rated themselves with higher levels of proficiency • Districts with mentors new this year reported lower levels of proficiency • Areas for growth include systematic monitoring, personalized databased interventions, and connect/partner with families. 22 2019 OSEP LEADERSHIP CONFERENCE
Results 2017 -18—Student Engagement: Affective Domain 23 2019 OSEP LEADERSHIP CONFERENCE
Results 2017 -18—Student Engagement: Cognitive Domain 24 2019 OSEP LEADERSHIP CONFERENCE
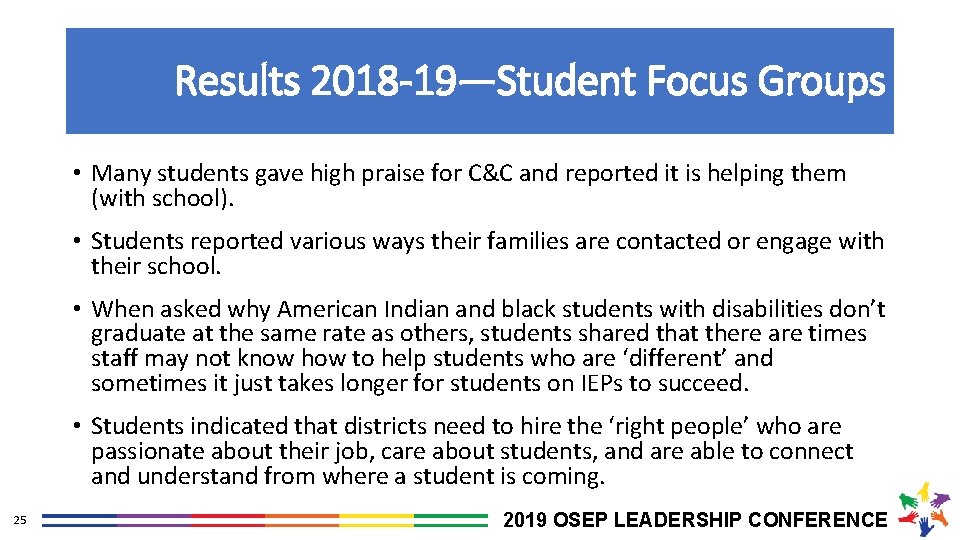
Results 2018 -19—Student Focus Groups • Many students gave high praise for C&C and reported it is helping them (with school). • Students reported various ways their families are contacted or engage with their school. • When asked why American Indian and black students with disabilities don’t graduate at the same rate as others, students shared that there are times staff may not know how to help students who are ‘different’ and sometimes it just takes longer for students on IEPs to succeed. • Students indicated that districts need to hire the ‘right people’ who are passionate about their job, care about students, and are able to connect and understand from where a student is coming. 25 2019 OSEP LEADERSHIP CONFERENCE
MPS Progress on Graduation Rates 26 2019 OSEP LEADERSHIP CONFERENCE
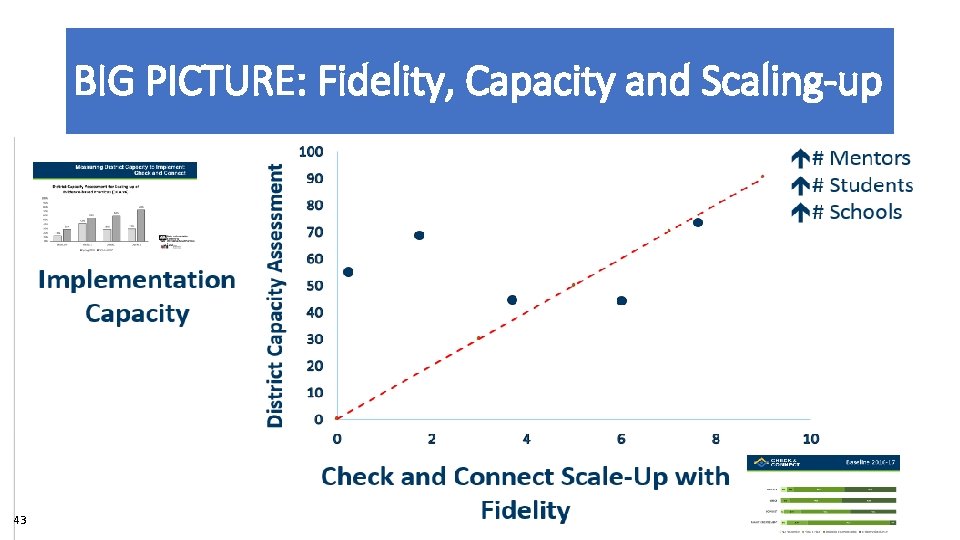
Measuring District Capacity to Implement: Check and Connect 27 2019 OSEP LEADERSHIP CONFERENCE
SSIP-DCA Highlights • All districts continue to increase capacity over prior years for implementing Check & Connect • Increases in Leadership and Competency Drivers ØSustained administrative support for implementations ØRefining Check & Connect training and coaching across districts • Increases in Organizational Driver ØDecision Support Data Systems development and improvement 28 2019 OSEP LEADERSHIP CONFERENCE
Successes and Opportunities for Developing District Capacity. . . Developing a Practical Balance between… • …“Doing” implementation work and “lifting up” implementation patterns with a common vocabulary across linked district and MDE teams (e. g. , applied v. conceptual implementation focus) • …“Expectations and focus of work”-- supporting district teams to identify next right steps without over-stepping with unwanted or unneeded guidance AND grounding progress with data Using an iterative process: Get started, Get better and MEASURE! 29 2019 OSEP LEADERSHIP CONFERENCE
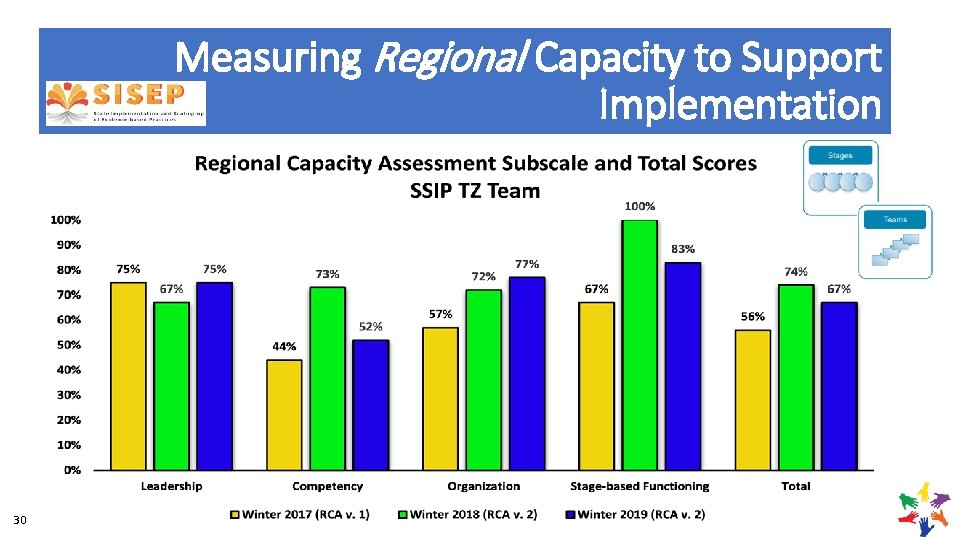
Measuring Regional Capacity to Support Implementation 30 2019 OSEP LEADERSHIP CONFERENCE
SSIP-RCA Highlights • Slight decrease in RCA total score to support Check & Connect implementation; item interpretation and relevance continue to be challenges • Continuing evidence that the TZ Team has the capacity of to support multiple districts across implementation stages • Identified needs in the area of Leadership Drivers, particularly to develop more formal implementation plans and guidance for TZ team members across all districts 31 2019 OSEP LEADERSHIP CONFERENCE
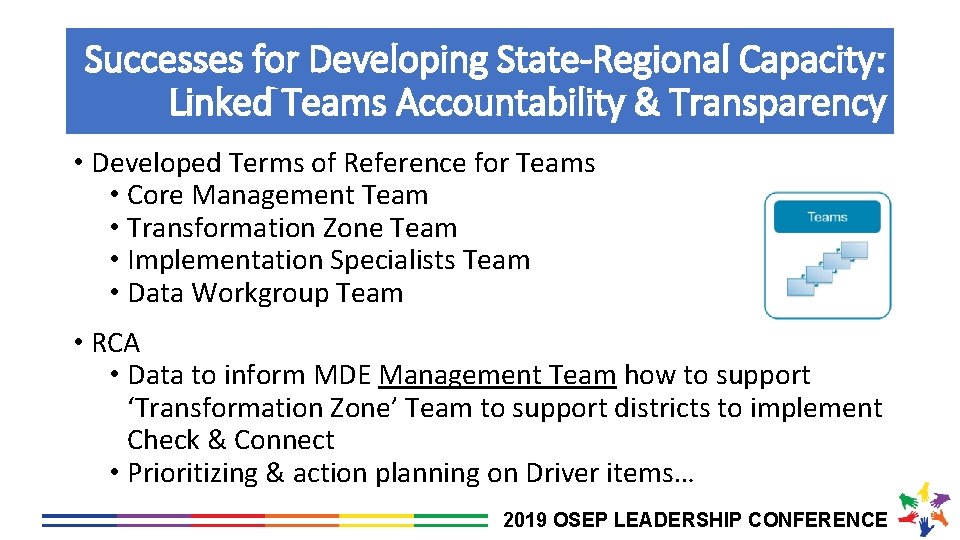
Successes for Developing State-Regional Capacity: Linked Teams Accountability & Transparency • Developed Terms of Reference for Teams • Core Management Team • Transformation Zone Team • Implementation Specialists Team • Data Workgroup Team • RCA • Data to inform MDE Management Team how to support ‘Transformation Zone’ Team to support districts to implement Check & Connect • Prioritizing & action planning on Driver items… 2019 OSEP LEADERSHIP CONFERENCE
Successes for Developing State-Regional Capacity: Transforming Division Work • Increasing Capacity for the use of Implementation Science • Professional Development for Division staff beyond MIT members • Coaching supports across teams • Using Implementation Science in natural opportunities of our work • Real world application to implement an evidence-based practice • Cross-unit teams in partnership with selected districts • Developing and using decision-making data systems to support the work 33 2019 OSEP LEADERSHIP CONFERENCE
Opportunities for Developing State-Regional Capacity: Using Data, Managing Roles • Get implementation data in front of teams ASAP and at regular intervals to make the next right step • Right info at right level (closest to where decision can be made—avoid micromanagement) • Right type of data at right time (e. g. , by Implementation Stage, Improvement Cycles) • Coach teams through the shift—from viewing data generation an reporting as ‘grant compliance’ to teams valuing and expecting implementation data for progress feedback and team use through improvement cycles • When moving from Implementation to Scaling: Impact on teams • Manage role clarity on team- multiple hats – researcher, practitioner, purveyor • Anticipate shifting role of entire team 34 2019 OSEP LEADERSHIP CONFERENCE
MDE in partnership with District Teams— Student/Mentor Scaling Form • District level ‘dashboard’ to continually measure progress AND implementation data • Number of students receiving C&C • Number of mentors • List Group Training & Coaching Events 35 2019 OSEP LEADERSHIP CONFERENCE
SSIP Student/Mentor Scaling Form District Data Summary 2018 -2019 Reporting period End Date Number of new (SSIP/SPDG) students: Number of continuing (SSIP/SPDG) students: Number of re-entering (SSIP/SPDG) students: Total students: Number of exiting (SSIP/SPDG) students: Number of newly trained staff serving SSIP/SPDG students: Number of newly trained staff not serving SSIP/SPDG students: Number of continuing staff serving SSIP/SPDG students: 36 Nov. 1 Feb. 1 122 98 2 220 179 20 1 57 30 199 1 229 131 7 14 21 Number of continuing trained staff not serving SSIP/SPDG students: 18 21 Total trained staff: 94 118 Number of exiting (SSIP/SPDG) mentors: 6 0 2019 OSEP LEADERSHIP Total schools: 17 CONFERENCE 17
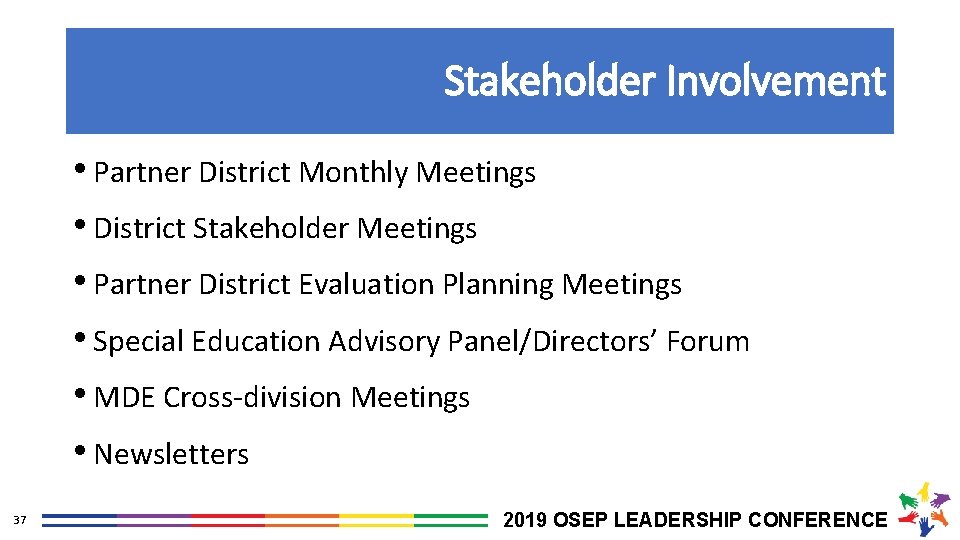
Stakeholder Involvement • Partner District Monthly Meetings • District Stakeholder Meetings • Partner District Evaluation Planning Meetings • Special Education Advisory Panel/Directors’ Forum • MDE Cross-division Meetings • Newsletters 37 2019 OSEP LEADERSHIP CONFERENCE
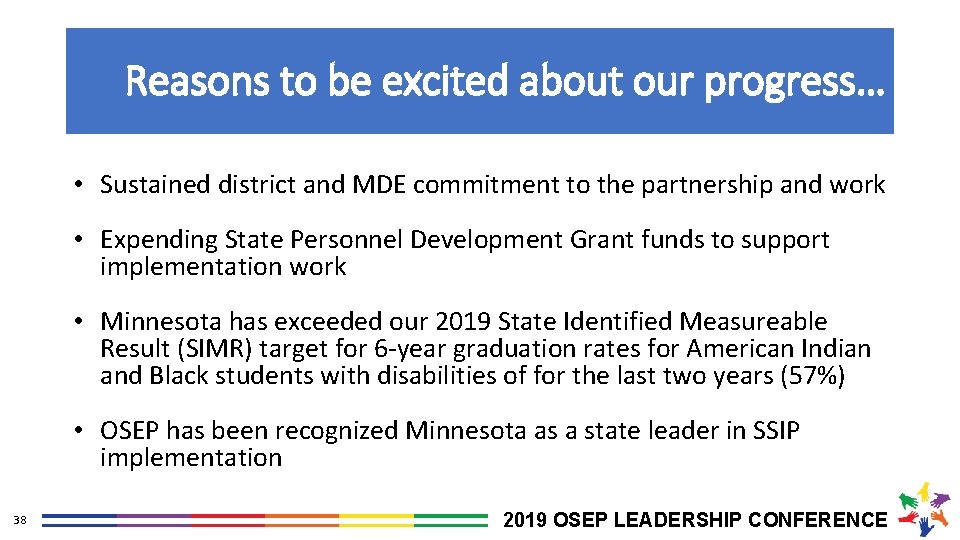
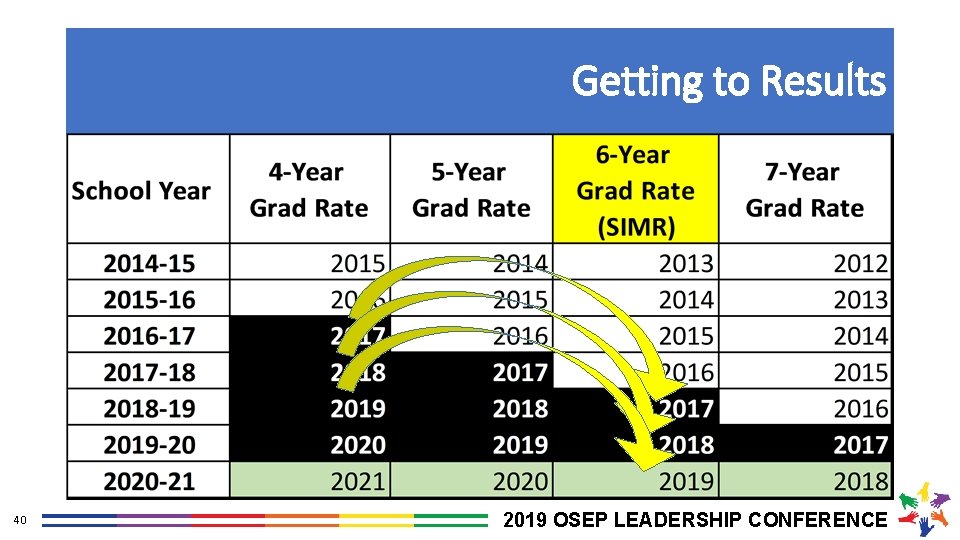
Reasons to be excited about our progress… • Sustained district and MDE commitment to the partnership and work • Expending State Personnel Development Grant funds to support implementation work • Minnesota has exceeded our 2019 State Identified Measureable Result (SIMR) target for 6 -year graduation rates for American Indian and Black students with disabilities of for the last two years (57%) • OSEP has been recognized Minnesota as a state leader in SSIP implementation 38 2019 OSEP LEADERSHIP CONFERENCE
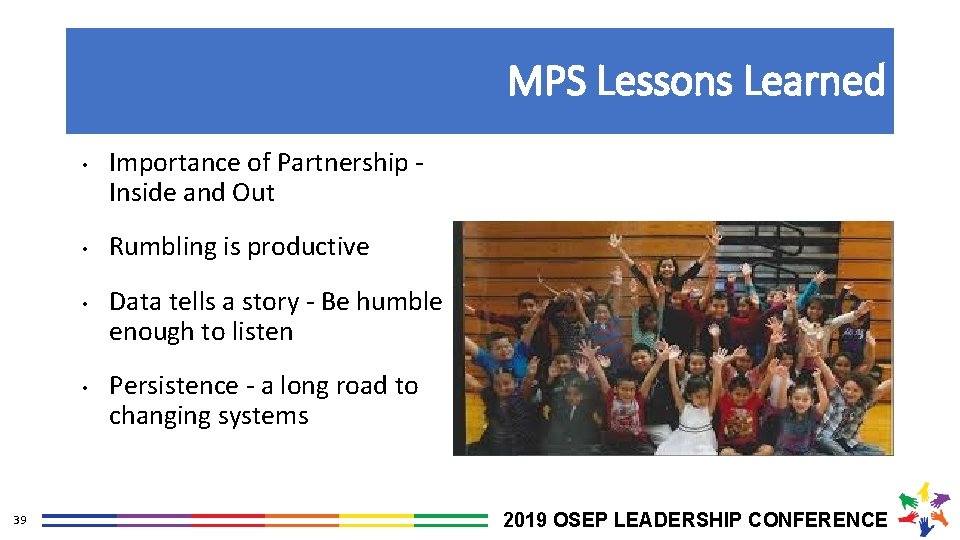
MPS Lessons Learned • • 39 Importance of Partnership Inside and Out Rumbling is productive Data tells a story - Be humble enough to listen Persistence - a long road to changing systems 2019 OSEP LEADERSHIP CONFERENCE
Getting to Results 40 2019 OSEP LEADERSHIP CONFERENCE
Where we’re going…. • Sustained fidelity of Check & Connect implementation… • Scaling to provide services to more students… • Deeper dive into student feedback about Check & Connect experiences… • Continuing to use effort, fidelity, and outcome data to inform team decision-making… • 41 …to continue to improve graduation outcomes of American Indian and black students with disabilities. 2019 OSEP LEADERSHIP CONFERENCE
AND… As stage based implementation efforts continue… — Checking effort and fidelity of practices against outcome data guides next steps in strengthening the implementation effort — It is important to note that effort and fidelity data are only meaningful when connected to results. Outcomes 42 2019 OSEP LEADERSHIP CONFERENCE
BIG PICTURE: Fidelity, Capacity and Scaling-up 43 2019 OSEP LEADERSHIP CONFERENCE
Discussion Questions: Areas for Collaboration and Support • How have you used and sustained the Active Implementation Frameworks in your state systemic improvement work? • What challenges and opportunities have you faced in building local capacity to sustain use of evidence-based practices? • What challenges and opportunities have you faced in building internal SEA capacity to support the work of your SSIP? 44 2019 OSEP LEADERSHIP CONFERENCE
OSEP Disclaimer 2019 OSEP Leadership Conference DISCLAIMER: The contents of this presentation were developed by the presenters for the 2019 OSEP Leadership Conference. However, these contents do not necessarily represent the policy of the Department of Education, and you should not assume endorsement by the Federal Government. (Authority: 20 U. S. C. 1221 e-3 and 3474)