Standard Deviation Lecture 18 Sec 5 3 4

- Slides: 26
Standard Deviation Lecture 18 Sec. 5. 3. 4 Tue, Feb 15, 2005
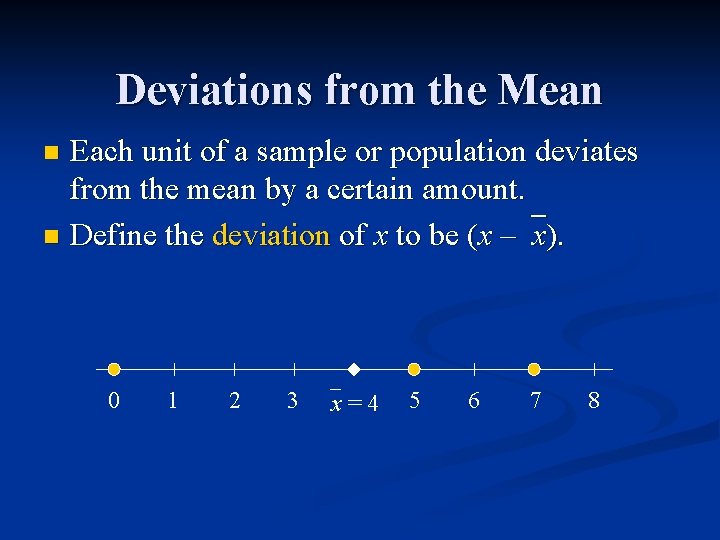
Deviations from the Mean Each unit of a sample or population deviates from the mean by a certain amount. n Define the deviation of x to be (x – x). n 0 1 2 3 x = 4 5 6 7 8
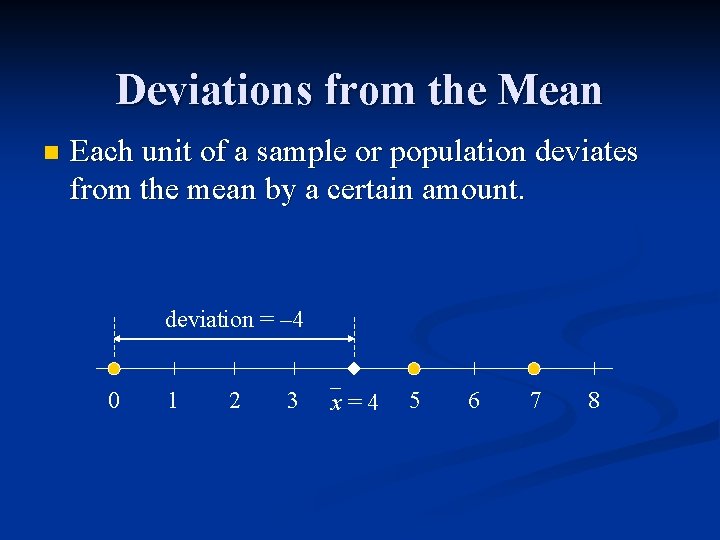
Deviations from the Mean n Each unit of a sample or population deviates from the mean by a certain amount. deviation = – 4 0 1 2 3 x = 4 5 6 7 8
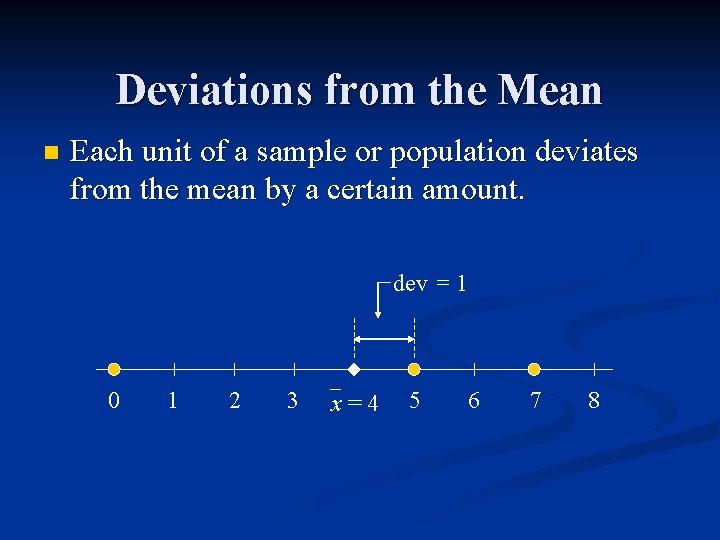
Deviations from the Mean n Each unit of a sample or population deviates from the mean by a certain amount. dev = 1 0 1 2 3 x = 4 5 6 7 8
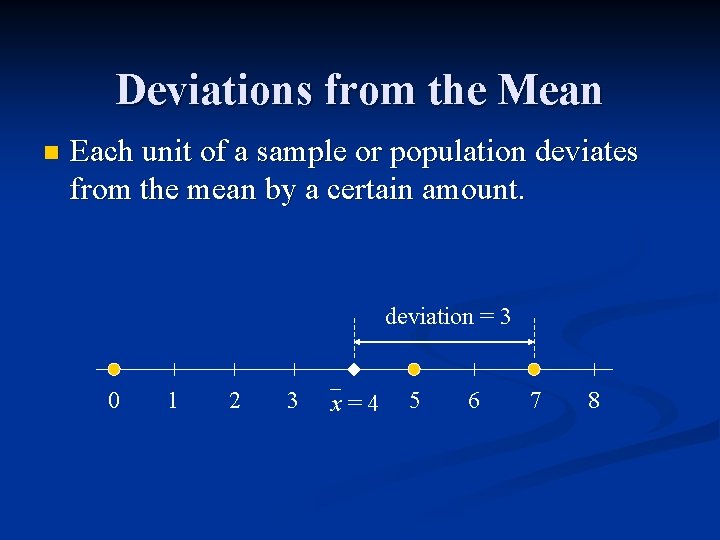
Deviations from the Mean n Each unit of a sample or population deviates from the mean by a certain amount. deviation = 3 0 1 2 3 x = 4 5 6 7 8
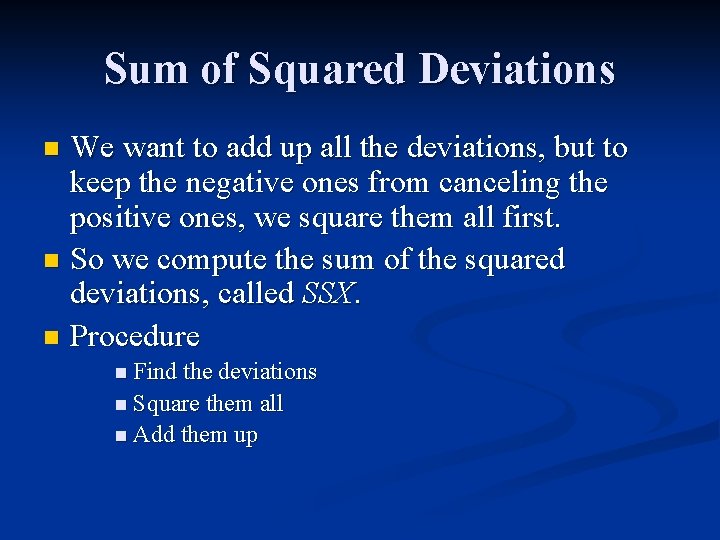
Sum of Squared Deviations We want to add up all the deviations, but to keep the negative ones from canceling the positive ones, we square them all first. n So we compute the sum of the squared deviations, called SSX. n Procedure n n Find the deviations n Square them all n Add them up
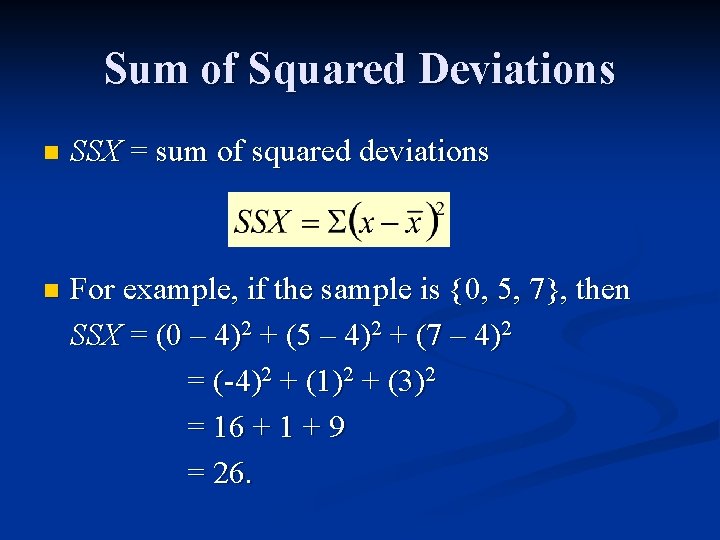
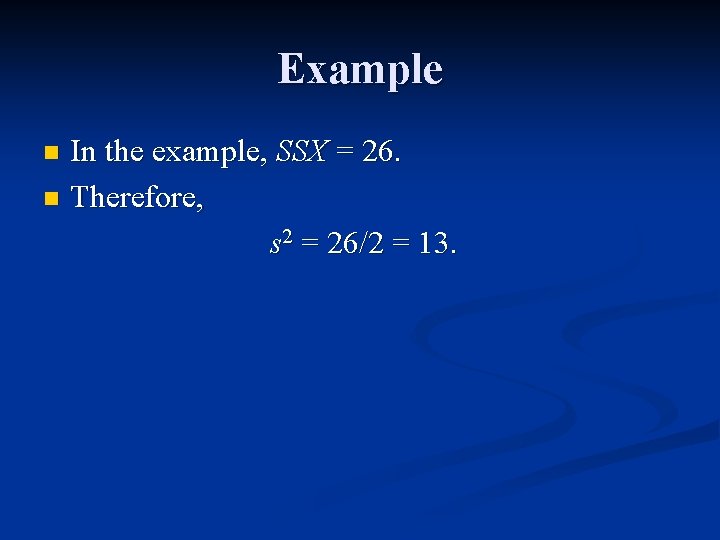
Sum of Squared Deviations n SSX = sum of squared deviations n For example, if the sample is {0, 5, 7}, then SSX = (0 – 4)2 + (5 – 4)2 + (7 – 4)2 = (-4)2 + (1)2 + (3)2 = 16 + 1 + 9 = 26.
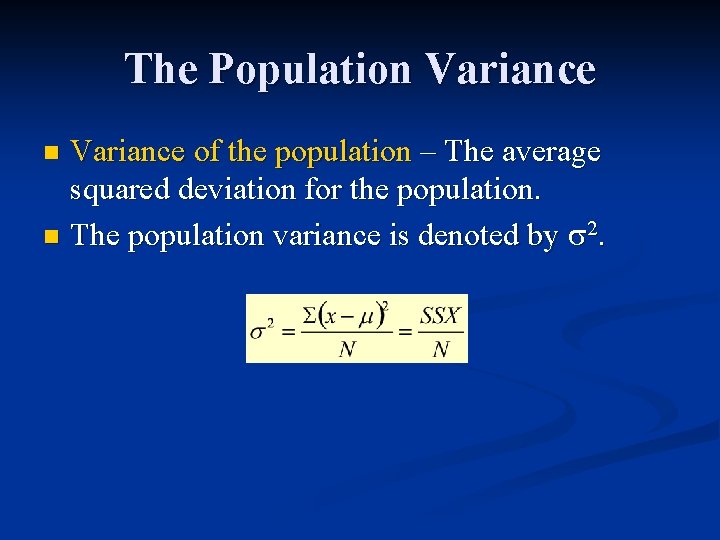
The Population Variance of the population – The average squared deviation for the population. n The population variance is denoted by 2. n
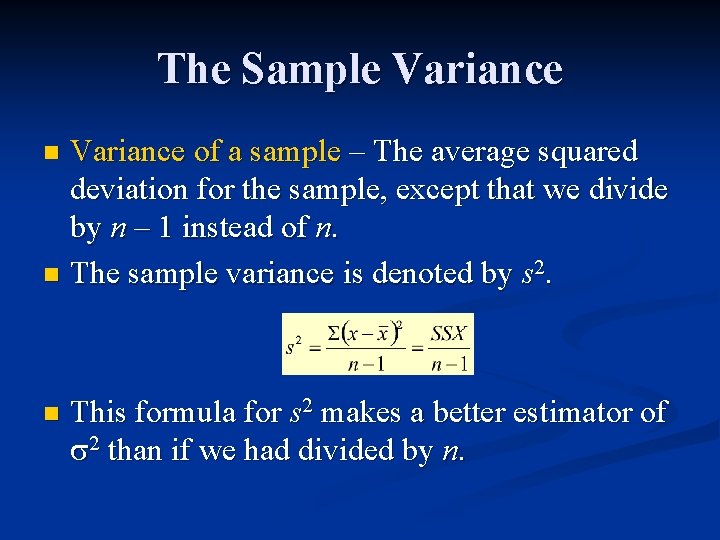
The Sample Variance of a sample – The average squared deviation for the sample, except that we divide by n – 1 instead of n. n The sample variance is denoted by s 2. n n This formula for s 2 makes a better estimator of 2 than if we had divided by n.
Example In the example, SSX = 26. n Therefore, s 2 = 26/2 = 13. n
The Standard Deviation Standard deviation – The square root of the variance of the sample or population. n The standard deviation of the population is denoted . n The standard deviation of a sample is denoted s. n
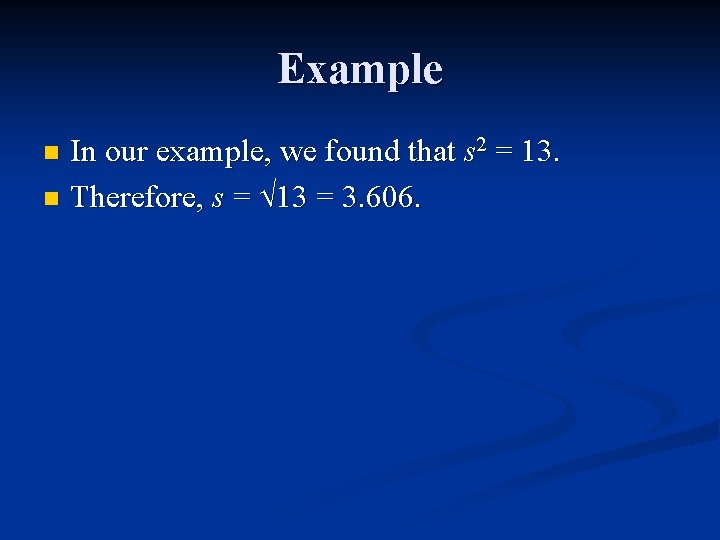
Example In our example, we found that s 2 = 13. n Therefore, s = 13 = 3. 606. n
Example 5. 10, p. 293. n Use Excel to compute the mean and standard deviation of the height and weight data. n Height. Weight. xls. n Use basic operations. n Use special functions. n
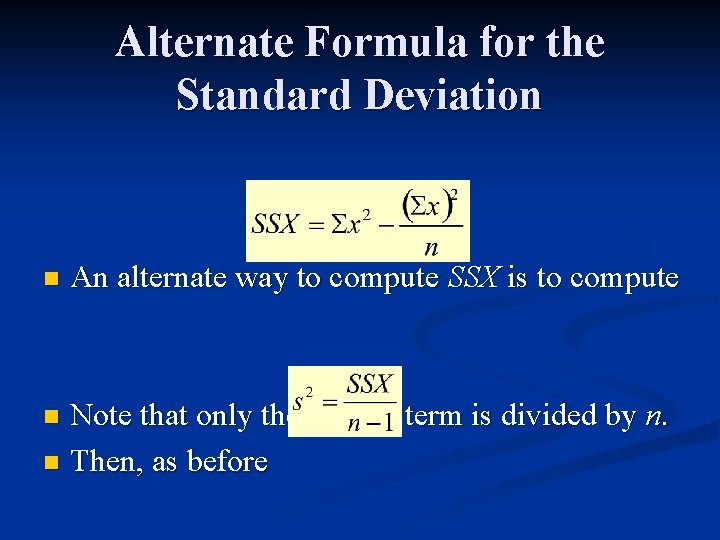
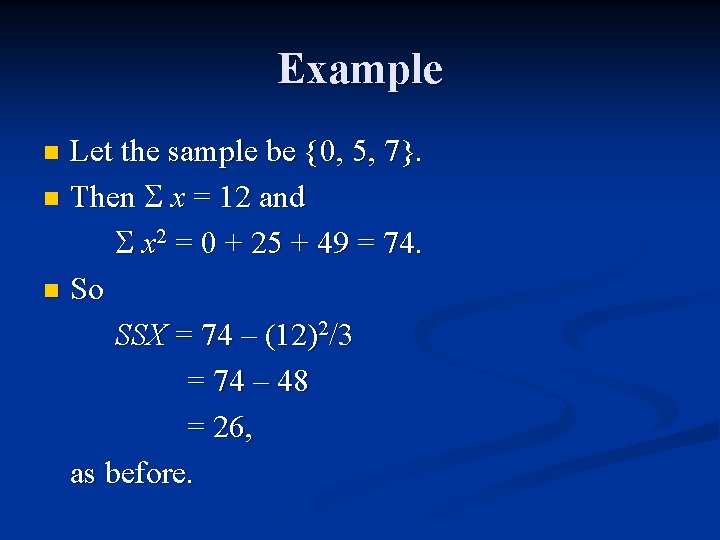
Alternate Formula for the Standard Deviation n An alternate way to compute SSX is to compute Note that only the second term is divided by n. n Then, as before n
Example Let the sample be {0, 5, 7}. n Then x = 12 and x 2 = 0 + 25 + 49 = 74. n So SSX = 74 – (12)2/3 = 74 – 48 = 26, as before. n
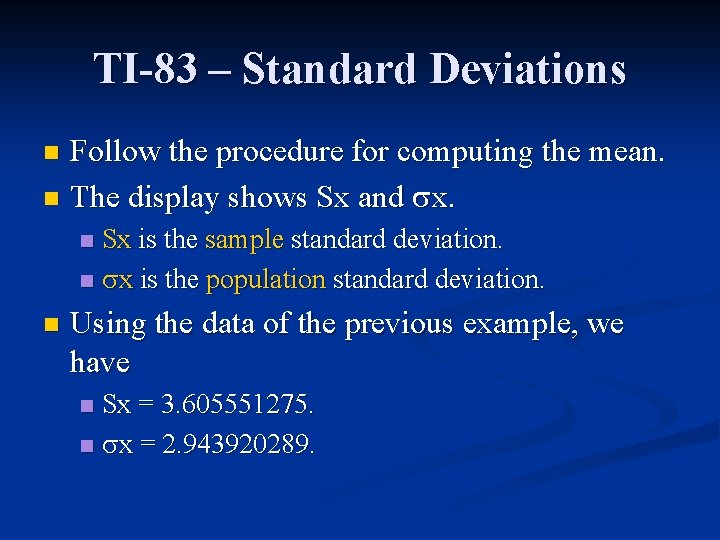
TI-83 – Standard Deviations Follow the procedure for computing the mean. n The display shows Sx and x. n Sx is the sample standard deviation. n x is the population standard deviation. n n Using the data of the previous example, we have Sx = 3. 605551275. n x = 2. 943920289. n
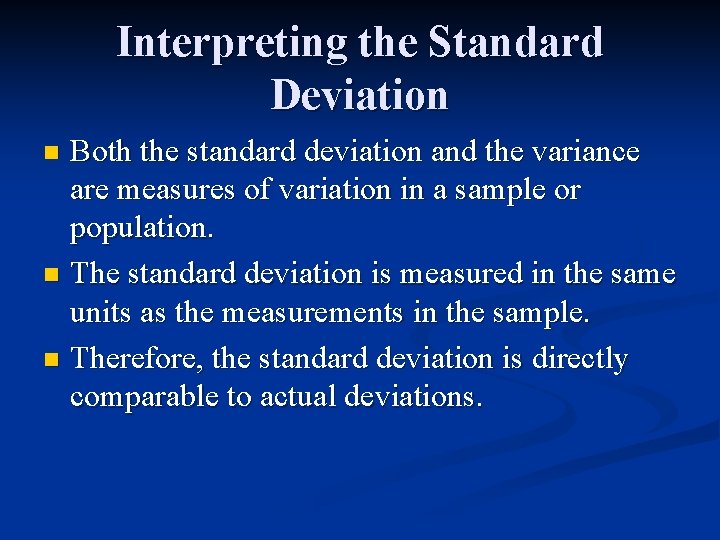
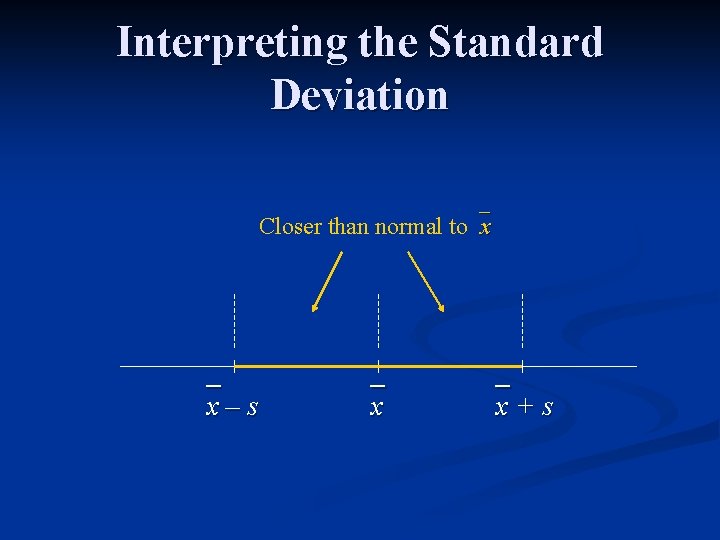
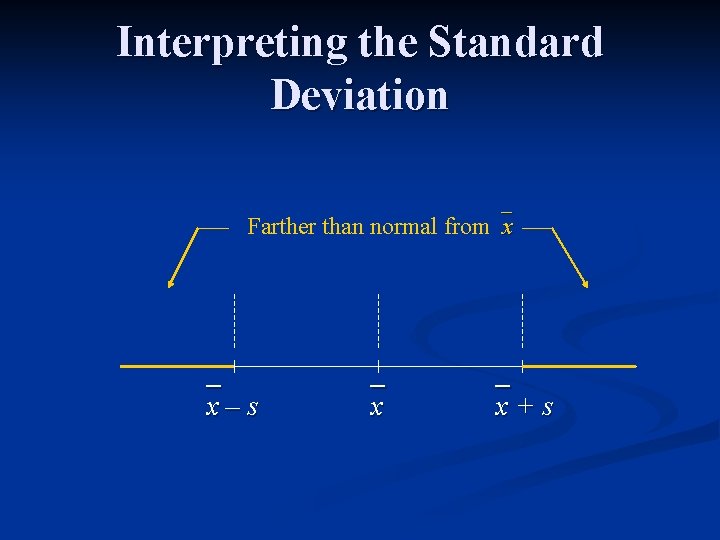
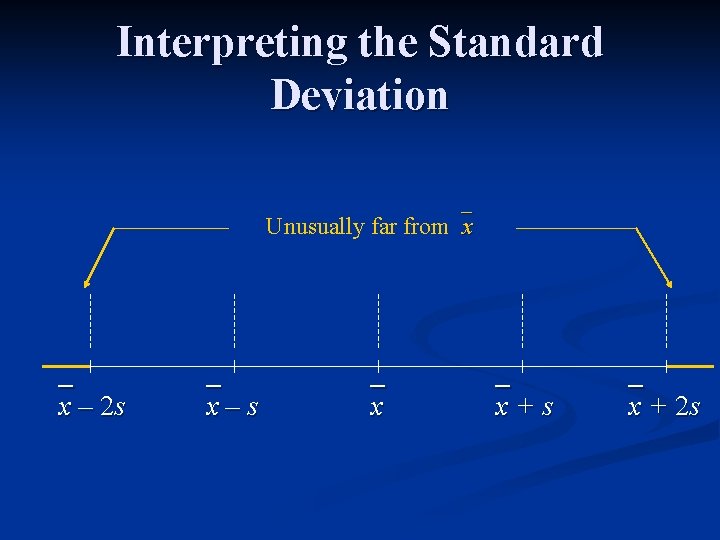
Interpreting the Standard Deviation Both the standard deviation and the variance are measures of variation in a sample or population. n The standard deviation is measured in the same units as the measurements in the sample. n Therefore, the standard deviation is directly comparable to actual deviations. n
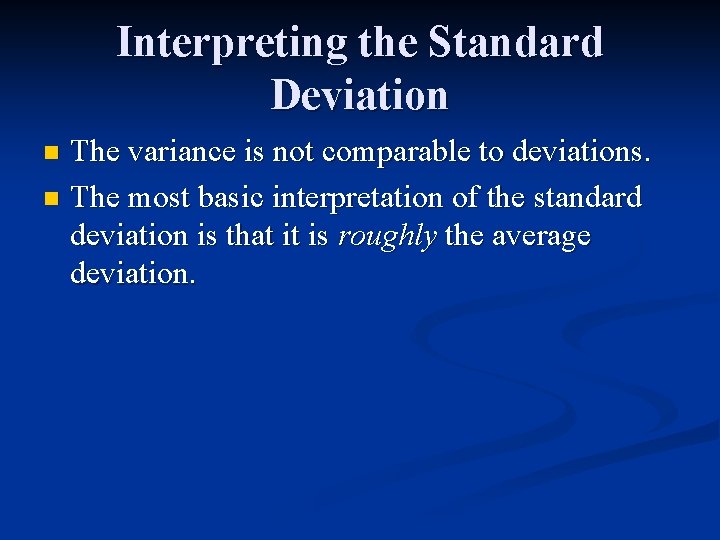
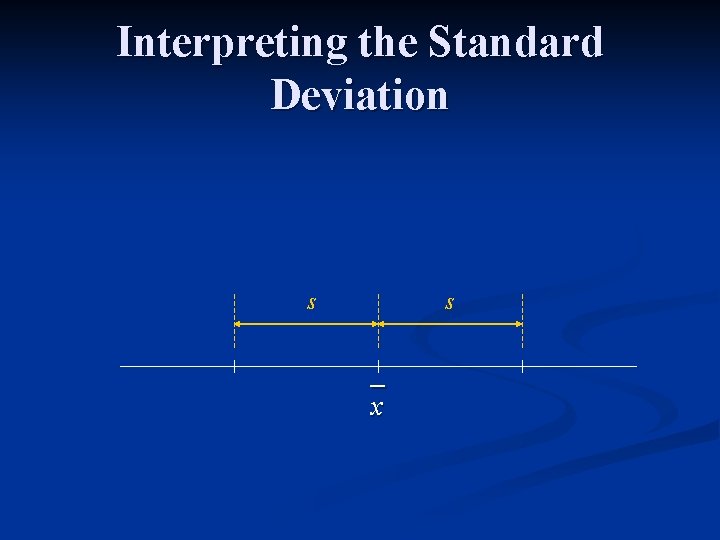
Interpreting the Standard Deviation The variance is not comparable to deviations. n The most basic interpretation of the standard deviation is that it is roughly the average deviation. n
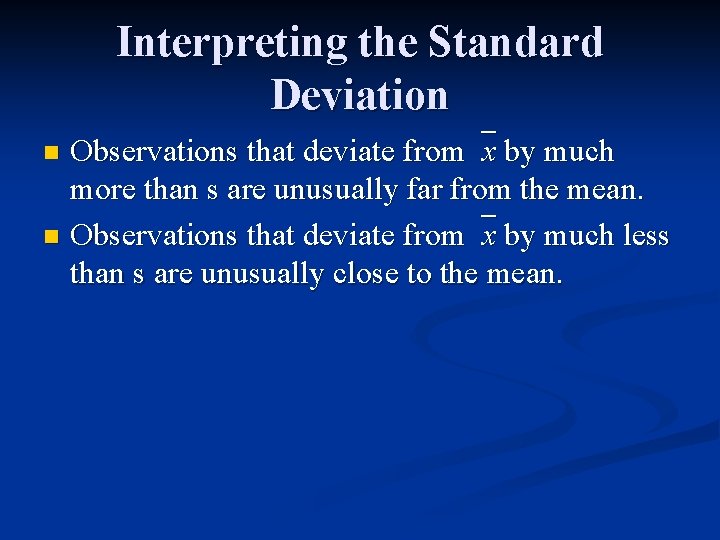
Interpreting the Standard Deviation Observations that deviate from x by much more than s are unusually far from the mean. n Observations that deviate from x by much less than s are unusually close to the mean. n
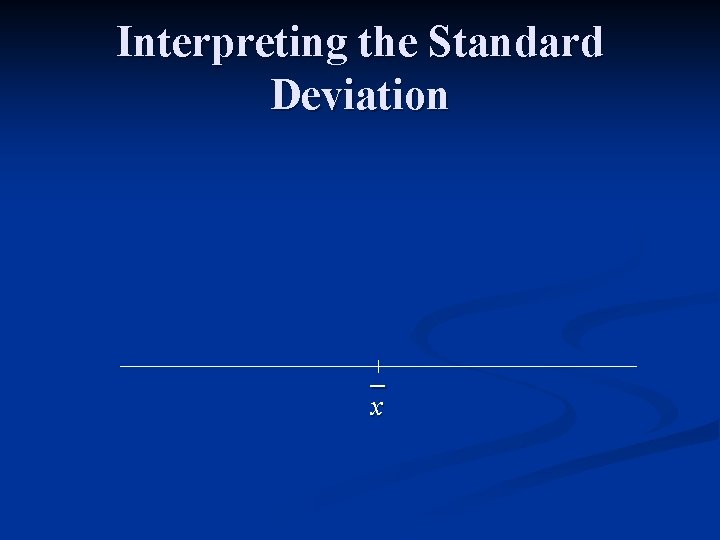
Interpreting the Standard Deviation x
Interpreting the Standard Deviation s s x
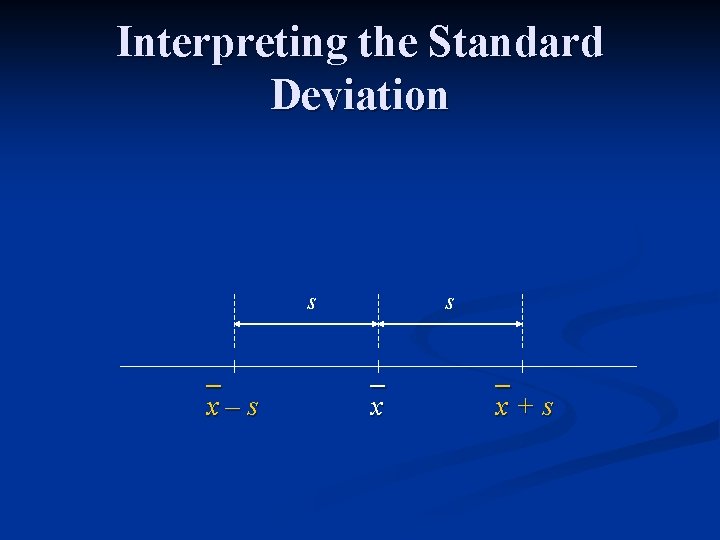
Interpreting the Standard Deviation s x – s s x x + s
Interpreting the Standard Deviation Closer than normal to x x – s x x + s
Interpreting the Standard Deviation Farther than normal from x x – s x x + s
Interpreting the Standard Deviation Unusually far from x x – 2 s x – s x x + s x + 2 s
Let’s Do It! Let’s do it! 5. 13, p. 295 – Increasing Spread. n Let’s do it! 5. 14, p. 297 – Variation in Scores. n