Chapter 4 Statistics Standard Deviation n Sample Standard


")


 We always put the larger standard deviation in")


- Slides: 42
Chapter 4 Statistics
Standard Deviation n Sample Standard deviation (for n Population Standard deviation use with small samples n< ~25) (for use with samples n > 25) n n m = population mean IN the absence of systematic error, the population mean approaches the true value for the measured quantity.
Example n The following results were obtained in the replicate analysis of a blood sample for its lead content: 0. 752, 0. 756, 0. 752, 0. 760 ppm lead. Calculate the mean and standard deviation for the data set.
Standard deviation n 0. 752, 0. 756, 0. 752, 0. 760 ppm lead. Excel® Demo You’d report the amount of lead in this sample of blood as
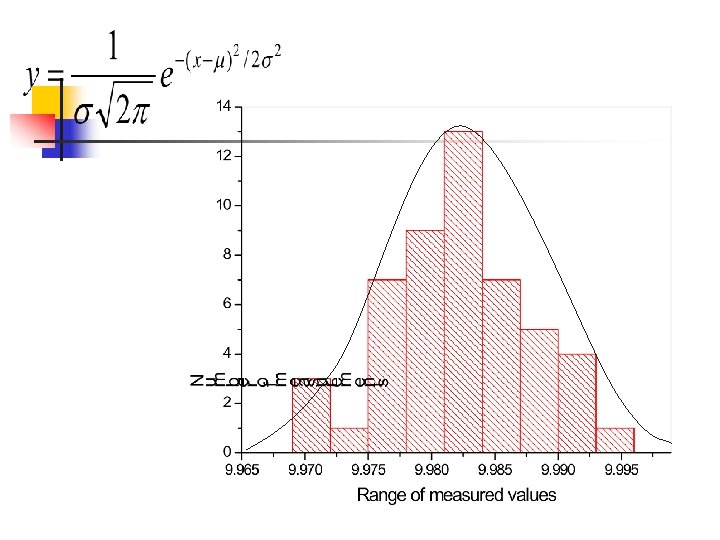
Distributions of Experimental Data n n We find that the distribution of replicate data from most quantitative analytical measurements approaches a Gaussian curve. Example – Consider the calibration of a pipet.
Replicate data on the calibration of a 10 -ml pipet.
Frequency distribution
Average= 9. 982 Std. Dev = + 0. 0056
4 -2 Confidence Intervals
For small data sets m is the true mean and the above equations express that the “true mean” will be in the calculated range at a given confidence.
Example n The following results were obtained in the replicate analysis of a blood sample for its lead content: 0. 752, 0. 756, 0. 752, 0. 760 ppm lead. Calculate the mean and standard deviation for the data set. Find (a) the 50% CL and (b) the 90% CL
Confidence Intervals ?
Confidence Intervals ?
Confidence Intervals ?
Confidence Intervals 90 % CI 50 % CI 0. 750 0. 755 0. 760 There is a 50% chance that the true mean, m, lies in the range 0. 755 + 0. 001 ppm (of from 0. 754 to 0. 756 ppm) Likewise, these calculations mean that there is a 90% chance that the true mean, m, lies in the range 0. 755 + 0. 005 ppm (of from 0. 750 to 0. 760 ppm)
Confidence limits and uncertainty n Suppose we measure the volume of a vessel five times and observe values: 6. 372, 6. 375, 6. 374, 6. 377, and 6. 375 m. L. And find average = 6. 3746 m. L And s = 0. 0018 m. L Use a 90% CL to Estimate uncertainty!
Experimental Uncertainty n Well, a 90% CI means that there is a 90% chance that the true volume is within the range. And find average = 6. 3746 m. L And s = 0. 0018 m. L
Experimental Uncertainty
Comparison of Means with Student’s t
Comparison of Means with Student’s t n A t test is used to compare one set of measurements with another to decide whether or not they are “The Same” n n Compare measured result with a “true” value Comparing two experimental means
Comparing a mean with a true value n n Good for detecting systematic (determinate) errors Uses student tvalues COMPARE TO ttable If tcalc > ttable – difference is significant If tcalc < ttable - difference is NOT significant
EXAMPLE n A new procedure for the rapid determination of sulfur in kerosene was tested on a KNOWN sample (m or xt = 0. 123% S). The results were: % S = 0. 112, 0. 118, 0. 115, and 0. 119. Is there a difference at the 95% confidence level?
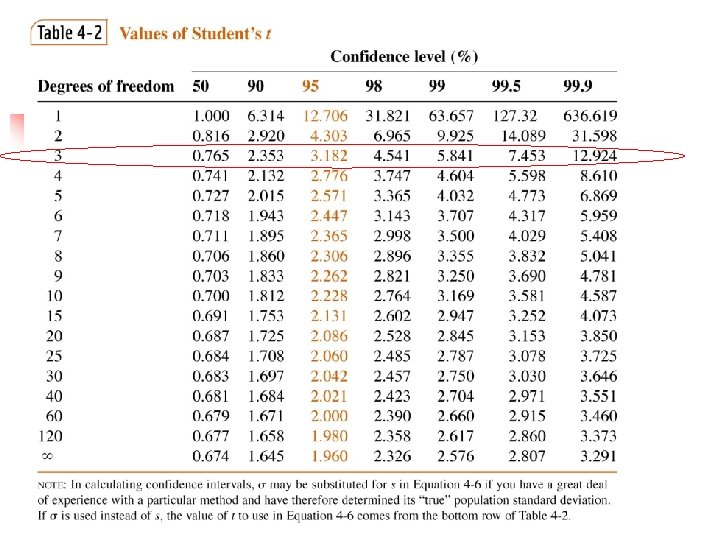
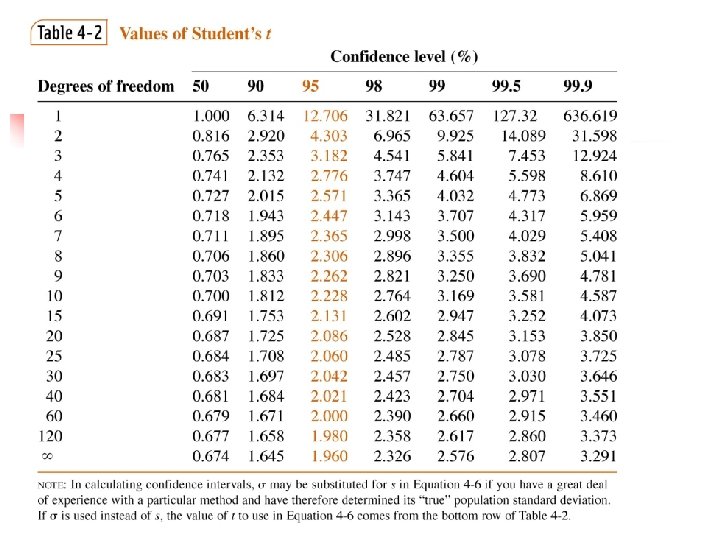
tcalculated = ttable = 3. 182 Are they significantly different?
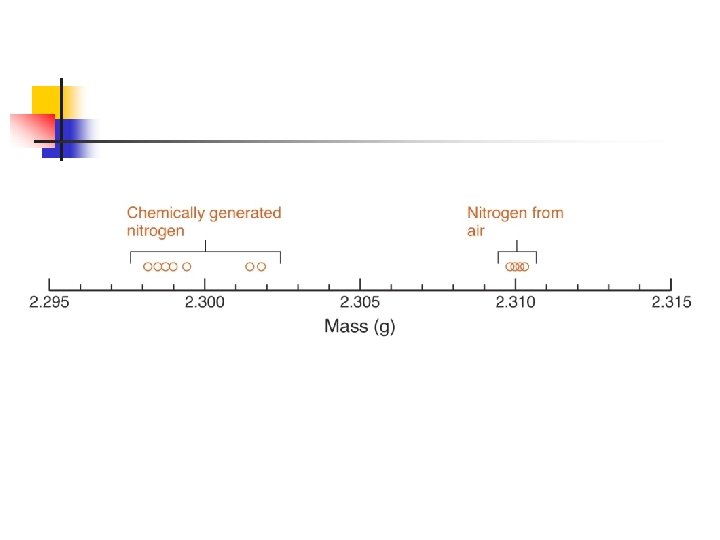
Strutt’s Story At the turn of the last century it was generally thought that dry air contained about one-fifth oxygen and four-fifths nitrogen. One man wanted to confirm this …. sample – Dry air … Added red-hot copper. Cu would react with oxygen to make solid copper oxide (Cu. O). n 1 st Air without Oxygen. 2 nd sample – Make an equal volume of nitrogen. n Pure Nitrogen can be generated by decomposition of N 2 O (Nitrous oxide) or NO (Nitric Oxide). Pure nitrogen. Reasoned the amounts would be the same
Is there a Difference at the 95% Confidence Level?
Comparison of two means
Comparison of two means
If tcalc > ttable – difference is significant n n Why the difference? In 1904, Lord Rayleigh was awarded the Novel Prize for discovering Argon
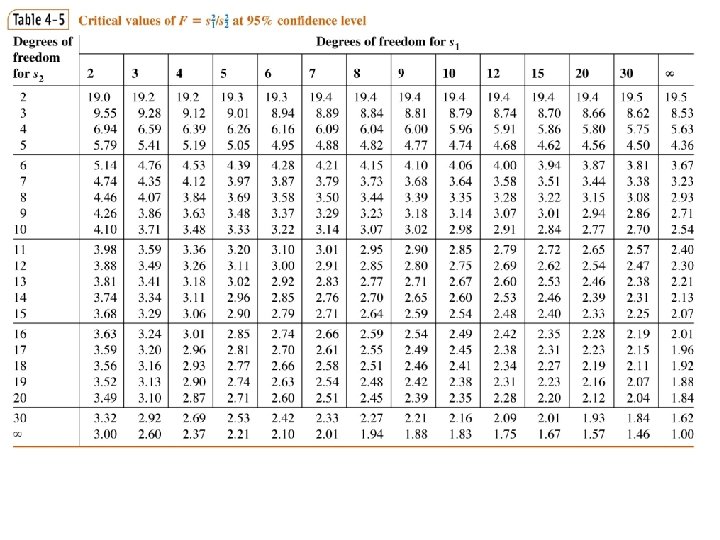
Comparison of Standard deviations between data n The F-test may be used to provide insights into: n Whethere is a difference in the precision of two methods. n n (may warrant a new calculation to compare means! ) Is method A more precise than method B?
F-test (comparison of std. dev. ) We always put the larger standard deviation in the numerator, so that F>1. If Fcalculated > Ftable then the difference is significant at the 95% CL.
Example A well developed method for protein concentration determination yields a standard deviation of 0. 25 M over many hundreds of replicates. A) Dr. Skeels develops a rapid method for the determination of protein concentration that yields a standard deviation of 0. 15 M (for 12 degrees of freedom). B) Dr. Marano’s method yields 0. 11 M (std dev) for the same number of degrees of freedom. Is Dr. Skeels’ method more precise than the standard or is Dr. Marano’s, or neither? n
Throwing out “Bad data”
For an analysis of alcohol content in wine Dr. Skeels finds the following: 12. 53, 12. 56, 12. 47, 12. 67, and 12. 48% n
Q-test for Bad Data Compare to Qcritical Qcalc > Qcritical can reject
Range 12. 47 12. 48 12. 53 12. 56 12. 67 Gap