
Statistical Methods Week 5 Sebaran Peluang Diskret Utama

Statistical Methods Week 5 Sebaran Peluang Diskret Utama / Some Important Discrete Probability Distributions Statistical Methods © 2004 Prentice-Hall, Inc. Week 5 -1
Chapter Goals After completing this chapter, you should be able to: § Interpret the mean and standard deviation for a discrete probability distribution § Explain covariance and its application in finance § Use the binomial probability distribution to find probabilities § Describe when to apply the binomial distribution § Use the hypergeometric and Poisson discrete probability distributions to find probabilities Statistical Methods © 2004 Prentice-Hall, Inc. Week 5 -2
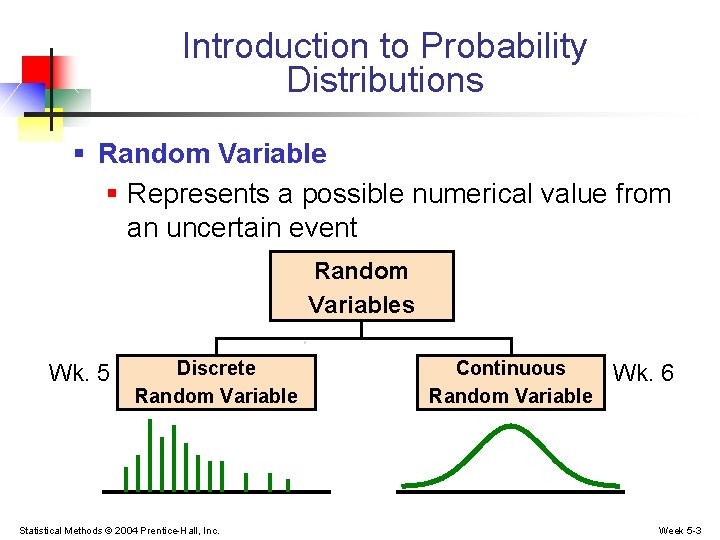
Introduction to Probability Distributions § Random Variable § Represents a possible numerical value from an uncertain event Random Variables Wk. 5 Discrete Random Variable Statistical Methods © 2004 Prentice-Hall, Inc. Continuous Random Variable Wk. 6 Week 5 -3
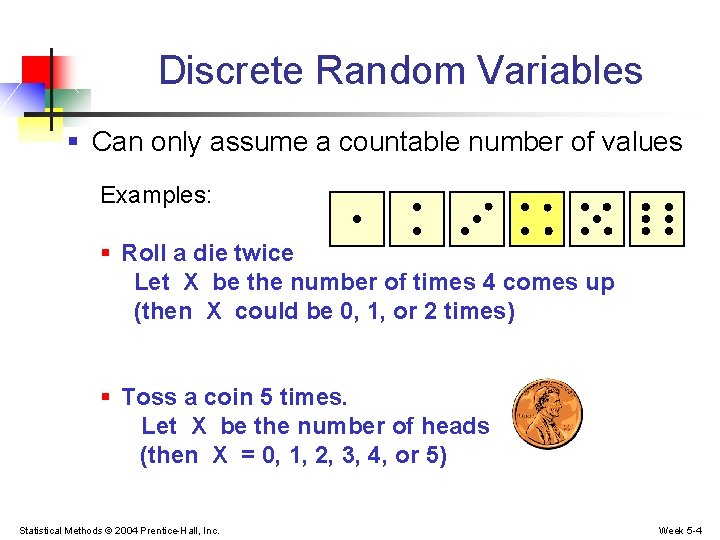
Discrete Random Variables § Can only assume a countable number of values Examples: § Roll a die twice Let X be the number of times 4 comes up (then X could be 0, 1, or 2 times) § Toss a coin 5 times. Let X be the number of heads (then X = 0, 1, 2, 3, 4, or 5) Statistical Methods © 2004 Prentice-Hall, Inc. Week 5 -4
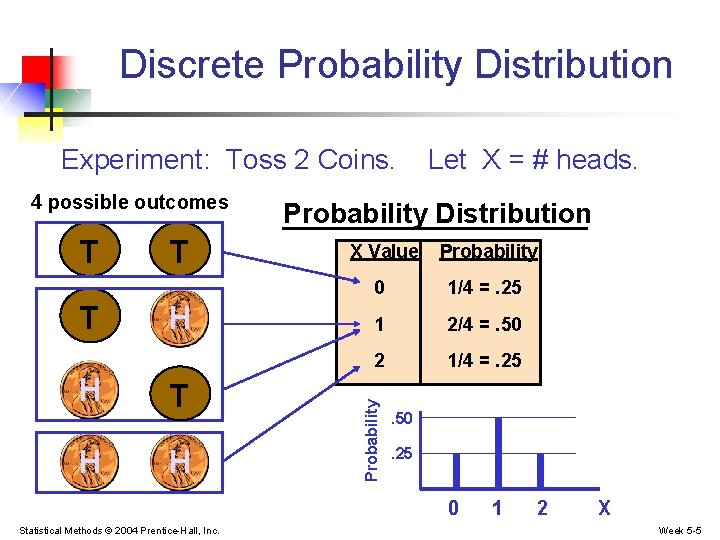
Discrete Probability Distribution Experiment: Toss 2 Coins. T T H H T H Probability Distribution X Value Probability 0 1/4 =. 25 1 2/4 =. 50 2 1/4 =. 25 Probability 4 possible outcomes Let X = # heads. . 50. 25 0 Statistical Methods © 2004 Prentice-Hall, Inc. 1 2 X Week 5 -5
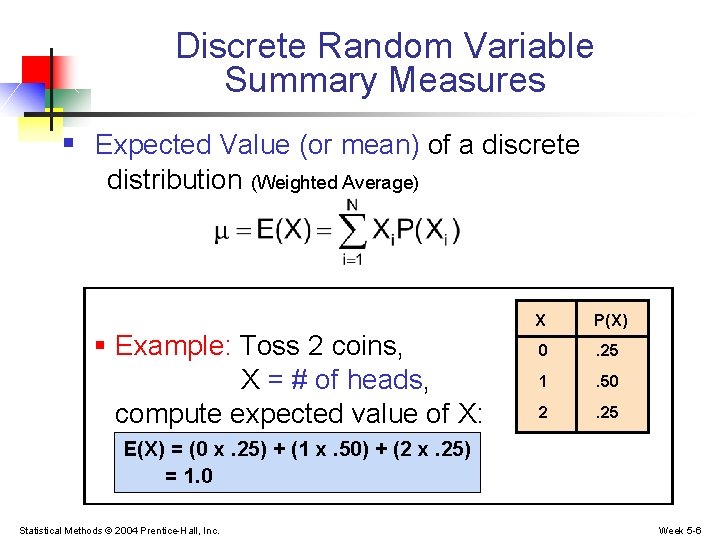
Discrete Random Variable Summary Measures § Expected Value (or mean) of a discrete distribution (Weighted Average) § Example: Toss 2 coins, X = # of heads, compute expected value of X: X P(X) 0 . 25 1 . 50 2 . 25 E(X) = (0 x. 25) + (1 x. 50) + (2 x. 25) = 1. 0 Statistical Methods © 2004 Prentice-Hall, Inc. Week 5 -6
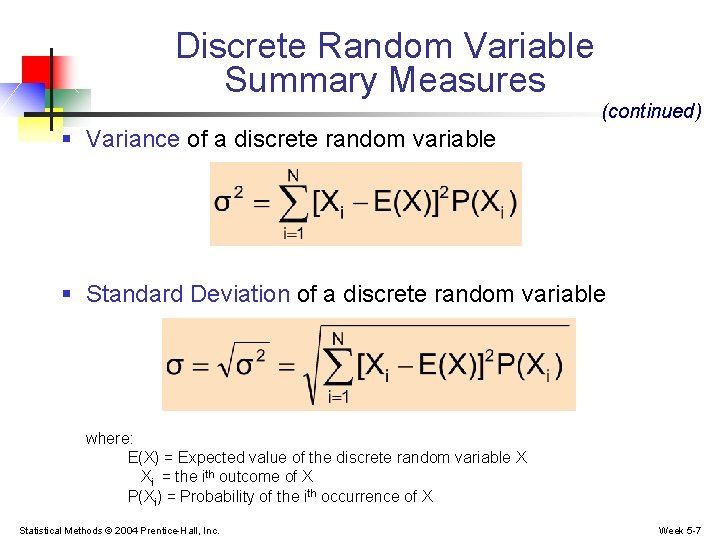
Discrete Random Variable Summary Measures (continued) § Variance of a discrete random variable § Standard Deviation of a discrete random variable where: E(X) = Expected value of the discrete random variable X Xi = the ith outcome of X P(Xi) = Probability of the ith occurrence of X Statistical Methods © 2004 Prentice-Hall, Inc. Week 5 -7
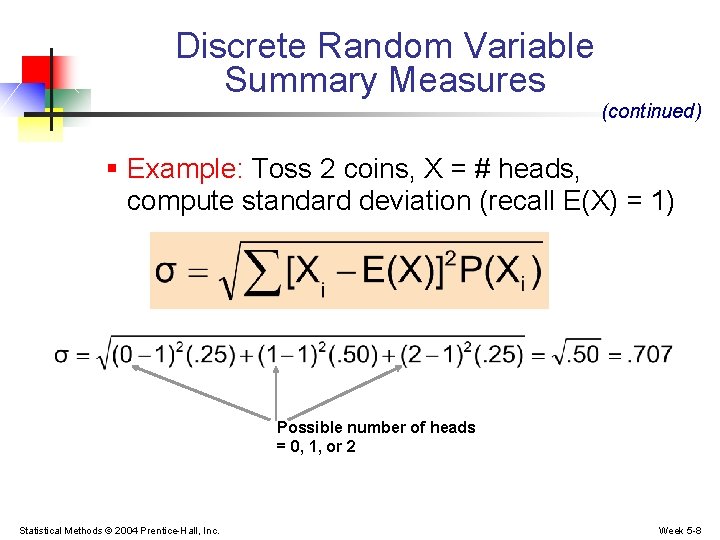
Discrete Random Variable Summary Measures (continued) § Example: Toss 2 coins, X = # heads, compute standard deviation (recall E(X) = 1) Possible number of heads = 0, 1, or 2 Statistical Methods © 2004 Prentice-Hall, Inc. Week 5 -8
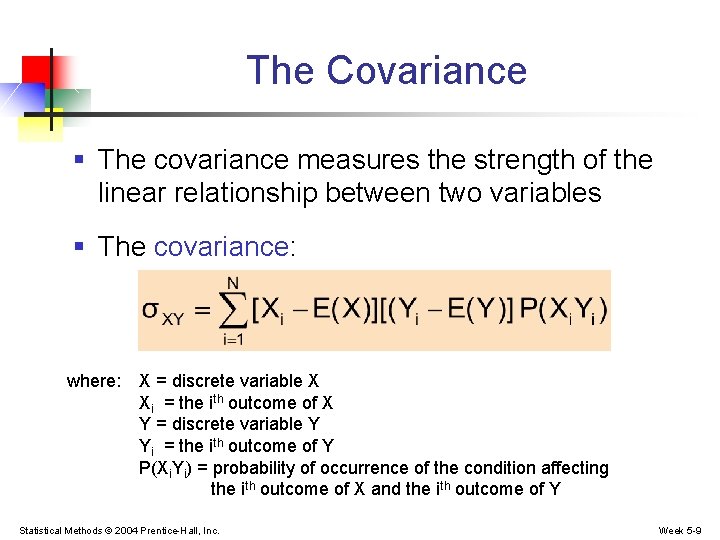
The Covariance § The covariance measures the strength of the linear relationship between two variables § The covariance: where: X = discrete variable X Xi = the ith outcome of X Y = discrete variable Y Yi = the ith outcome of Y P(Xi. Yi) = probability of occurrence of the condition affecting the ith outcome of X and the ith outcome of Y Statistical Methods © 2004 Prentice-Hall, Inc. Week 5 -9
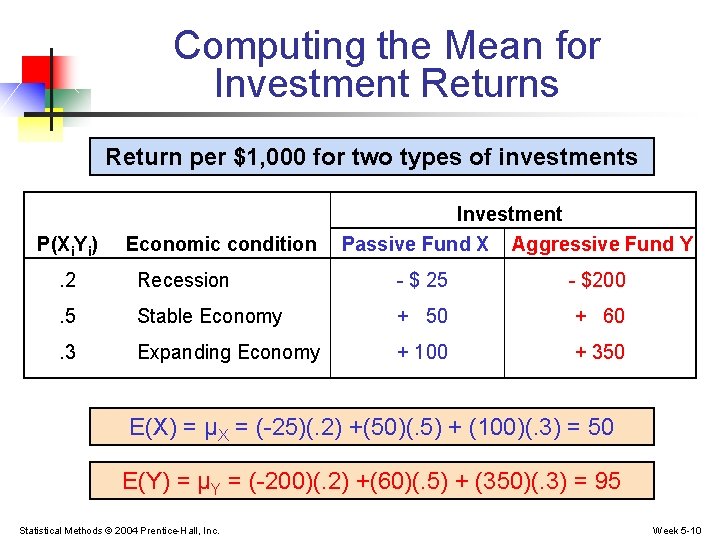
Computing the Mean for Investment Returns Return per $1, 000 for two types of investments P(Xi. Yi) Economic condition Investment Passive Fund X Aggressive Fund Y . 2 Recession - $ 25 - $200 . 5 Stable Economy + 50 + 60 . 3 Expanding Economy + 100 + 350 E(X) = μX = (-25)(. 2) +(50)(. 5) + (100)(. 3) = 50 E(Y) = μY = (-200)(. 2) +(60)(. 5) + (350)(. 3) = 95 Statistical Methods © 2004 Prentice-Hall, Inc. Week 5 -10
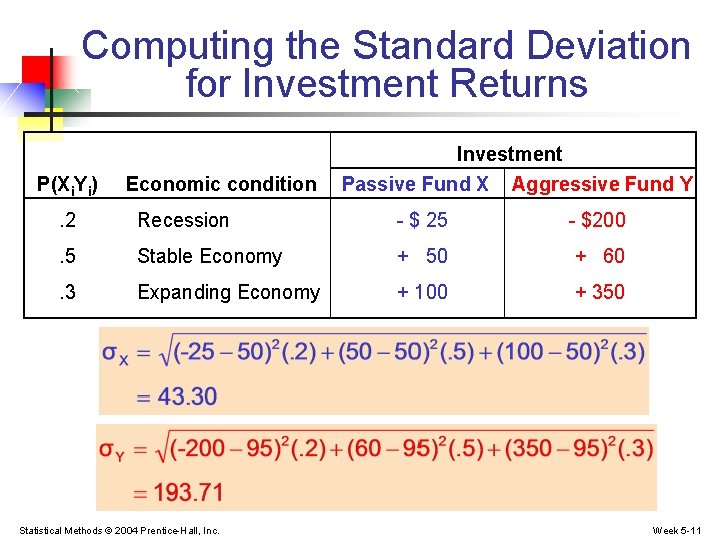
Computing the Standard Deviation for Investment Returns P(Xi. Yi) Economic condition Investment Passive Fund X Aggressive Fund Y . 2 Recession - $ 25 - $200 . 5 Stable Economy + 50 + 60 . 3 Expanding Economy + 100 + 350 Statistical Methods © 2004 Prentice-Hall, Inc. Week 5 -11
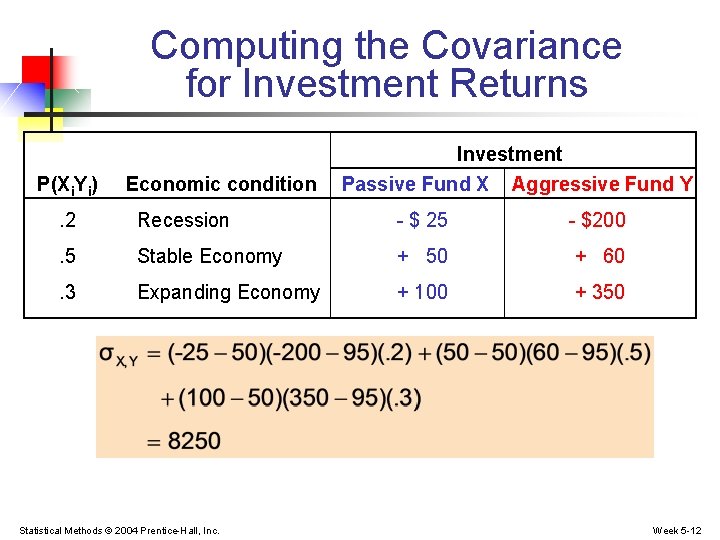
Computing the Covariance for Investment Returns P(Xi. Yi) Economic condition Investment Passive Fund X Aggressive Fund Y . 2 Recession - $ 25 - $200 . 5 Stable Economy + 50 + 60 . 3 Expanding Economy + 100 + 350 Statistical Methods © 2004 Prentice-Hall, Inc. Week 5 -12
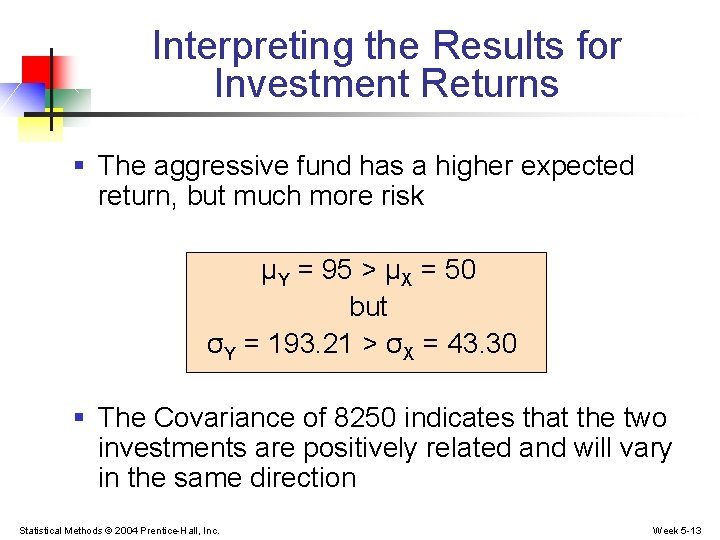
Interpreting the Results for Investment Returns § The aggressive fund has a higher expected return, but much more risk μY = 95 > μX = 50 but σY = 193. 21 > σX = 43. 30 § The Covariance of 8250 indicates that the two investments are positively related and will vary in the same direction Statistical Methods © 2004 Prentice-Hall, Inc. Week 5 -13
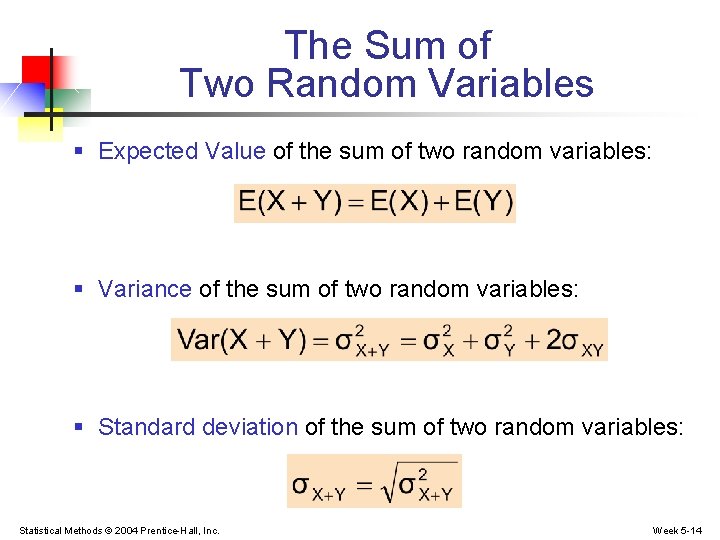
The Sum of Two Random Variables § Expected Value of the sum of two random variables: § Variance of the sum of two random variables: § Standard deviation of the sum of two random variables: Statistical Methods © 2004 Prentice-Hall, Inc. Week 5 -14

Portfolio Expected Return and Portfolio Risk § Portfolio expected return (weighted average return): § Portfolio risk (weighted variability) Where w = portion of portfolio value in asset X (1 - w) = portion of portfolio value in asset Y Statistical Methods © 2004 Prentice-Hall, Inc. Week 5 -15
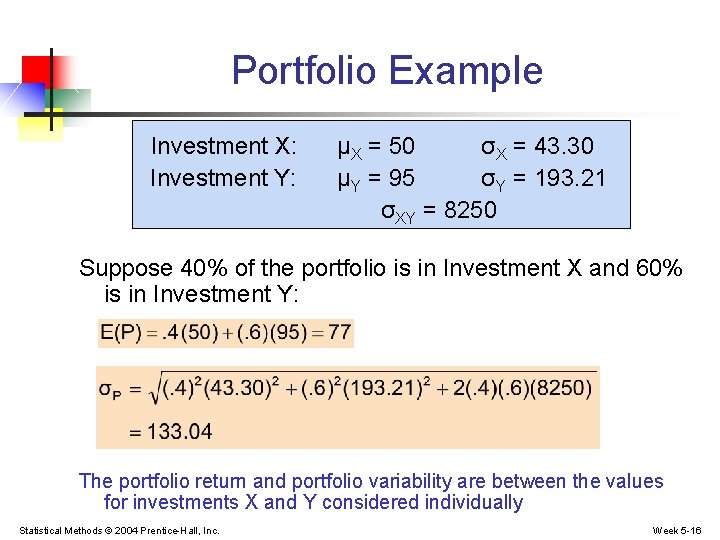
Portfolio Example Investment X: Investment Y: μX = 50 σX = 43. 30 μY = 95 σY = 193. 21 σXY = 8250 Suppose 40% of the portfolio is in Investment X and 60% is in Investment Y: The portfolio return and portfolio variability are between the values for investments X and Y considered individually Statistical Methods © 2004 Prentice-Hall, Inc. Week 5 -16
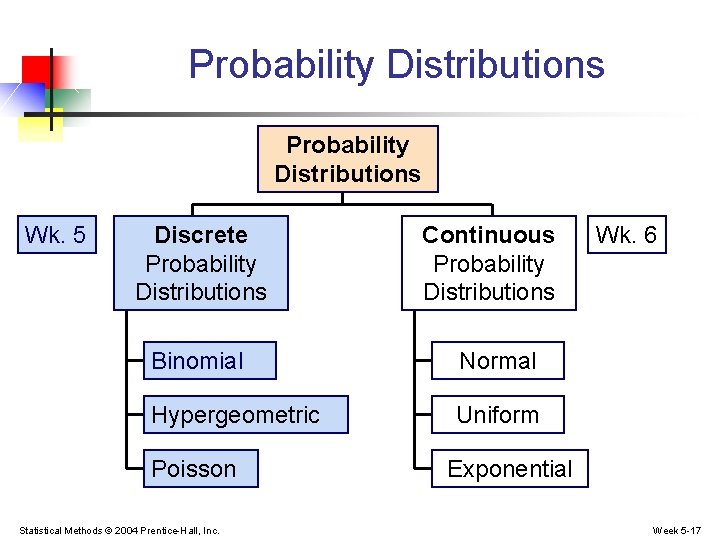
Probability Distributions Wk. 5 Discrete Probability Distributions Continuous Probability Distributions Binomial Normal Hypergeometric Uniform Poisson Statistical Methods © 2004 Prentice-Hall, Inc. Wk. 6 Exponential Week 5 -17
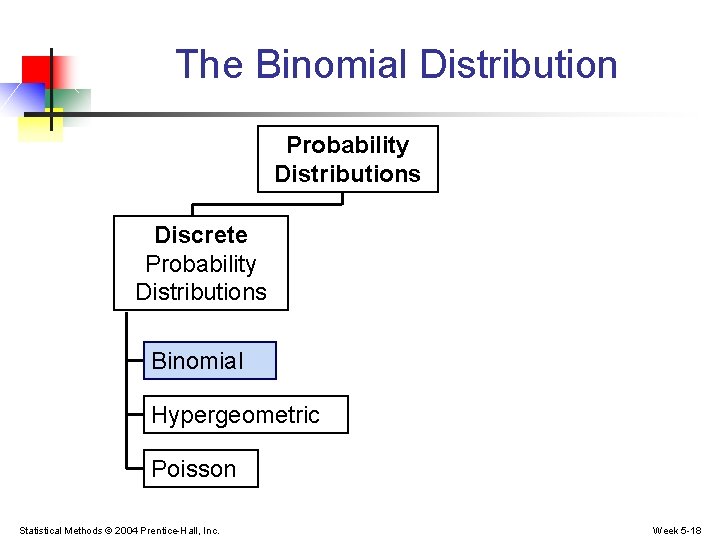
The Binomial Distribution Probability Distributions Discrete Probability Distributions Binomial Hypergeometric Poisson Statistical Methods © 2004 Prentice-Hall, Inc. Week 5 -18
Binomial Probability Distribution § A fixed number of observations, n § e. g. , 15 tosses of a coin; ten light bulbs taken from a warehouse § Two mutually exclusive and collectively exhaustive categories § e. g. , head or tail in each toss of a coin; defective or not defective light bulb § Generally called “success” and “failure” § Probability of success is p, probability of failure is 1 – p § Constant probability for each observation § e. g. , Probability of getting a tail is the same each time we toss the coin Statistical Methods © 2004 Prentice-Hall, Inc. Week 5 -19
Binomial Probability Distribution (continued) § Observations are independent § The outcome of one observation does not affect the outcome of the other § Two sampling methods § Infinite population without replacement § Finite population with replacement Statistical Methods © 2004 Prentice-Hall, Inc. Week 5 -20
Possible Binomial Distribution Settings § A manufacturing plant labels items as either defective or acceptable § A firm bidding for contracts will either get a contract or not § A marketing research firm receives survey responses of “yes I will buy” or “no I will not” § New job applicants either accept the offer or reject it Statistical Methods © 2004 Prentice-Hall, Inc. Week 5 -21
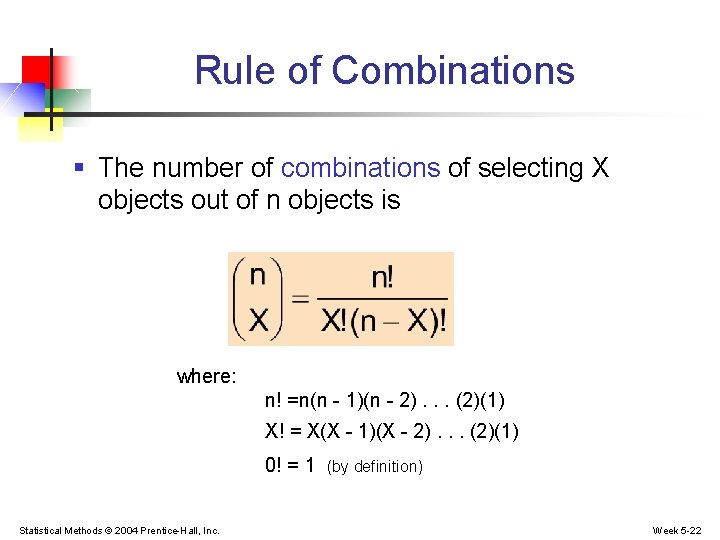
Rule of Combinations § The number of combinations of selecting X objects out of n objects is where: n! =n(n - 1)(n - 2). . . (2)(1) X! = X(X - 1)(X - 2). . . (2)(1) 0! = 1 Statistical Methods © 2004 Prentice-Hall, Inc. (by definition) Week 5 -22
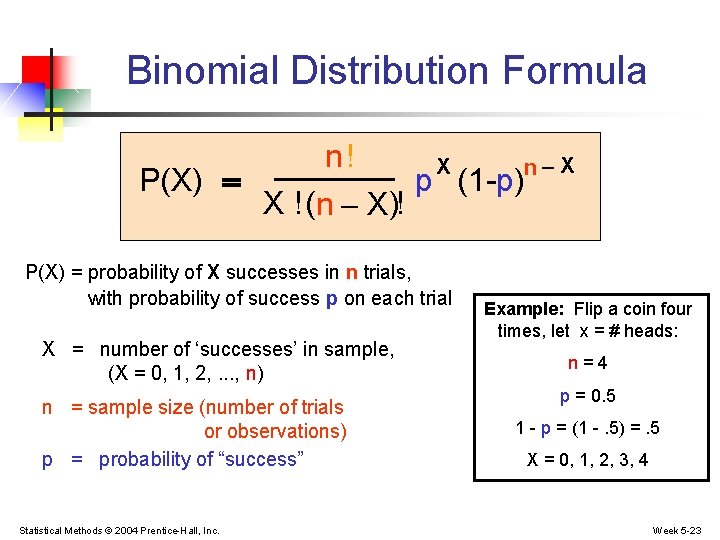
Binomial Distribution Formula n! X n-X P(X) = p (1 -p) X ! (n - X)! P(X) = probability of X successes in n trials, with probability of success p on each trial X = number of ‘successes’ in sample, (X = 0, 1, 2, . . . , n) n = sample size (number of trials or observations) p = probability of “success” Statistical Methods © 2004 Prentice-Hall, Inc. Example: Flip a coin four times, let x = # heads: n=4 p = 0. 5 1 - p = (1 -. 5) =. 5 X = 0, 1, 2, 3, 4 Week 5 -23
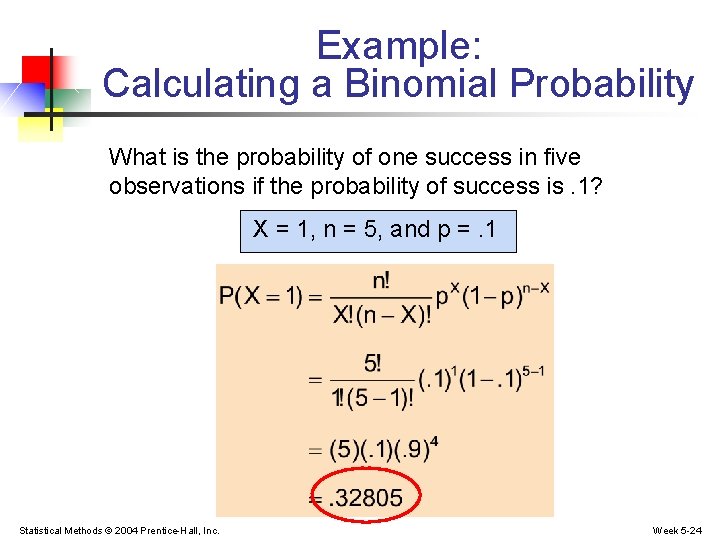
Example: Calculating a Binomial Probability What is the probability of one success in five observations if the probability of success is. 1? X = 1, n = 5, and p =. 1 Statistical Methods © 2004 Prentice-Hall, Inc. Week 5 -24
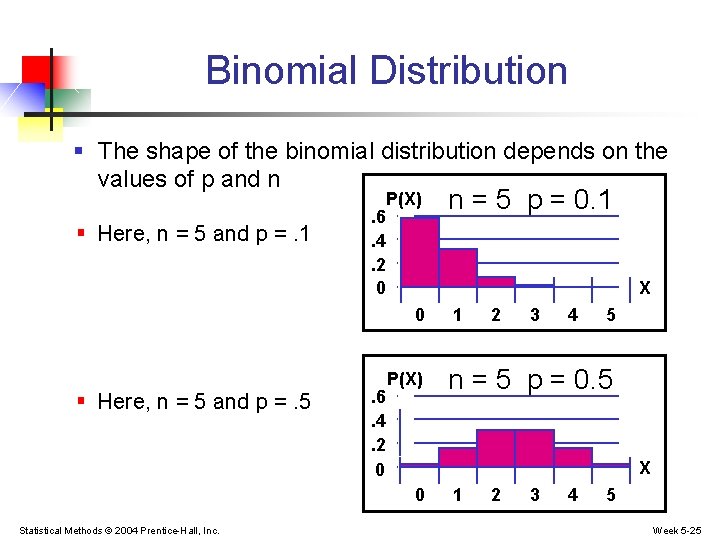
Binomial Distribution § The shape of the binomial distribution depends on the values of p and n Mean § Here, n = 5 and p =. 1 . 6. 4. 2 0 P(X) X 0 § Here, n = 5 and p =. 5 . 6. 4. 2 0 P(X) 1 2 3 4 5 n = 5 p = 0. 5 X 0 Statistical Methods © 2004 Prentice-Hall, Inc. n = 5 p = 0. 1 1 2 3 4 5 Week 5 -25
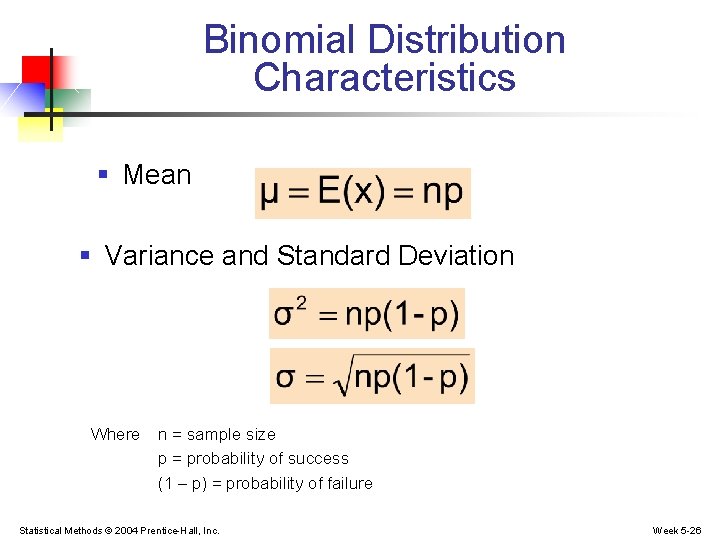
Binomial Distribution Characteristics § Mean § Variance and Standard Deviation Where n = sample size p = probability of success (1 – p) = probability of failure Statistical Methods © 2004 Prentice-Hall, Inc. Week 5 -26
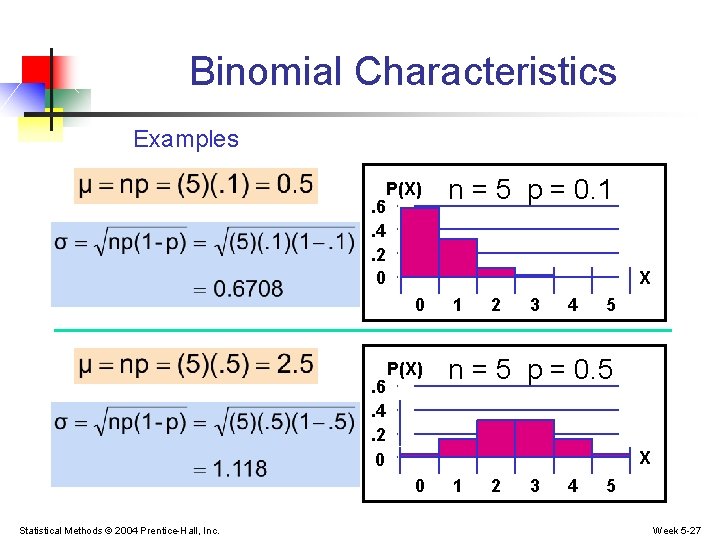
Binomial Characteristics Examples Mean . 6. 4. 2 0 P(X) X 0 . 6. 4. 2 0 P(X) 1 2 3 4 5 n = 5 p = 0. 5 X 0 Statistical Methods © 2004 Prentice-Hall, Inc. n = 5 p = 0. 1 1 2 3 4 5 Week 5 -27
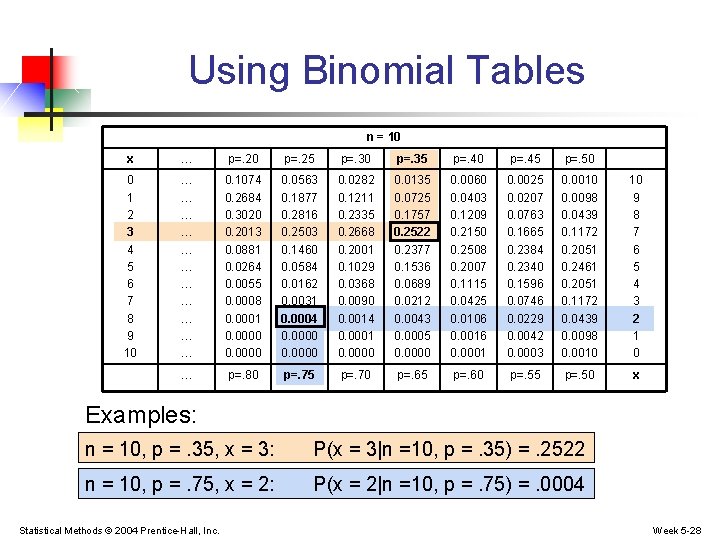
Using Binomial Tables n = 10 x … p=. 20 p=. 25 p=. 30 p=. 35 p=. 40 p=. 45 p=. 50 0 1 2 3 4 5 6 7 8 9 10 … … … 0. 1074 0. 2684 0. 3020 0. 2013 0. 0881 0. 0264 0. 0055 0. 0008 0. 0001 0. 0000 0. 0563 0. 1877 0. 2816 0. 2503 0. 1460 0. 0584 0. 0162 0. 0031 0. 0004 0. 0000 0. 0282 0. 1211 0. 2335 0. 2668 0. 2001 0. 1029 0. 0368 0. 0090 0. 0014 0. 0001 0. 0000 0. 0135 0. 0725 0. 1757 0. 2522 0. 2377 0. 1536 0. 0689 0. 0212 0. 0043 0. 0005 0. 0000 0. 0060 0. 0403 0. 1209 0. 2150 0. 2508 0. 2007 0. 1115 0. 0425 0. 0106 0. 0016 0. 0001 0. 0025 0. 0207 0. 0763 0. 1665 0. 2384 0. 2340 0. 1596 0. 0746 0. 0229 0. 0042 0. 0003 0. 0010 0. 0098 0. 0439 0. 1172 0. 2051 0. 2461 0. 2051 0. 1172 0. 0439 0. 0098 0. 0010 10 9 8 7 6 5 4 3 2 1 0 … p=. 80 p=. 75 p=. 70 p=. 65 p=. 60 p=. 55 p=. 50 x Examples: n = 10, p =. 35, x = 3: P(x = 3|n =10, p =. 35) =. 2522 n = 10, p =. 75, x = 2: P(x = 2|n =10, p =. 75) =. 0004 Statistical Methods © 2004 Prentice-Hall, Inc. Week 5 -28
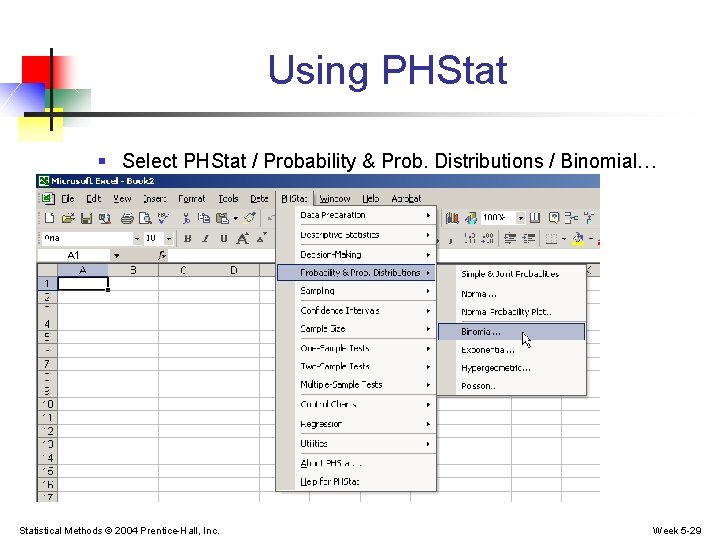
Using PHStat § Select PHStat / Probability & Prob. Distributions / Binomial… Statistical Methods © 2004 Prentice-Hall, Inc. Week 5 -29
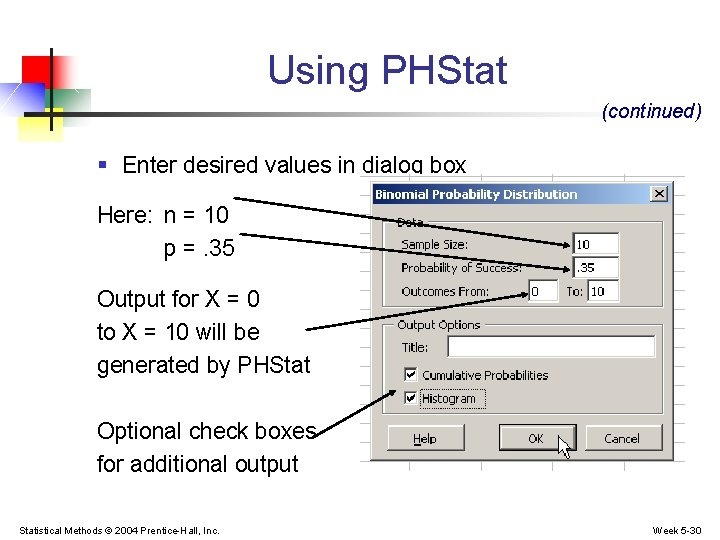
Using PHStat (continued) § Enter desired values in dialog box Here: n = 10 p =. 35 Output for X = 0 to X = 10 will be generated by PHStat Optional check boxes for additional output Statistical Methods © 2004 Prentice-Hall, Inc. Week 5 -30
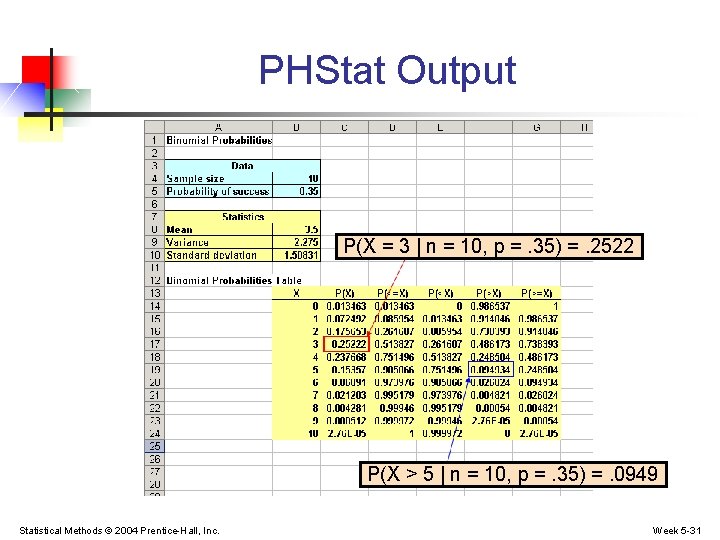
PHStat Output P(X = 3 | n = 10, p =. 35) =. 2522 P(X > 5 | n = 10, p =. 35) =. 0949 Statistical Methods © 2004 Prentice-Hall, Inc. Week 5 -31
The Hypergeometric Distribution Probability Distributions Discrete Probability Distributions Binomial Hypergeometric Poisson Statistical Methods © 2004 Prentice-Hall, Inc. Week 5 -32
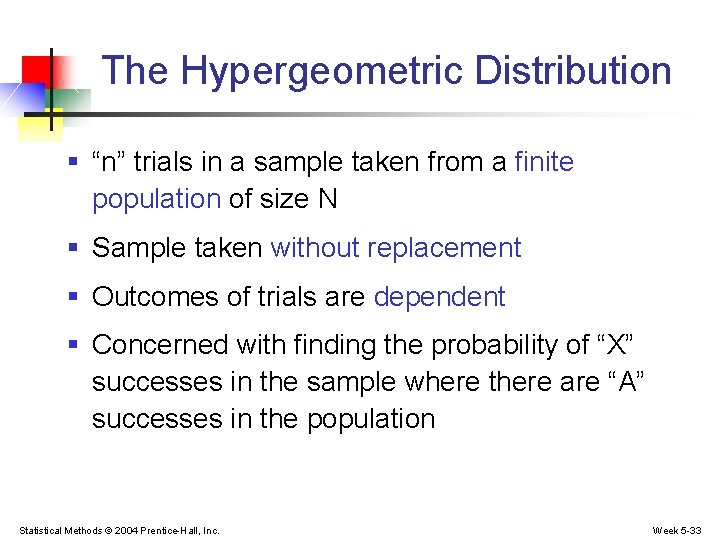
The Hypergeometric Distribution § “n” trials in a sample taken from a finite population of size N § Sample taken without replacement § Outcomes of trials are dependent § Concerned with finding the probability of “X” successes in the sample where there are “A” successes in the population Statistical Methods © 2004 Prentice-Hall, Inc. Week 5 -33
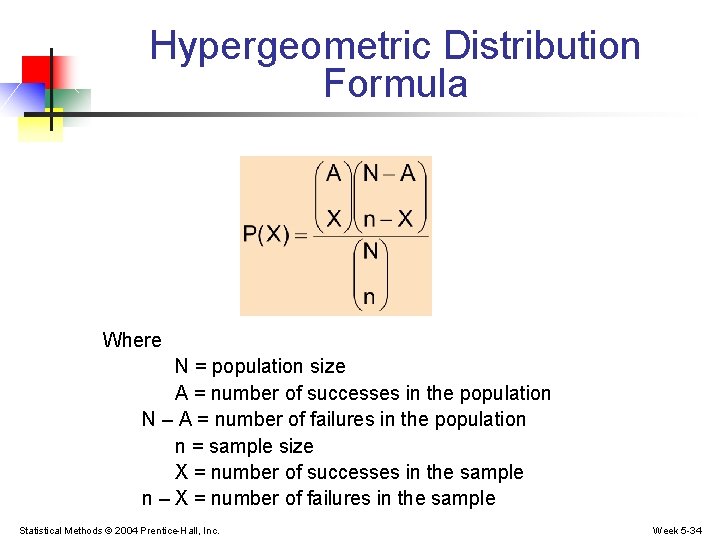
Hypergeometric Distribution Formula Where N = population size A = number of successes in the population N – A = number of failures in the population n = sample size X = number of successes in the sample n – X = number of failures in the sample Statistical Methods © 2004 Prentice-Hall, Inc. Week 5 -34
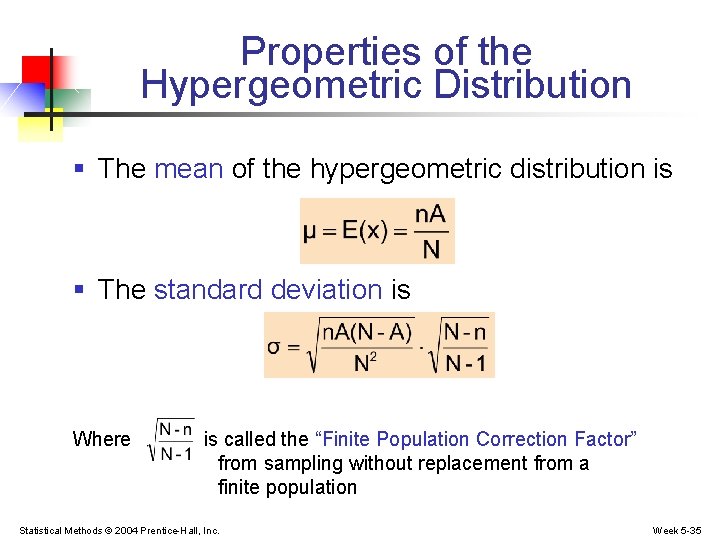
Properties of the Hypergeometric Distribution § The mean of the hypergeometric distribution is § The standard deviation is Where is called the “Finite Population Correction Factor” from sampling without replacement from a finite population Statistical Methods © 2004 Prentice-Hall, Inc. Week 5 -35
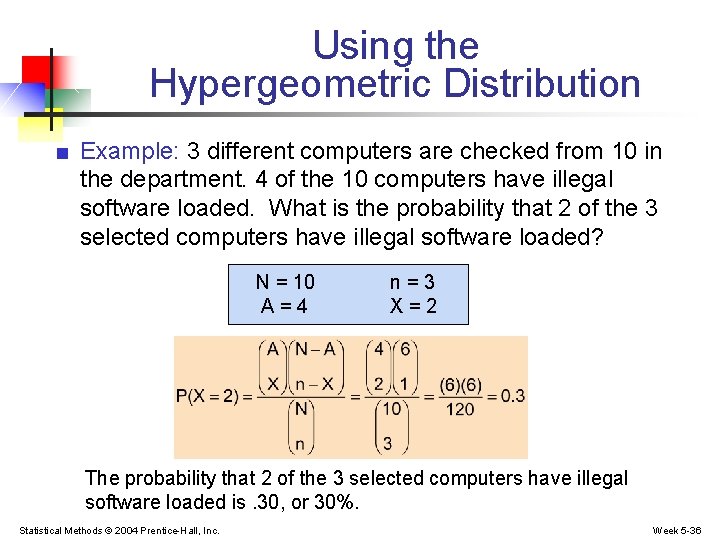
Using the Hypergeometric Distribution ■ Example: 3 different computers are checked from 10 in the department. 4 of the 10 computers have illegal software loaded. What is the probability that 2 of the 3 selected computers have illegal software loaded? N = 10 A=4 n=3 X=2 The probability that 2 of the 3 selected computers have illegal software loaded is. 30, or 30%. Statistical Methods © 2004 Prentice-Hall, Inc. Week 5 -36
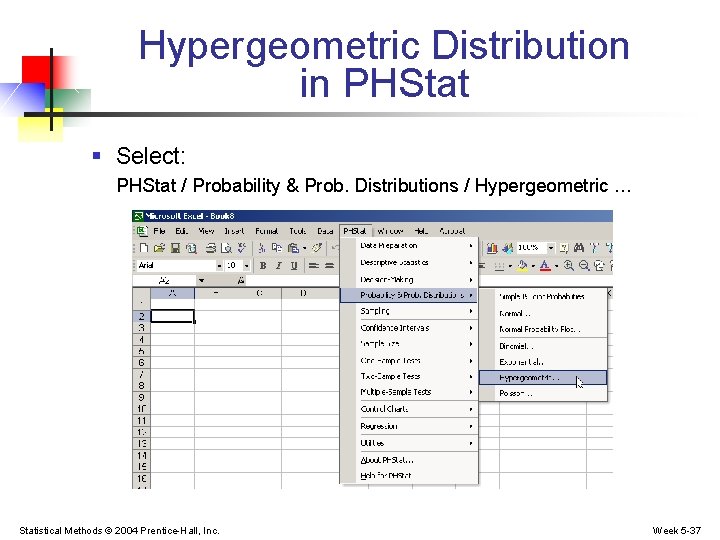
Hypergeometric Distribution in PHStat § Select: PHStat / Probability & Prob. Distributions / Hypergeometric … Statistical Methods © 2004 Prentice-Hall, Inc. Week 5 -37
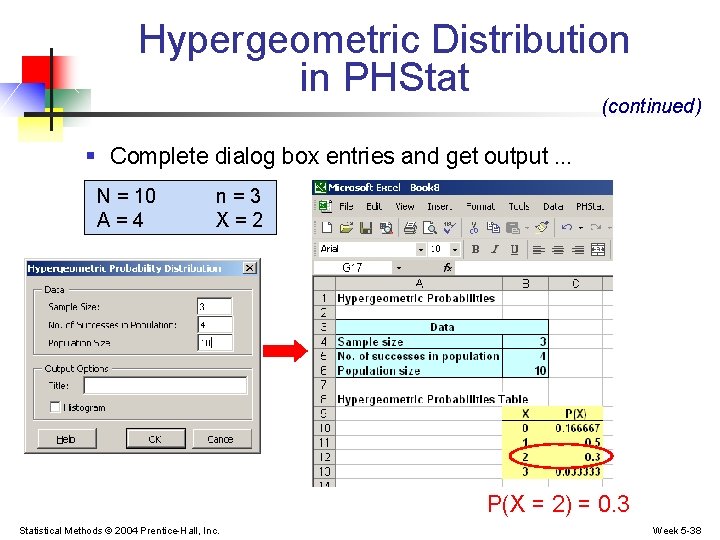
Hypergeometric Distribution in PHStat (continued) § Complete dialog box entries and get output … N = 10 A=4 n=3 X=2 P(X = 2) = 0. 3 Statistical Methods © 2004 Prentice-Hall, Inc. Week 5 -38
The Poisson Distribution Probability Distributions Discrete Probability Distributions Binomial Hypergeometric Poisson Statistical Methods © 2004 Prentice-Hall, Inc. Week 5 -39
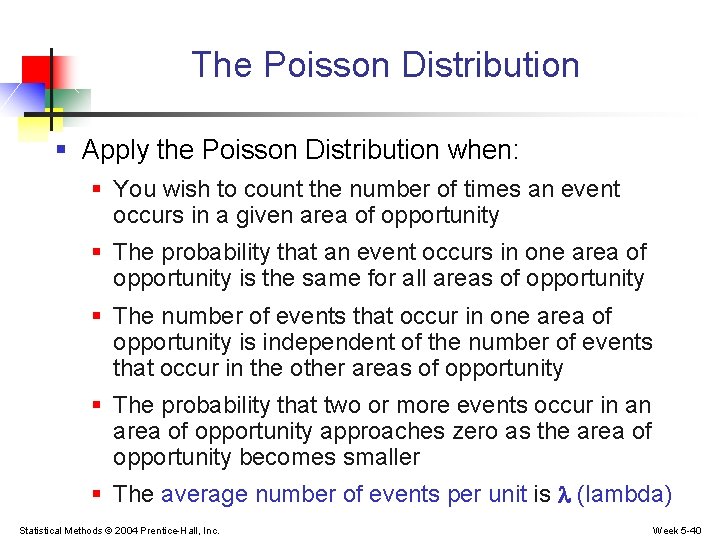
The Poisson Distribution § Apply the Poisson Distribution when: § You wish to count the number of times an event occurs in a given area of opportunity § The probability that an event occurs in one area of opportunity is the same for all areas of opportunity § The number of events that occur in one area of opportunity is independent of the number of events that occur in the other areas of opportunity § The probability that two or more events occur in an area of opportunity approaches zero as the area of opportunity becomes smaller § The average number of events per unit is (lambda) Statistical Methods © 2004 Prentice-Hall, Inc. Week 5 -40
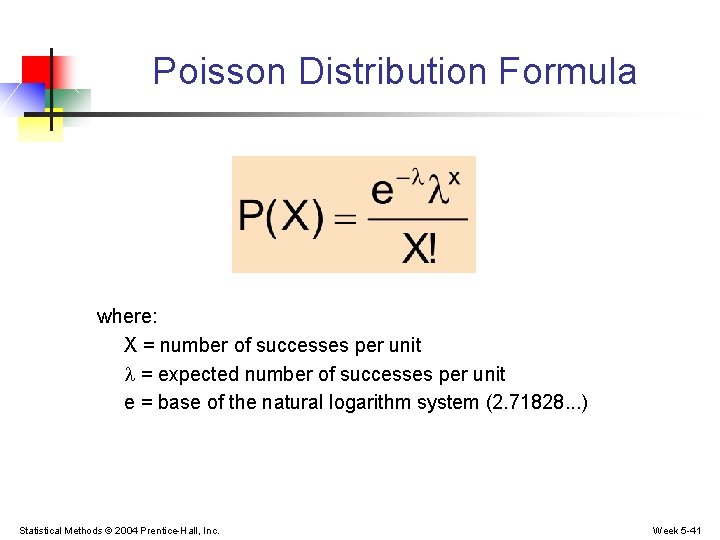
Poisson Distribution Formula where: X = number of successes per unit = expected number of successes per unit e = base of the natural logarithm system (2. 71828. . . ) Statistical Methods © 2004 Prentice-Hall, Inc. Week 5 -41
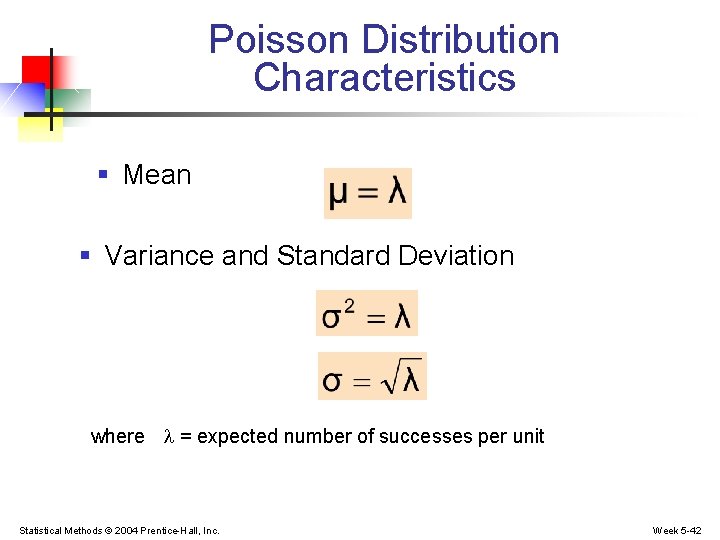
Poisson Distribution Characteristics § Mean § Variance and Standard Deviation where = expected number of successes per unit Statistical Methods © 2004 Prentice-Hall, Inc. Week 5 -42
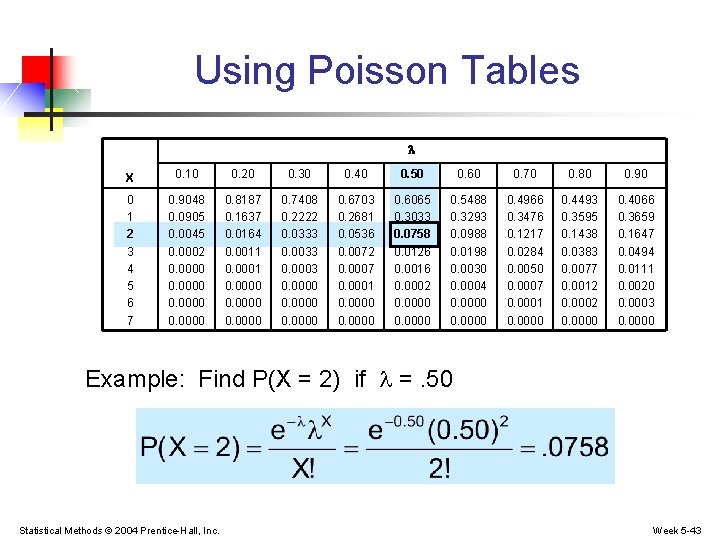
Using Poisson Tables X 0. 10 0. 20 0. 30 0. 40 0. 50 0. 60 0. 70 0. 80 0. 90 0 1 2 3 4 5 6 7 0. 9048 0. 0905 0. 0045 0. 0002 0. 0000 0. 8187 0. 1637 0. 0164 0. 0011 0. 0000 0. 7408 0. 2222 0. 0333 0. 0003 0. 0000 0. 6703 0. 2681 0. 0536 0. 0072 0. 0007 0. 0001 0. 0000 0. 6065 0. 3033 0. 0758 0. 0126 0. 0016 0. 0002 0. 0000 0. 5488 0. 3293 0. 0988 0. 0198 0. 0030 0. 0004 0. 0000 0. 4966 0. 3476 0. 1217 0. 0284 0. 0050 0. 0007 0. 0001 0. 0000 0. 4493 0. 3595 0. 1438 0. 0383 0. 0077 0. 0012 0. 0000 0. 4066 0. 3659 0. 1647 0. 0494 0. 0111 0. 0020 0. 0003 0. 0000 Example: Find P(X = 2) if =. 50 Statistical Methods © 2004 Prentice-Hall, Inc. Week 5 -43
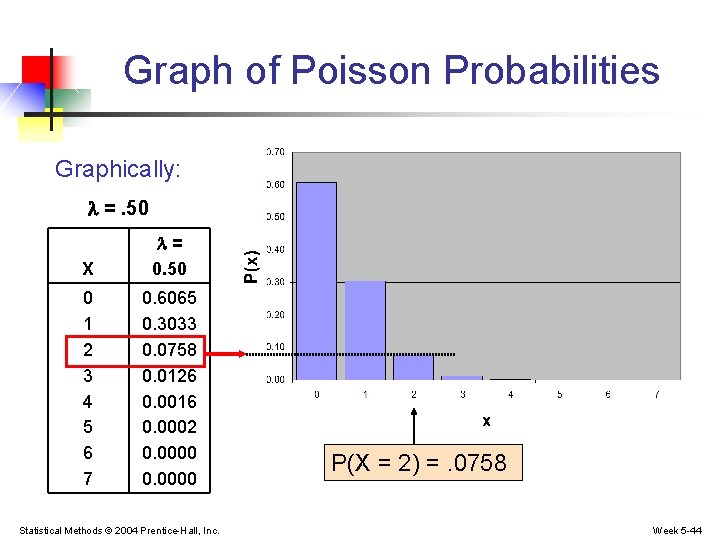
Graph of Poisson Probabilities Graphically: =. 50 X = 0. 50 0 1 2 3 4 5 6 7 0. 6065 0. 3033 0. 0758 0. 0126 0. 0016 0. 0002 0. 0000 Statistical Methods © 2004 Prentice-Hall, Inc. P(X = 2) =. 0758 Week 5 -44
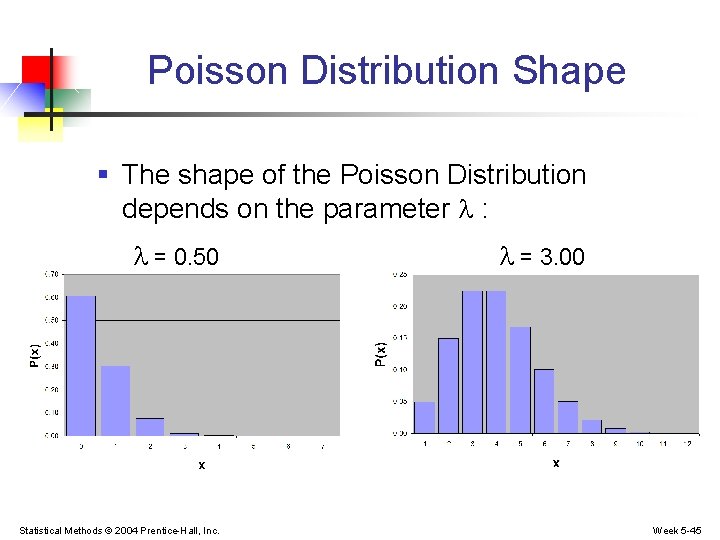
Poisson Distribution Shape § The shape of the Poisson Distribution depends on the parameter : = 0. 50 Statistical Methods © 2004 Prentice-Hall, Inc. = 3. 00 Week 5 -45
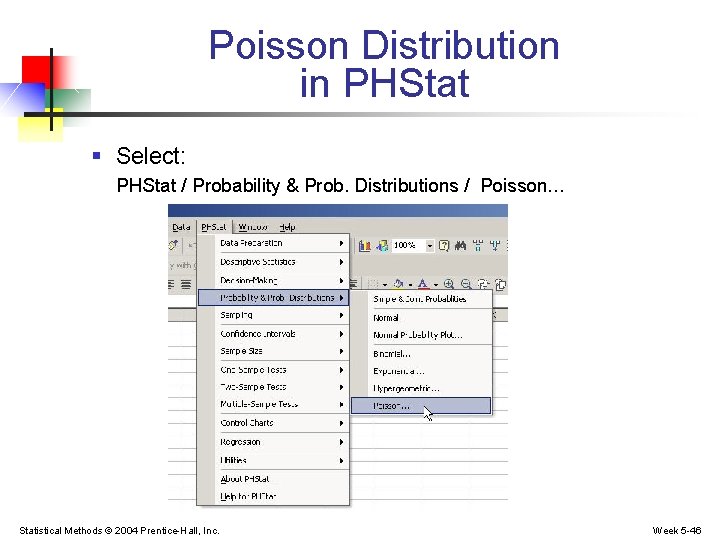
Poisson Distribution in PHStat § Select: PHStat / Probability & Prob. Distributions / Poisson… Statistical Methods © 2004 Prentice-Hall, Inc. Week 5 -46
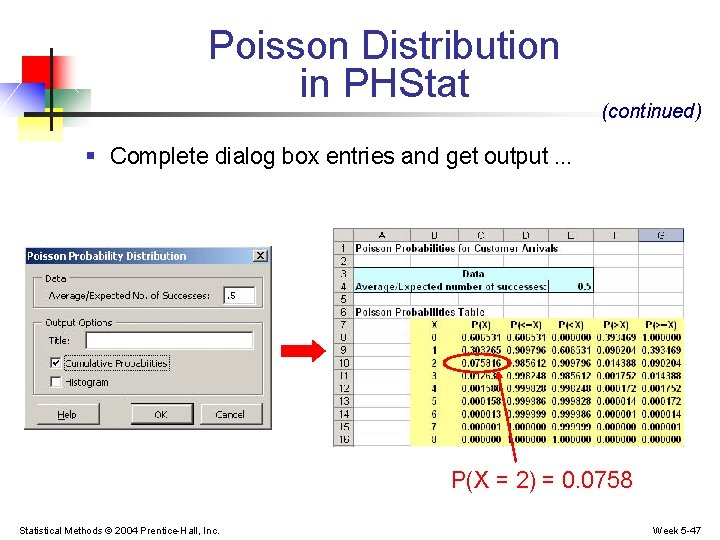
Poisson Distribution in PHStat (continued) § Complete dialog box entries and get output … P(X = 2) = 0. 0758 Statistical Methods © 2004 Prentice-Hall, Inc. Week 5 -47
Chapter Summary § Addressed the probability of a discrete random variable § Defined covariance and discussed its application in finance § Discussed the Binomial distribution § Discussed the Hypergeometric distribution § Reviewed the Poisson distribution Statistical Methods © 2004 Prentice-Hall, Inc. Week 5 -48
- Slides: 48