SelfGeneration Incentive Program 2017 Energy Storage Impact Evaluation





- Slides: 35
Self-Generation Incentive Program 2017 Energy Storage Impact Evaluation Findings October 22, 2018
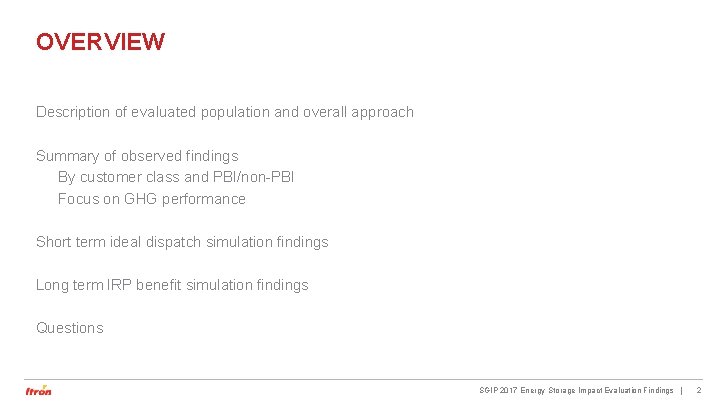
OVERVIEW Description of evaluated population and overall approach Summary of observed findings By customer class and PBI/non-PBI Focus on GHG performance Short term ideal dispatch simulation findings Long term IRP benefit simulation findings Questions SGIP 2017 Energy Storage Impact Evaluation Findings | 2
Evaluated Population and Approach
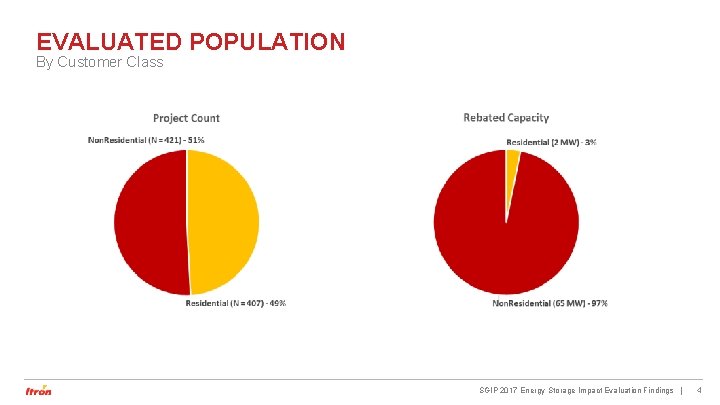
EVALUATED POPULATION By Customer Class SGIP 2017 Energy Storage Impact Evaluation Findings | 4
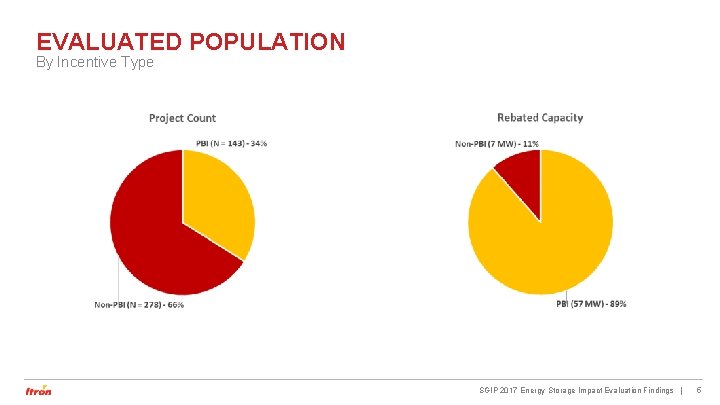
EVALUATED POPULATION By Incentive Type SGIP 2017 Energy Storage Impact Evaluation Findings | 5
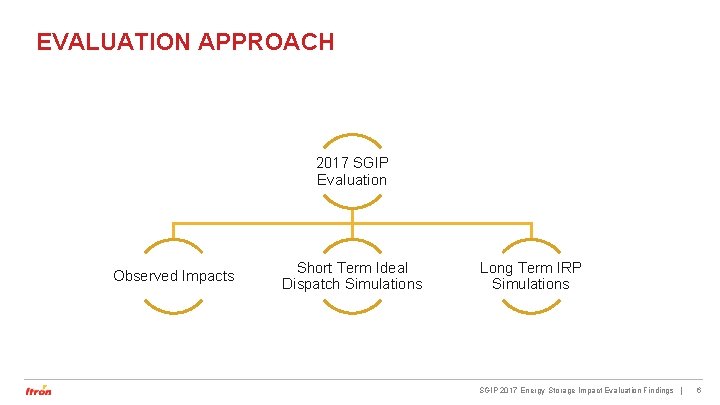
EVALUATION APPROACH 2017 SGIP Evaluation Observed Impacts Short Term Ideal Dispatch Simulations Long Term IRP Simulations SGIP 2017 Energy Storage Impact Evaluation Findings | 6
Summary of Observed Findings
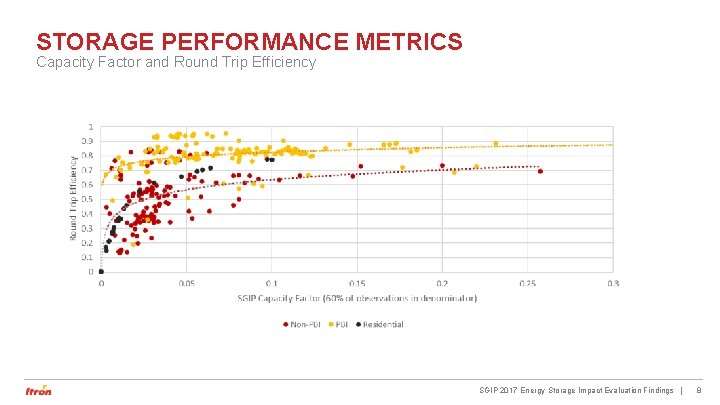
STORAGE PERFORMANCE METRICS Capacity Factor and Round Trip Efficiency SGIP 2017 Energy Storage Impact Evaluation Findings | 8
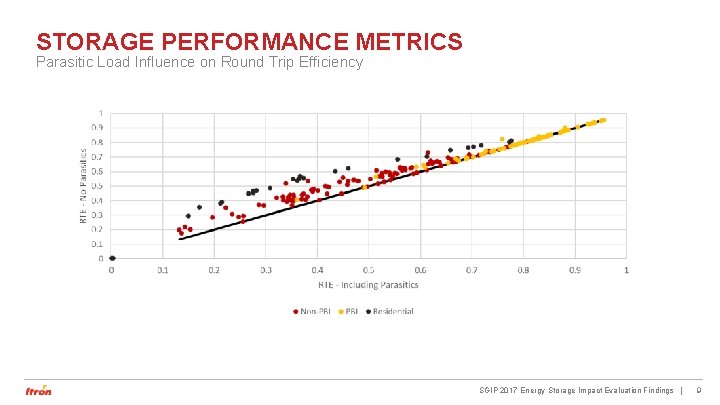
STORAGE PERFORMANCE METRICS Parasitic Load Influence on Round Trip Efficiency SGIP 2017 Energy Storage Impact Evaluation Findings | 9
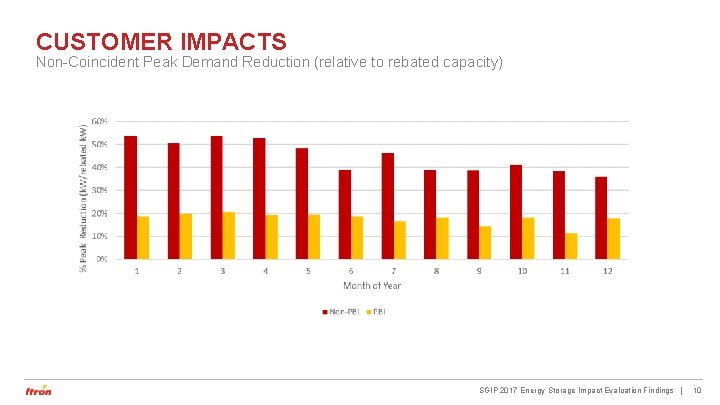
CUSTOMER IMPACTS Non-Coincident Peak Demand Reduction (relative to rebated capacity) SGIP 2017 Energy Storage Impact Evaluation Findings | 10
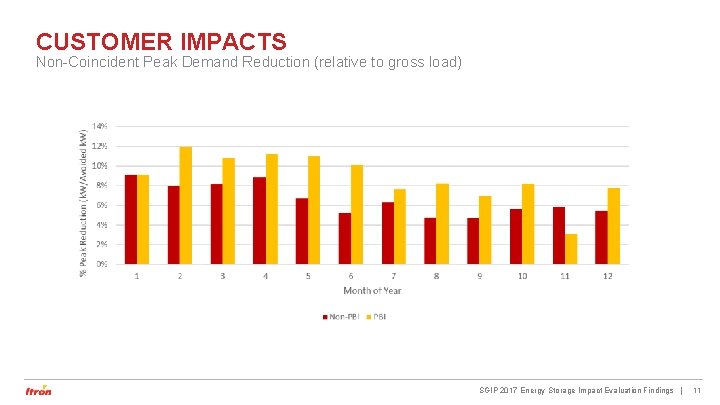
CUSTOMER IMPACTS Non-Coincident Peak Demand Reduction (relative to gross load) SGIP 2017 Energy Storage Impact Evaluation Findings | 11
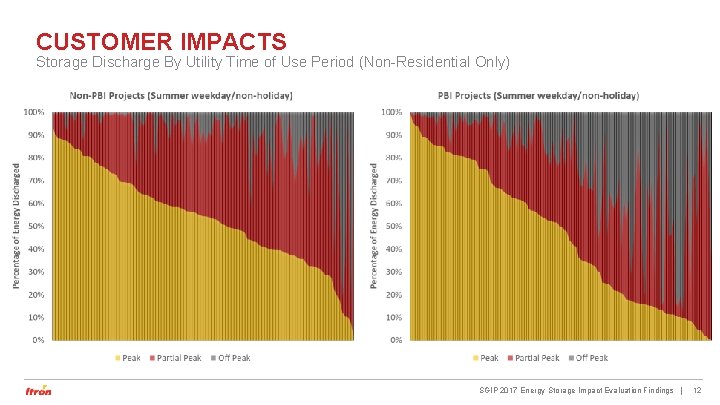
CUSTOMER IMPACTS Storage Discharge By Utility Time of Use Period (Non-Residential Only) SGIP 2017 Energy Storage Impact Evaluation Findings | 12
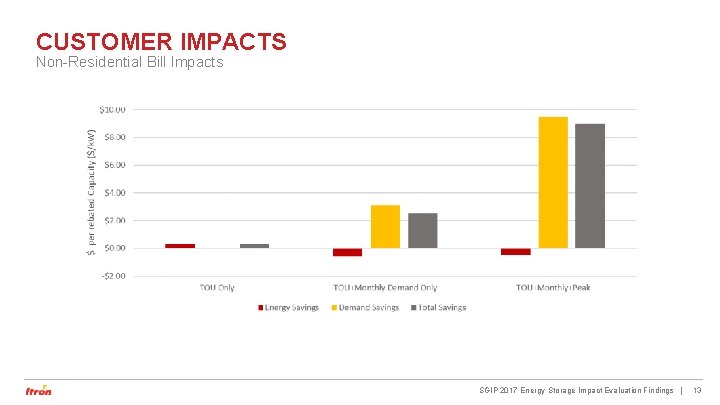
CUSTOMER IMPACTS Non-Residential Bill Impacts SGIP 2017 Energy Storage Impact Evaluation Findings | 13
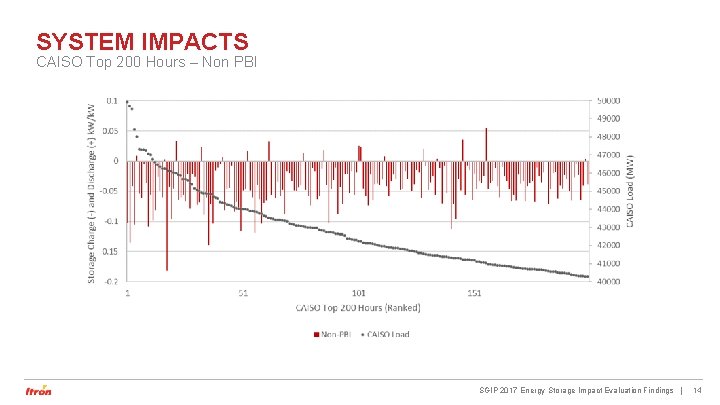
SYSTEM IMPACTS CAISO Top 200 Hours – Non PBI SGIP 2017 Energy Storage Impact Evaluation Findings | 14
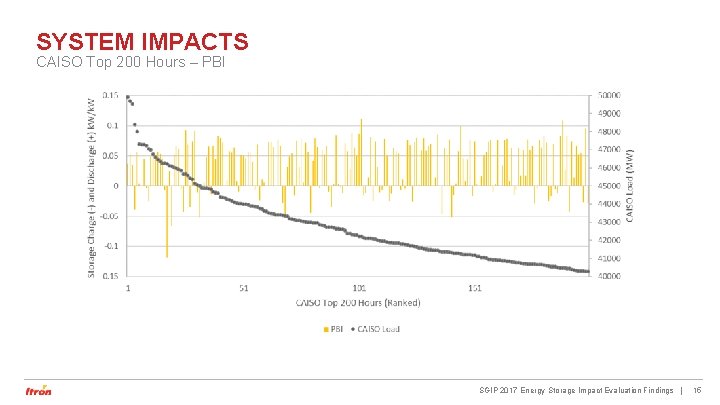
SYSTEM IMPACTS CAISO Top 200 Hours – PBI SGIP 2017 Energy Storage Impact Evaluation Findings | 15
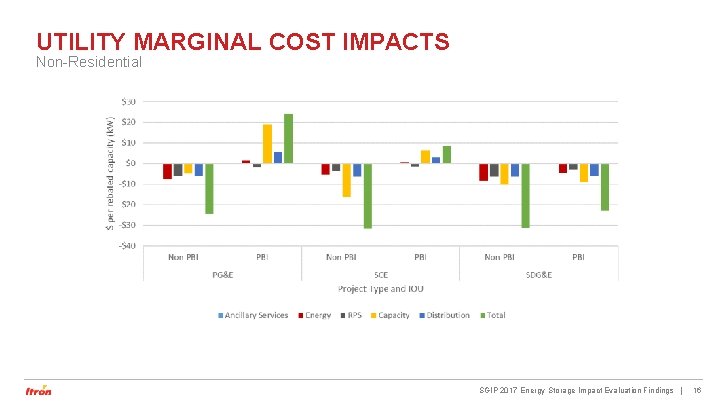
UTILITY MARGINAL COST IMPACTS Non-Residential SGIP 2017 Energy Storage Impact Evaluation Findings | 16
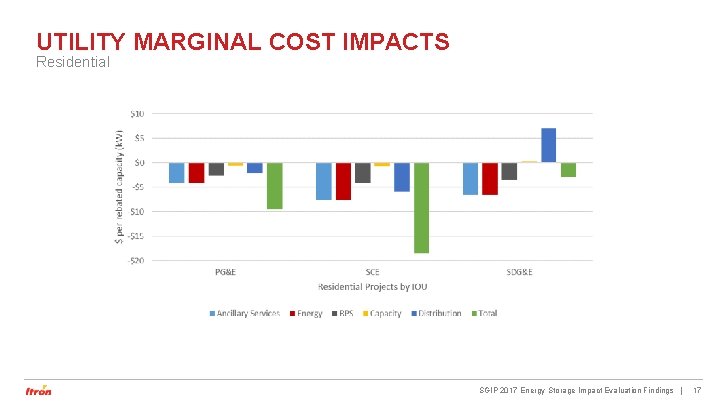
UTILITY MARGINAL COST IMPACTS Residential SGIP 2017 Energy Storage Impact Evaluation Findings | 17
GREENHOUSE GAS ANALYSIS Overview CPUC D. 16 -06 -007 (June 2016): “A single avoided cost model should apply to all distributed energy resource proceedings…” SGIP marginal greenhouse gas emission rates are derived from the latest version of the CPUC avoided cost calculator SGIP 2017 Energy Storage Impact Evaluation Findings | 18
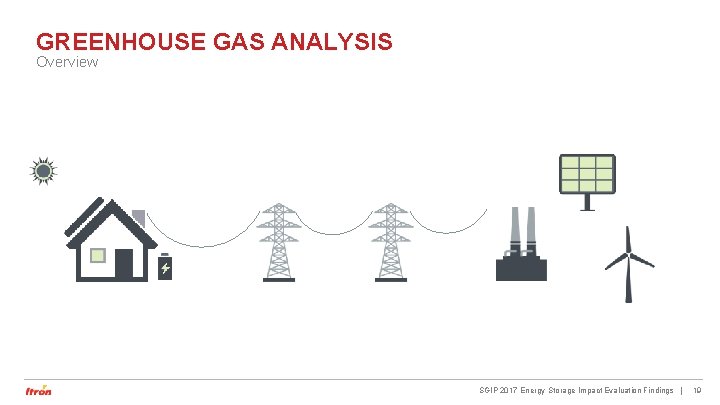
GREENHOUSE GAS ANALYSIS Overview SGIP 2017 Energy Storage Impact Evaluation Findings | 19
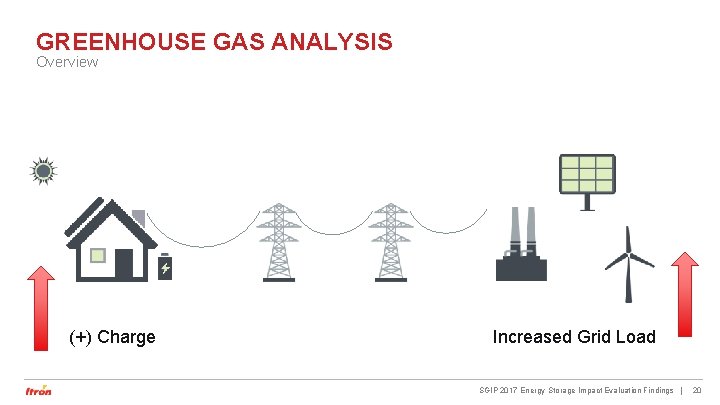
GREENHOUSE GAS ANALYSIS Overview (+) Charge Increased Grid Load SGIP 2017 Energy Storage Impact Evaluation Findings | 20
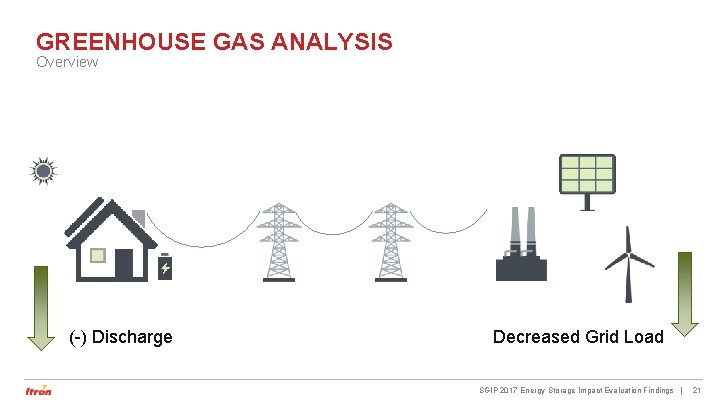
GREENHOUSE GAS ANALYSIS Overview (-) Discharge Decreased Grid Load SGIP 2017 Energy Storage Impact Evaluation Findings | 21
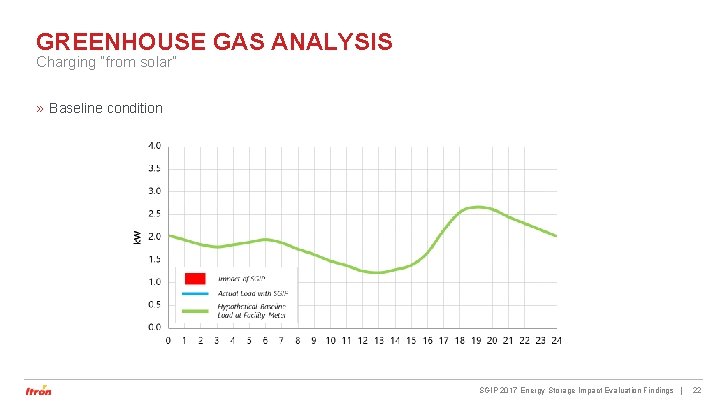
GREENHOUSE GAS ANALYSIS Charging “from solar” » Baseline condition SGIP 2017 Energy Storage Impact Evaluation Findings | 22
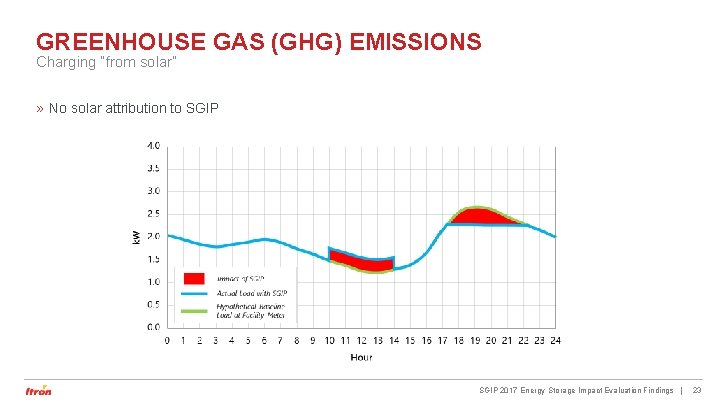
GREENHOUSE GAS (GHG) EMISSIONS Charging “from solar” » No solar attribution to SGIP 2017 Energy Storage Impact Evaluation Findings | 23
GREENHOUSE GAS (GHG) EMISSIONS Charging “from solar” » Solar attribution to SGIP - E. g. , solar installation would not proceed in the absence of SGIP 2017 Energy Storage Impact Evaluation Findings | 24
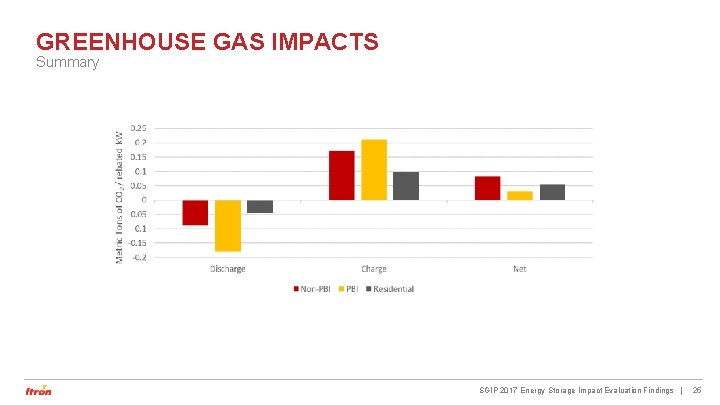
GREENHOUSE GAS IMPACTS Summary SGIP 2017 Energy Storage Impact Evaluation Findings | 25
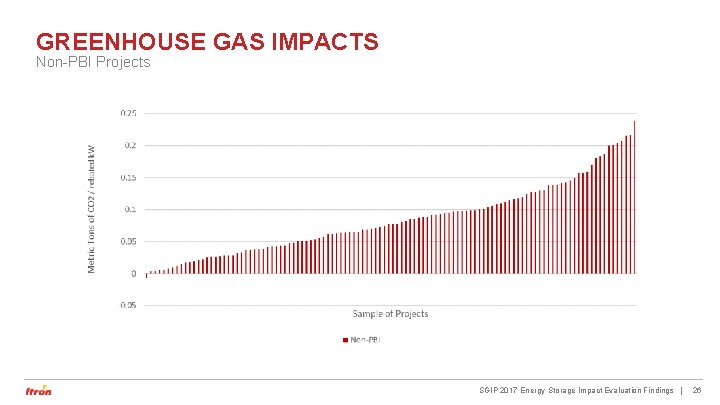
GREENHOUSE GAS IMPACTS Non-PBI Projects SGIP 2017 Energy Storage Impact Evaluation Findings | 26
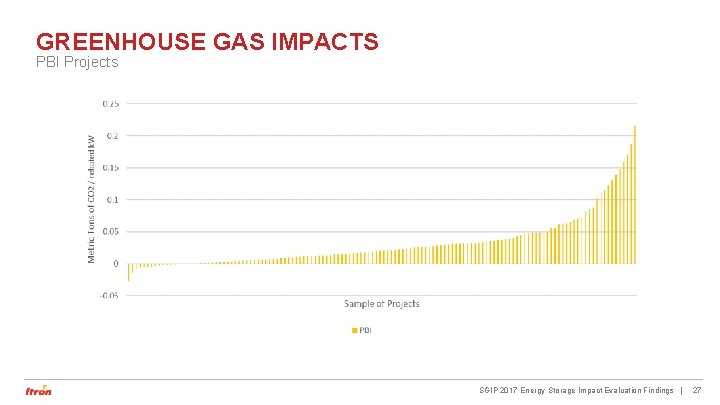
GREENHOUSE GAS IMPACTS PBI Projects SGIP 2017 Energy Storage Impact Evaluation Findings | 27
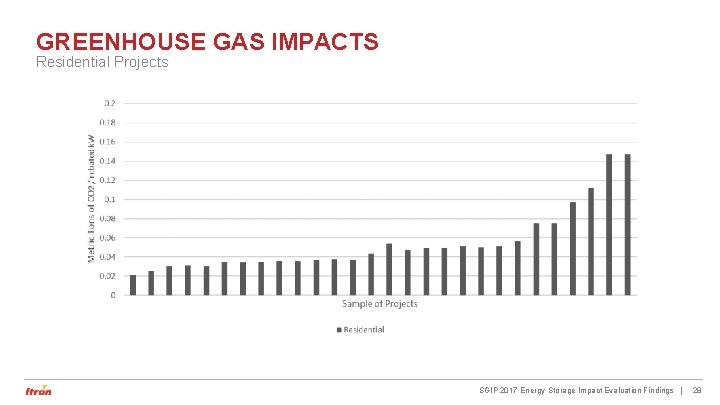
GREENHOUSE GAS IMPACTS Residential Projects SGIP 2017 Energy Storage Impact Evaluation Findings | 28
Simulated Dispatch Results
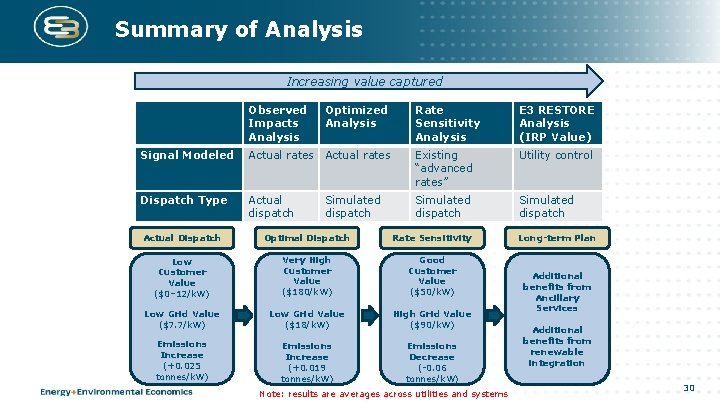
Summary of Analysis Increasing value captured Observed Impacts Analysis Optimized Analysis Rate Sensitivity Analysis E 3 RESTORE Analysis (IRP Value) Signal Modeled Actual rates Existing “advanced rates” Utility control Dispatch Type Actual dispatch Simulated dispatch Actual Dispatch Optimal Dispatch Rate Sensitivity Low Customer Value ($0– 12/k. W) Very High Customer Value ($180/k. W) Good Customer Value ($50/k. W) Low Grid Value ($7. 7/k. W) Low Grid Value ($18/k. W) High Grid Value ($90/k. W) Emissions Increase (+0. 025 tonnes/k. W) Emissions Increase (+0. 019 tonnes/k. W) Emissions Decrease (-0. 06 tonnes/k. W) Note: results are averages across utilities and systems Long-term Plan Additional benefits from Ancillary Services Additional benefits from renewable integration 30
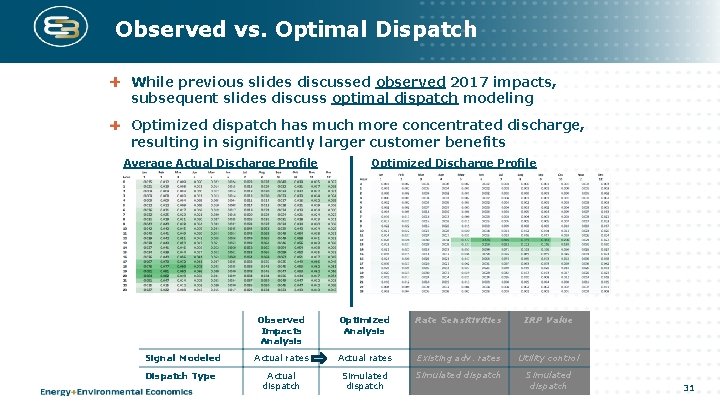
Observed vs. Optimal Dispatch While previous slides discussed observed 2017 impacts, subsequent slides discuss optimal dispatch modeling Optimized dispatch has much more concentrated discharge, resulting in significantly larger customer benefits Average Actual Discharge Profile Optimized Discharge Profile Observed Impacts Analysis Optimized Analysis Rate Sensitivities IRP Value Signal Modeled Actual rates Existing adv. rates Utility control Dispatch Type Actual dispatch Simulated dispatch 31
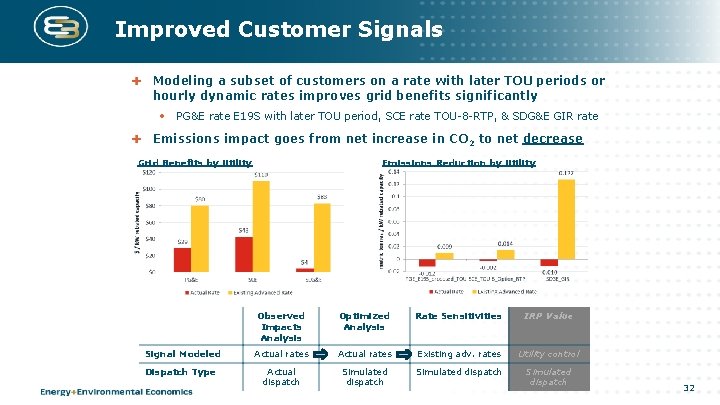
Improved Customer Signals Modeling a subset of customers on a rate with later TOU periods or hourly dynamic rates improves grid benefits significantly • PG&E rate E 19 S with later TOU period, SCE rate TOU-8 -RTP, & SDG&E GIR rate Emissions impact goes from net increase in CO 2 to net decrease Grid Benefits by Utility Emissions Reduction by Utility Observed Impacts Analysis Optimized Analysis Rate Sensitivities IRP Value Signal Modeled Actual rates Existing adv. rates Utility control Dispatch Type Actual dispatch Simulated dispatch 32
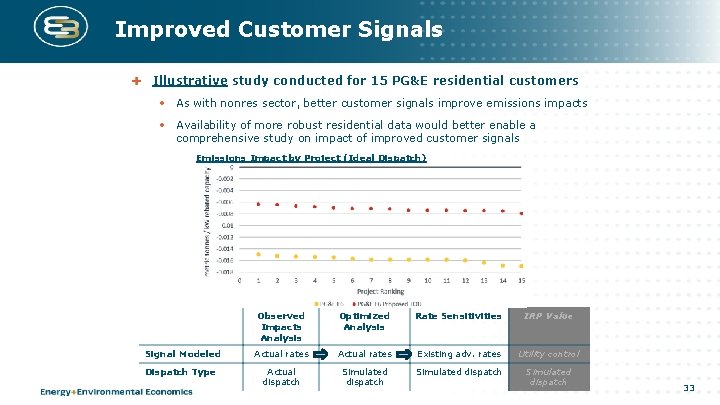
Improved Customer Signals Illustrative study conducted for 15 PG&E residential customers • As with nonres sector, better customer signals improve emissions impacts • Availability of more robust residential data would better enable a comprehensive study on impact of improved customer signals Emissions Impact by Project (Ideal Dispatch) Observed Impacts Analysis Optimized Analysis Rate Sensitivities IRP Value Signal Modeled Actual rates Existing adv. rates Utility control Dispatch Type Actual dispatch Simulated dispatch 33
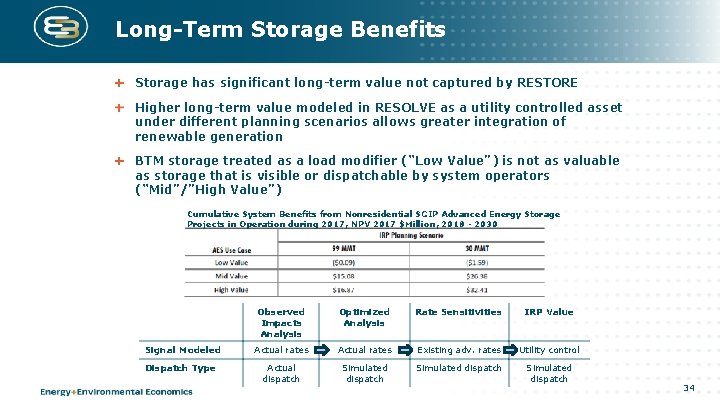
Long-Term Storage Benefits Storage has significant long-term value not captured by RESTORE Higher long-term value modeled in RESOLVE as a utility controlled asset under different planning scenarios allows greater integration of renewable generation BTM storage treated as a load modifier (“Low Value”) is not as valuable as storage that is visible or dispatchable by system operators (“Mid”/”High Value”) Cumulative System Benefits from Nonresidential SGIP Advanced Energy Storage Projects in Operation during 2017, NPV 2017 $Million, 2018 - 2030 Observed Impacts Analysis Optimized Analysis Rate Sensitivities IRP Value Signal Modeled Actual rates Existing adv. rates Utility control Dispatch Type Actual dispatch Simulated dispatch 34
THANK YOU www. itron. com