Road Safety Conference 2019 Measuring road harm Lucy


- Slides: 50
Road Safety Conference 2019 Measuring road harm Lucy Marstrand-Taussig Healthy Streets Adviser
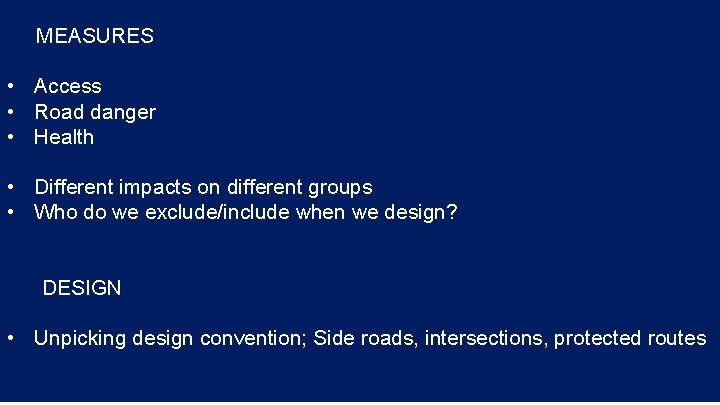
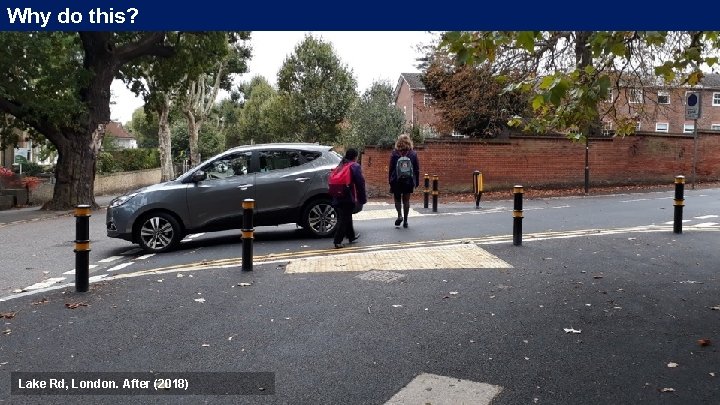
MEASURES • Access • Road danger • Health • Different impacts on different groups • Who do we exclude/include when we design? DESIGN • Unpicking design convention; Side roads, intersections, protected routes
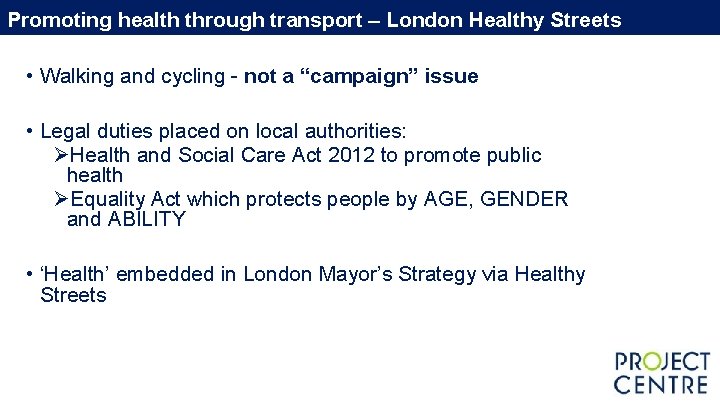
Promoting health through transport – London Healthy Streets • Walking and cycling - not a “campaign” issue • Legal duties placed on local authorities: ØHealth and Social Care Act 2012 to promote public health ØEquality Act which protects people by AGE, GENDER and ABILITY • ‘Health’ embedded in London Mayor’s Strategy via Healthy Streets
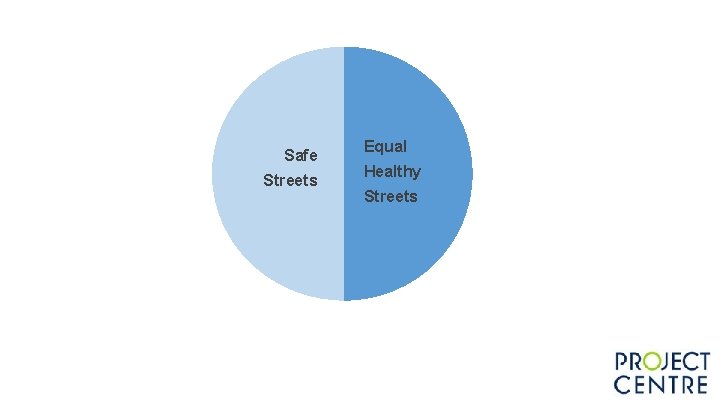
Safe Streets Equal Healthy Streets Equal Streets
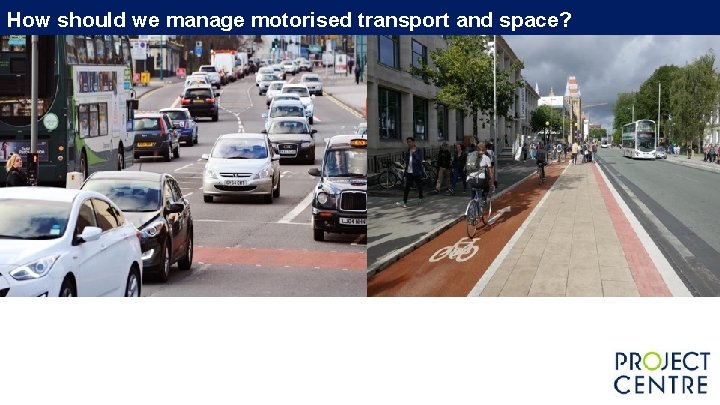
How should we manage motorised transport and space?
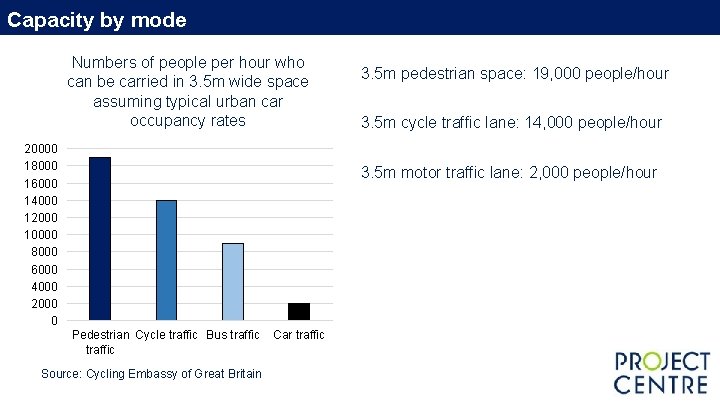
Capacity by mode Numbers of people per hour who can be carried in 3. 5 m wide space assuming typical urban car occupancy rates 20000 18000 16000 14000 12000 10000 8000 6000 4000 2000 0 3. 5 m pedestrian space: 19, 000 people/hour 3. 5 m cycle traffic lane: 14, 000 people/hour 3. 5 m motor traffic lane: 2, 000 people/hour Pedestrian Cycle traffic Bus traffic Source: Cycling Embassy of Great Britain Car traffic
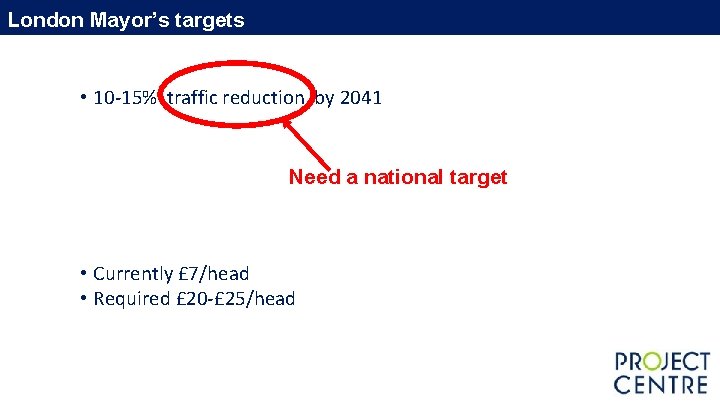
London Mayor’s targets • 10 -15% traffic reduction by 2041 Need a national target • Currently £ 7/head • Required £ 20 -£ 25/head
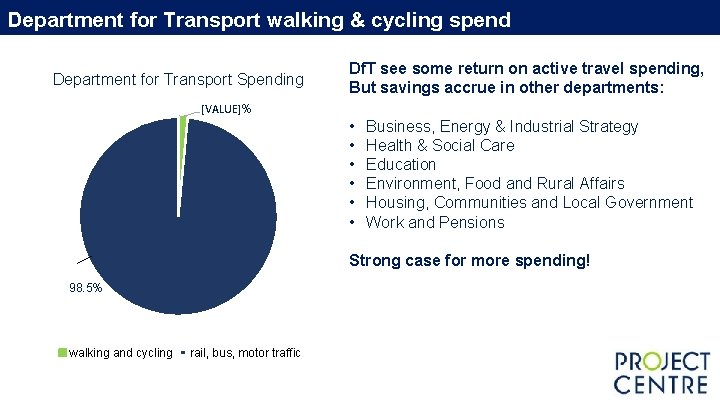
Department for Transport walking & cycling spend Department for Transport Spending Df. T see some return on active travel spending, But savings accrue in other departments: [VALUE]% • • • Business, Energy & Industrial Strategy Health & Social Care Education Environment, Food and Rural Affairs Housing, Communities and Local Government Work and Pensions Strong case for more spending! 98. 5% walking and cycling rail, bus, motor traffic
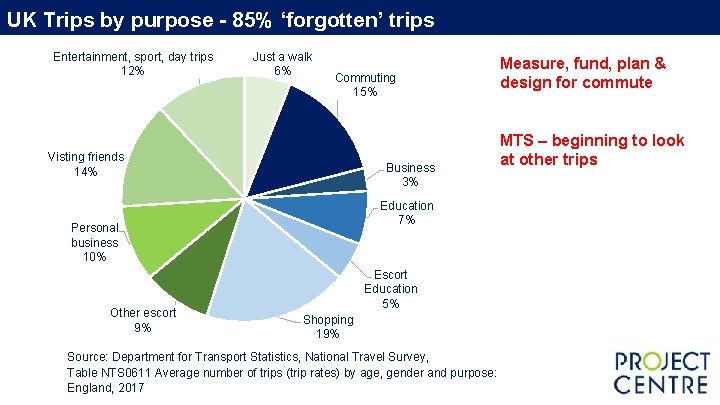
UK Trips by purpose - 85% ‘forgotten’ trips Entertainment, sport, day trips 12% Just a walk 6% Commuting 15% Visting friends 14% Business 3% Education 7% Personal business 10% Other escort 9% Escort Education 5% Shopping 19% Source: Department for Transport Statistics, National Travel Survey, Table NTS 0611 Average number of trips (trip rates) by age, gender and purpose: England, 2017 Measure, fund, plan & design for commute MTS – beginning to look at other trips
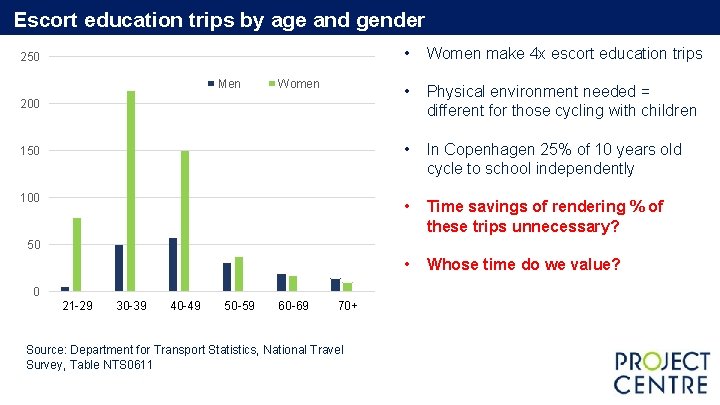
Escort education trips by age and gender 250 Men Women 200 150 100 • Women make 4 x escort education trips • Physical environment needed = different for those cycling with children • In Copenhagen 25% of 10 years old cycle to school independently • Time savings of rendering % of these trips unnecessary? • Whose time do we value? 50 0 21 -29 30 -39 40 -49 50 -59 60 -69 70+ Source: Department for Transport Statistics, National Travel Survey, Table NTS 0611
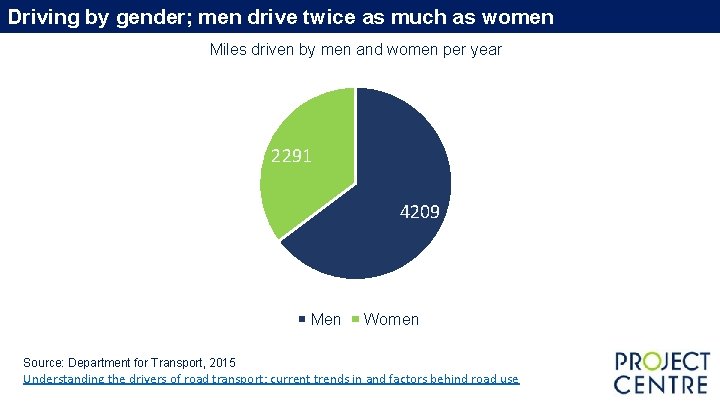
Driving by gender; men drive twice as much as women Miles driven by men and women per year 2291 4209 Men Women Source: Department for Transport, 2015 Understanding the drivers of road transport: current trends in and factors behind road use
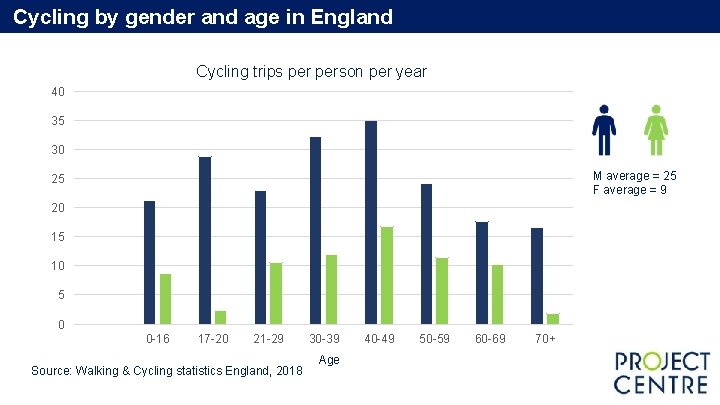
Cycling by gender and age in England Cycling trips person per year 40 35 30 M average = 25 F average = 9 25 20 15 10 5 0 0 -16 17 -20 21 -29 Source: Walking & Cycling statistics England, 2018 30 -39 Age 40 -49 50 -59 60 -69 70+
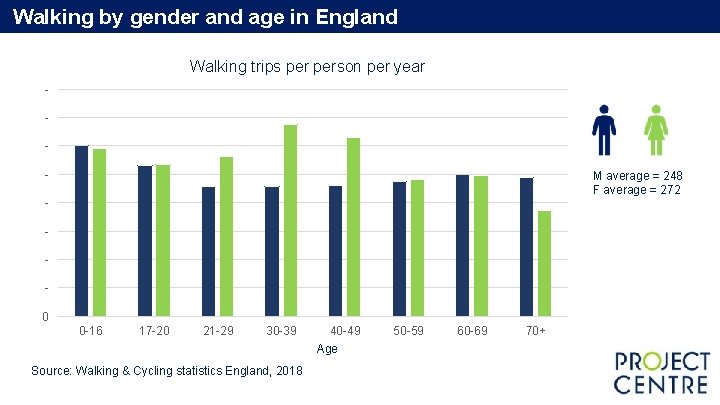
Walking by gender and age in England Walking trips person per year - M average = 248 F average = 272 0 0 -16 17 -20 21 -29 30 -39 40 -49 Age Source: Walking & Cycling statistics England, 2018 50 -59 60 -69 70+
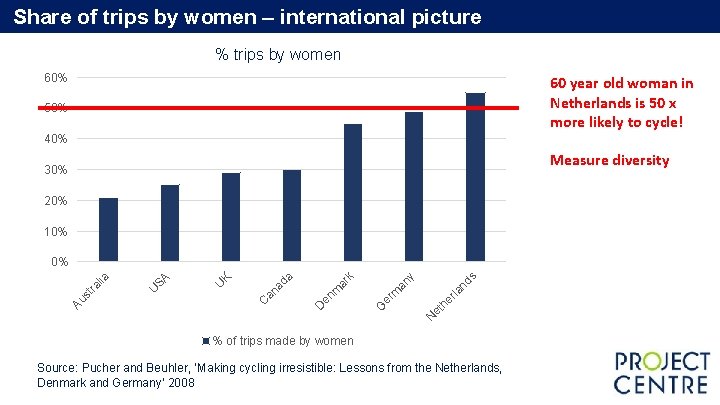
Share of trips by women – international picture % trips by women 60% 60 year old woman in Netherlands is 50 x more likely to cycle! 50% 40% Measure diversity 30% 20% 10% s N et he rla nd y er m G m en D an an ar k a ad K SA U U C Au st ra lia 0% % of trips made by women Source: Pucher and Beuhler, ‘Making cycling irresistible: Lessons from the Netherlands, Denmark and Germany’ 2008
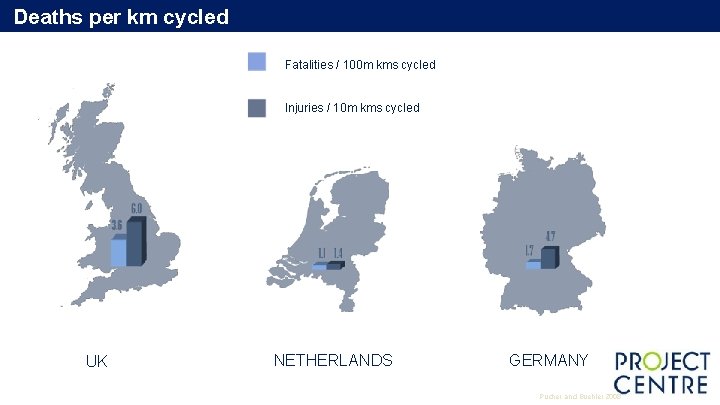
Deaths per km cycled Fatalities / 100 m kms cycled Injuries / 10 m kms cycled UK NETHERLANDS GERMANY Pucher and Buehler, 2008
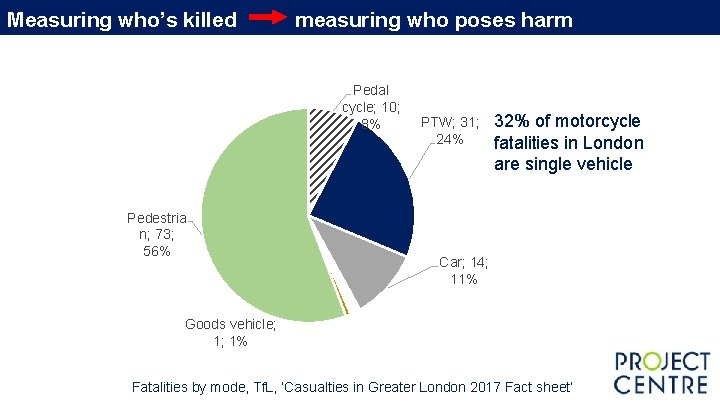
Measuring who’s killed measuring who poses harm Pedal cycle; 10; 8% Pedestria n; 73; 56% PTW; 31; 24% 32% of motorcycle fatalities in London are single vehicle Car; 14; 11% Goods vehicle; 1; 1% Fatalities by mode, Tf. L, ‘Casualties in Greater London 2017 Fact sheet’
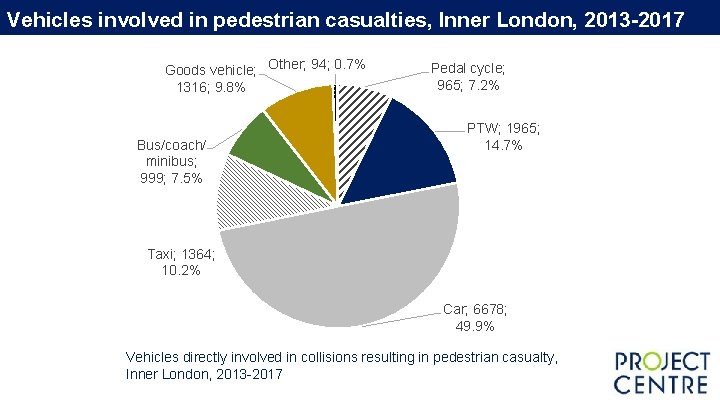
Vehicles involved in pedestrian casualties, Inner London, 2013 -2017 Goods vehicle; Other; 94; 0. 7% 1316; 9. 8% Bus/coach/ minibus; 999; 7. 5% Pedal cycle; 965; 7. 2% PTW; 1965; 14. 7% Taxi; 1364; 10. 2% Car; 6678; 49. 9% Vehicles directly involved in collisions resulting in pedestrian casualty, Inner London, 2013 -2017
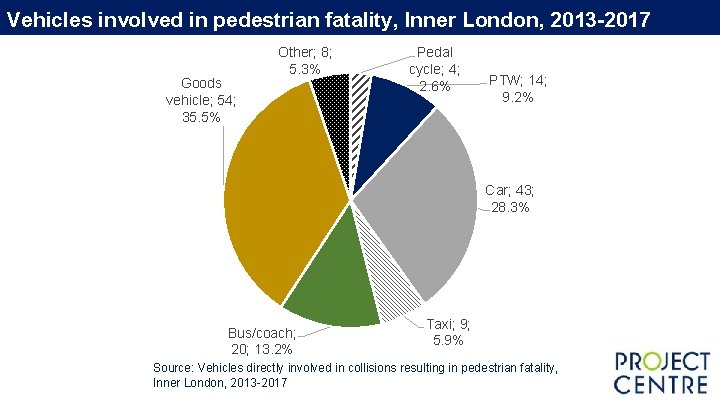
Vehicles involved in pedestrian fatality, Inner London, 2013 -2017 Goods vehicle; 54; 35. 5% Other; 8; 5. 3% Pedal cycle; 4; 2. 6% PTW; 14; 9. 2% Car; 43; 28. 3% Bus/coach; 20; 13. 2% Taxi; 9; 5. 9% Source: Vehicles directly involved in collisions resulting in pedestrian fatality, Inner London, 2013 -2017
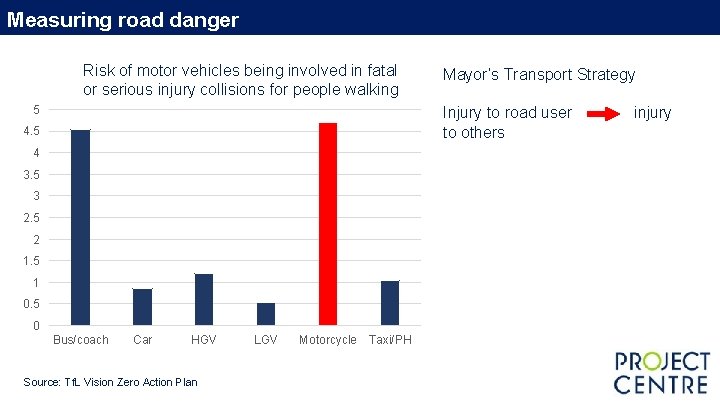
Measuring road danger Risk of motor vehicles being involved in fatal or serious injury collisions for people walking 5 Mayor’s Transport Strategy Injury to road user to others 4. 5 4 3. 5 3 2. 5 2 1. 5 1 0. 5 0 Bus/coach Car HGV Source: Tf. L Vision Zero Action Plan LGV Motorcycle Taxi/PH injury
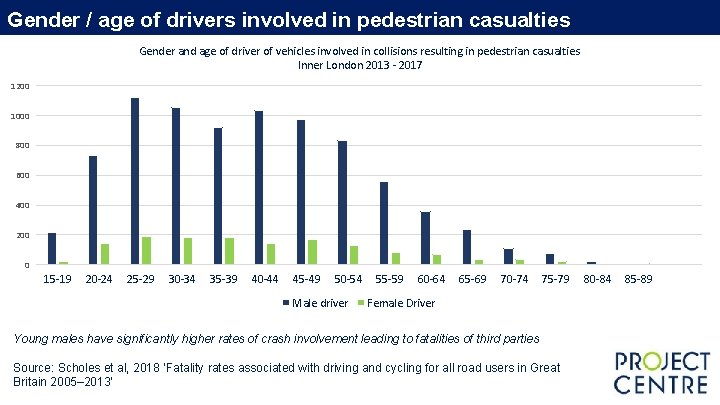
Gender / age of drivers involved in pedestrian casualties Gender and age of driver of vehicles involved in collisions resulting in pedestrian casualties Inner London 2013 - 2017 1200 1000 800 600 400 200 0 15 -19 20 -24 25 -29 30 -34 35 -39 40 -44 45 -49 50 -54 Male driver 55 -59 60 -64 65 -69 70 -74 75 -79 Female Driver Young males have significantly higher rates of crash involvement leading to fatalities of third parties Source: Scholes et al, 2018 ‘Fatality rates associated with driving and cycling for all road users in Great Britain 2005– 2013’ 80 -84 85 -89
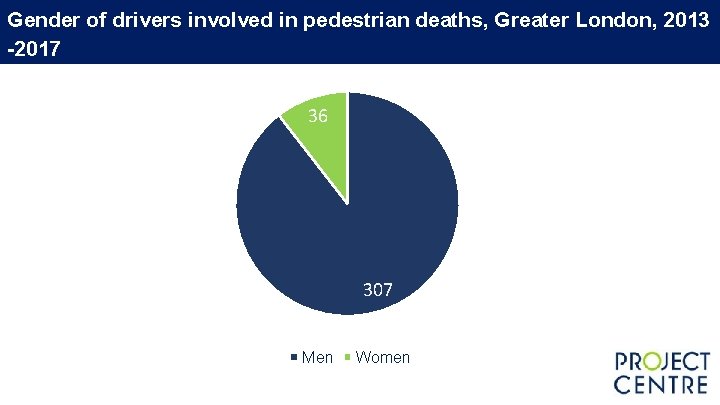
Gender of drivers involved in pedestrian deaths, Greater London, 2013 -2017 36 307 Men Women
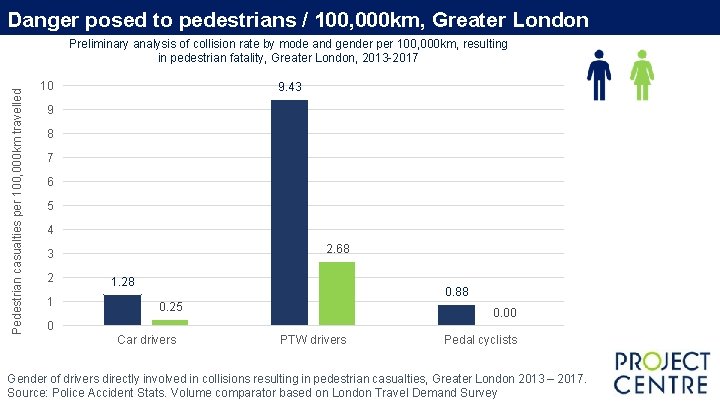
Danger posed to pedestrians / 100, 000 km, Greater London Pedestrian casualties per 100, 000 km travelled Preliminary analysis of collision rate by mode and gender per 100, 000 km, resulting in pedestrian fatality, Greater London, 2013 -2017 10 9. 43 9 8 7 6 5 4 2. 68 3 2 1 1. 28 0. 88 0. 25 0. 00 0 Car drivers PTW drivers Pedal cyclists Gender of drivers directly involved in collisions resulting in pedestrian casualties, Greater London 2013 – 2017. Source: Police Accident Stats. Volume comparator based on London Travel Demand Survey
Danger posed to pedestrians / km, London – prelim analysis Inner London PTW = 10 x more harm than car drivers PTW = 14 x more harm than pedal cyclists Car drivers (Greater London) Males pose 5 x more harm than females Suggests behaviour plays role
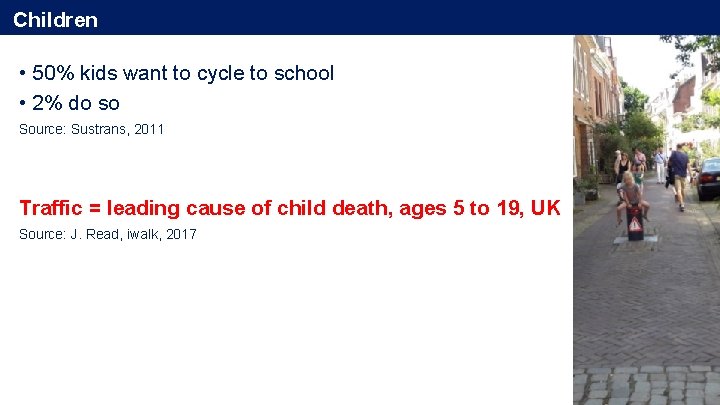
Children • 50% kids want to cycle to school • 2% do so Source: Sustrans, 2011 Traffic = leading cause of child death, ages 5 to 19, UK Source: J. Read, iwalk, 2017
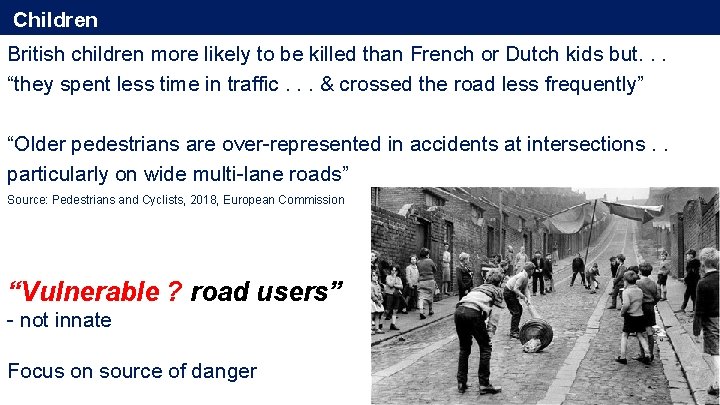
Children British children more likely to be killed than French or Dutch kids but. . . “they spent less time in traffic. . . & crossed the road less frequently” “Older pedestrians are over-represented in accidents at intersections. . particularly on wide multi-lane roads” Source: Pedestrians and Cyclists, 2018, European Commission “Vulnerable ? road users” - not innate Focus on source of danger
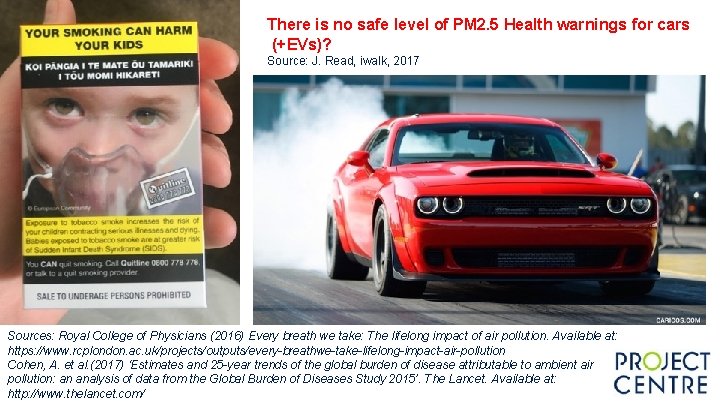
There is no safe level of PM 2. 5 Health warnings for cars (+EVs)? Source: J. Read, iwalk, 2017 Sources: Royal College of Physicians (2016) Every breath we take: The lifelong impact of air pollution. Available at: https: //www. rcplondon. ac. uk/projects/outputs/every-breathwe-take-lifelong-impact-air-pollution Cohen, A. et al. (2017) ‘Estimates and 25 -year trends of the global burden of disease attributable to ambient air pollution: an analysis of data from the Global Burden of Diseases Study 2015’. The Lancet. Available at: http: //www. thelancet. com/
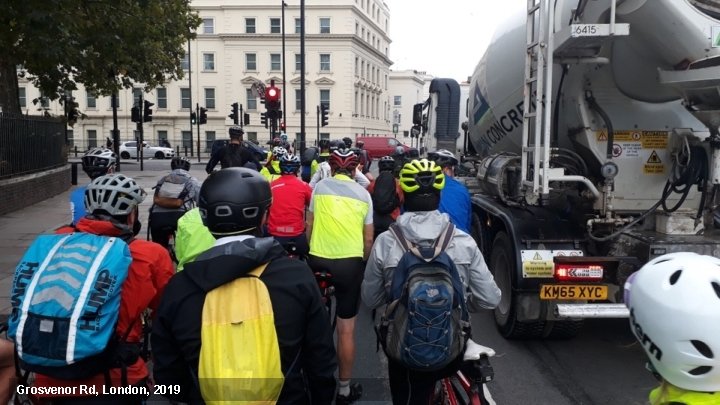
Grosvenor Rd, London, 2019
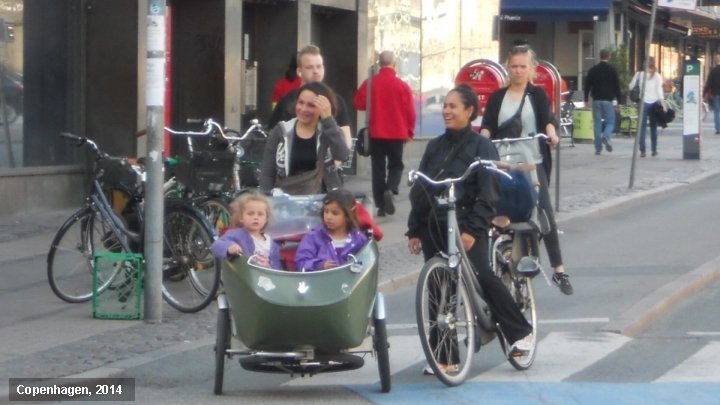
Copenhagen, 2014
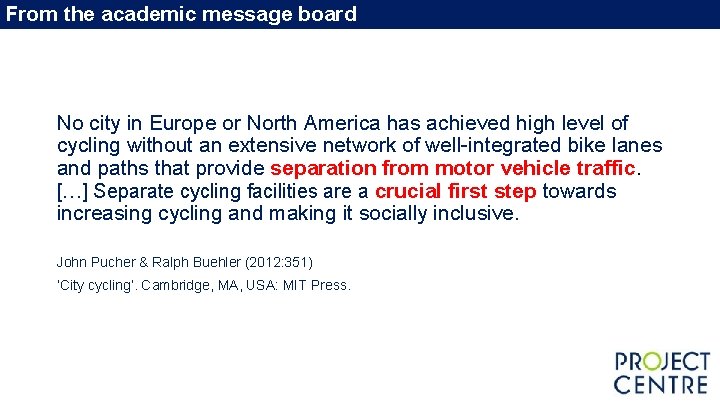
From the academic message board No city in Europe or North America has achieved high level of cycling without an extensive network of well-integrated bike lanes and paths that provide separation from motor vehicle traffic. […] Separate cycling facilities are a crucial first step towards increasing cycling and making it socially inclusive. John Pucher & Ralph Buehler (2012: 351) ‘City cycling’. Cambridge, MA, USA: MIT Press.
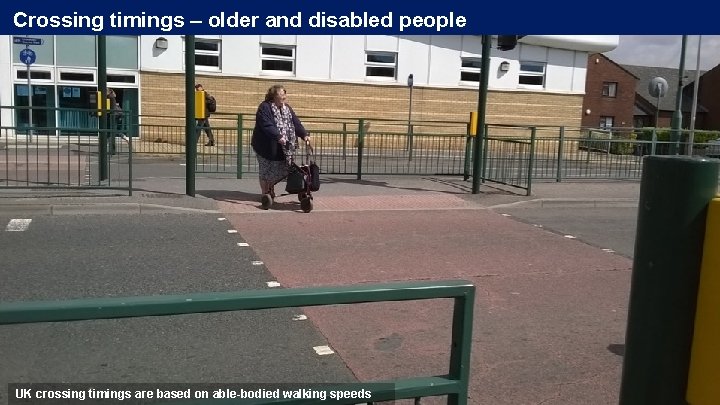
Crossing timings – older and disabled people UK crossing timings are based on able-bodied walking speeds
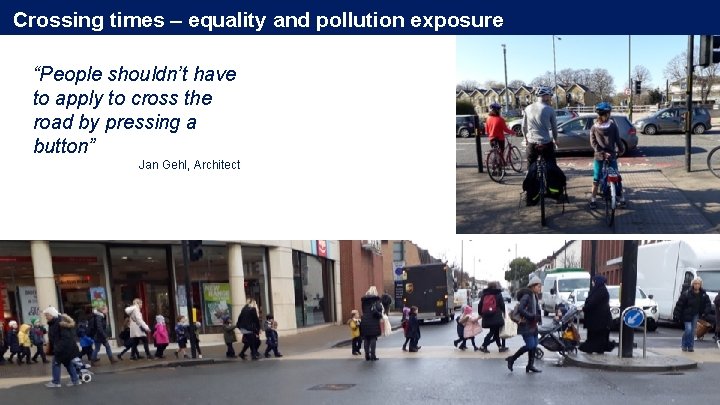
Crossing times – equality and pollution exposure “People shouldn’t have to apply to cross the road by pressing a button” Jan Gehl, Architect
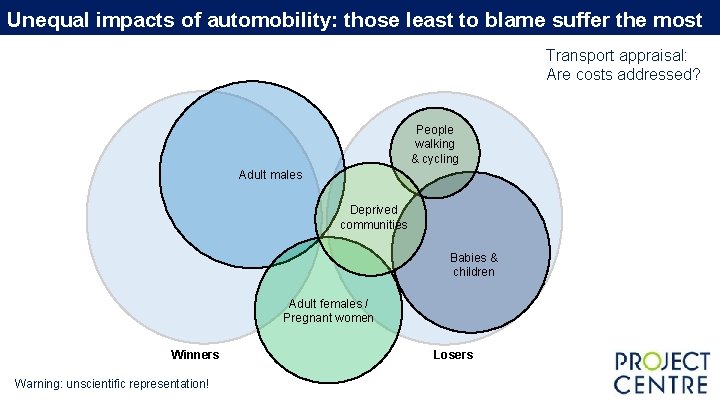
Unequal impacts of automobility: those least to blame suffer the most Transport appraisal: Are costs addressed? People walking & cycling Adult males Deprived communities Babies & children Adult females / Pregnant women Winners Warning: unscientific representation! Losers
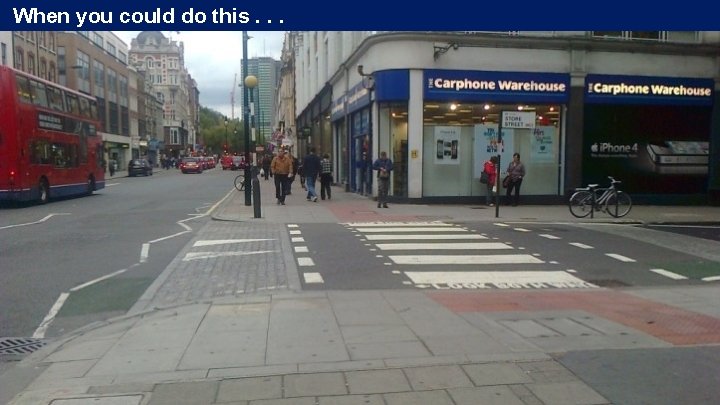
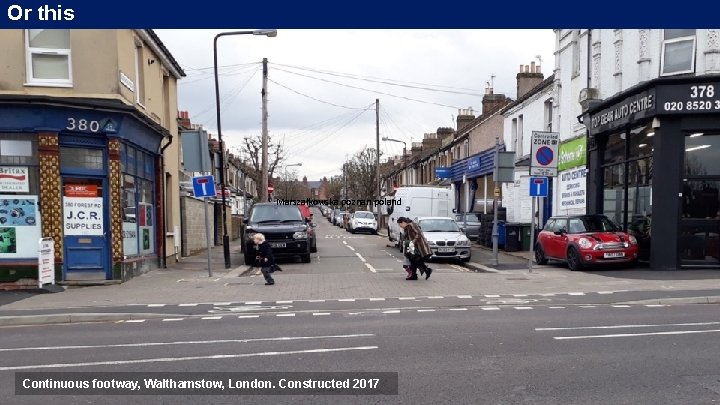
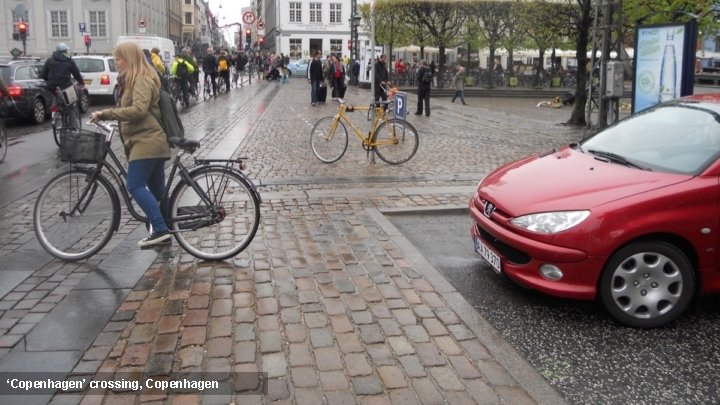
DESIGN Side roads Refuges Roundabouts Centre lines
Why do this? Lake Rd, London. After (2018)
When you could do this. . .
Or this Marszałkowska poznan poland Continuous footway, Walthamstow, London. Constructed 2017
‘Copenhagen’ crossing, Copenhagen
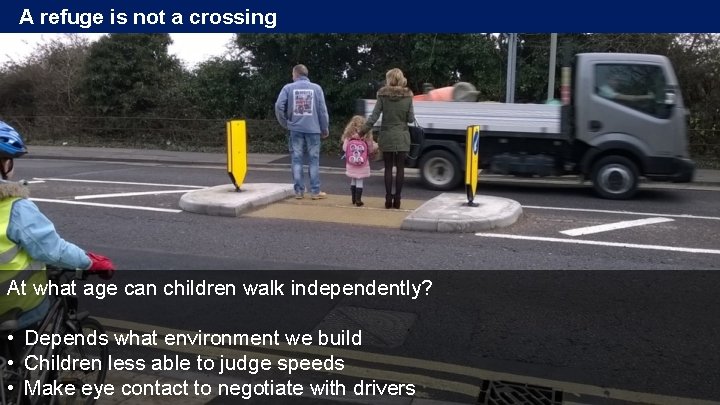
A refuge is not a crossing At what age can children walk independently? • Depends what environment we build • Children less able to judge speeds • Make eye contact to negotiate with drivers
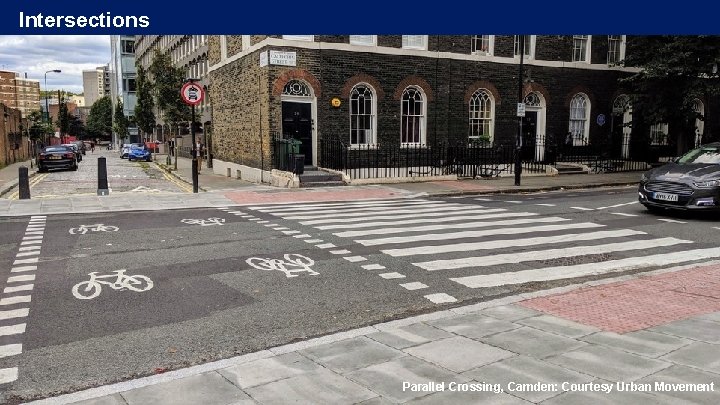
Intersections Parallel Crossing, Camden: Courtesy Urban Movement
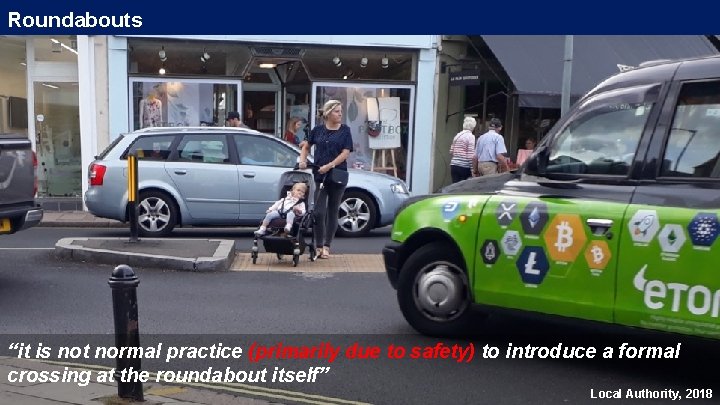
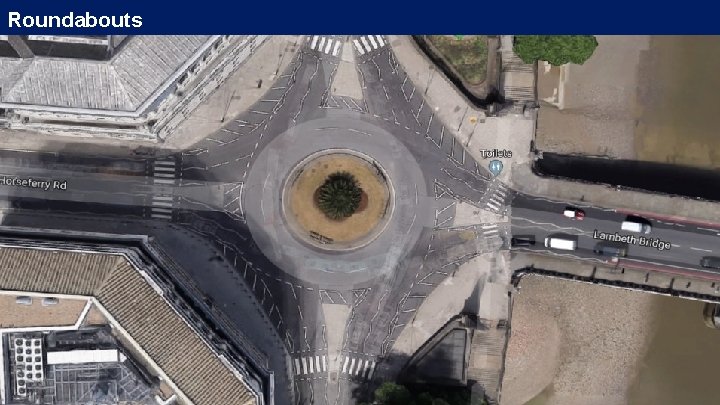
Roundabouts “it is not normal practice (primarily due to safety) to introduce a formal crossing at the roundabout itself” Local Authority, 2018
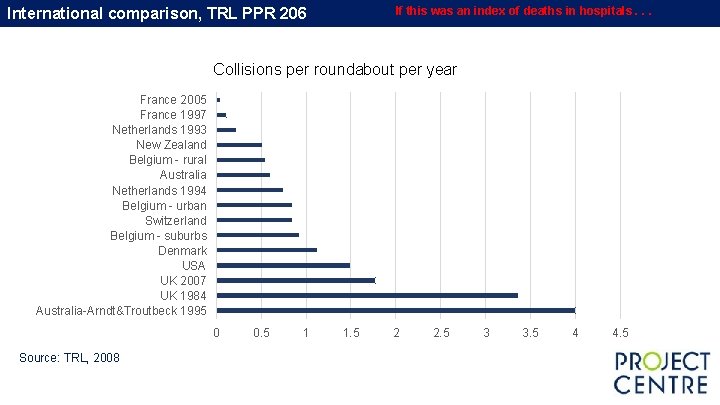
If this was an index of deaths in hospitals. . . International comparison, TRL PPR 206 Collisions per roundabout per year France 2005 France 1997 Netherlands 1993 New Zealand Belgium - rural Australia Netherlands 1994 Belgium - urban Switzerland Belgium - suburbs Denmark USA UK 2007 UK 1984 Australia-Arndt&Troutbeck 1995 0 Source: TRL, 2008 0. 5 1 1. 5 2 2. 5 3 3. 5 4 4. 5
Roundabouts
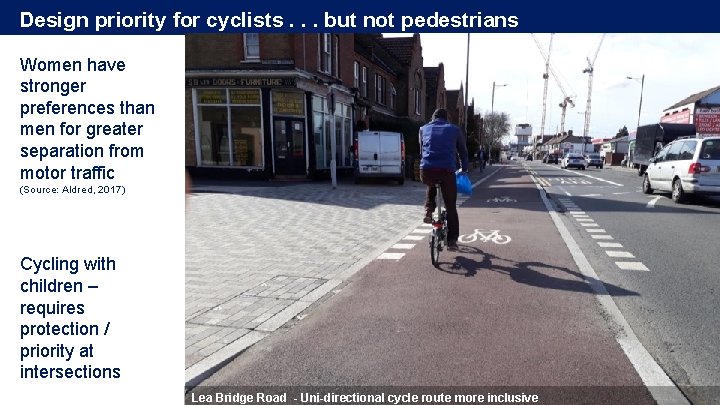
Design priority for cyclists. . . but not pedestrians Women have stronger preferences than men for greater separation from motor traffic (Source: Aldred, 2017) Cycling with children – requires protection / priority at intersections Design priority for people walking & cycling, Oval, London Lea Bridge Road - Uni-directional cycle route more inclusive
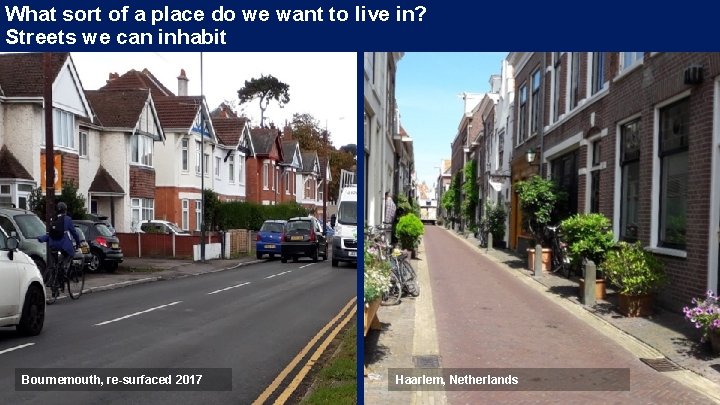
What sort of a place do we want to live in? Streets we can inhabit Bournemouth, re-surfaced 2017 Haarlem, Netherlands
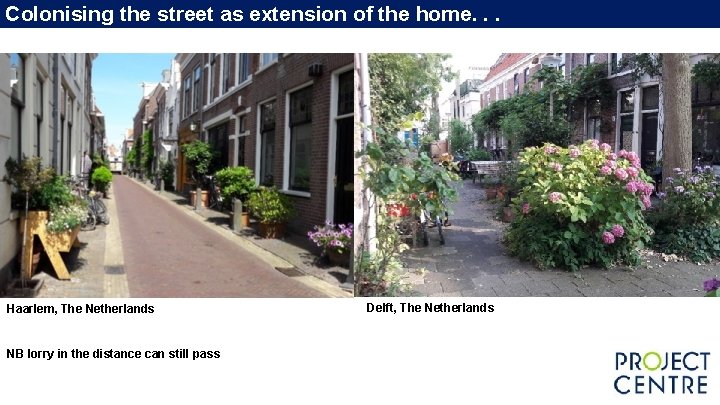
Colonising the street as extension of the home. . . Haarlem, The Netherlands NB lorry in the distance can still pass Delft, The Netherlands
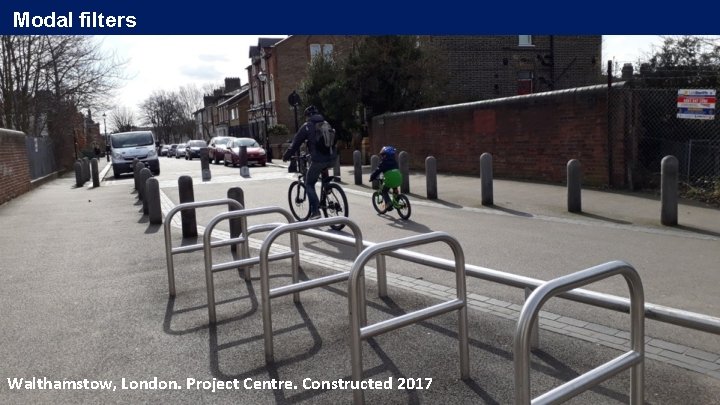
Modal filters Walthamstow, London. Project Centre. Constructed 2017
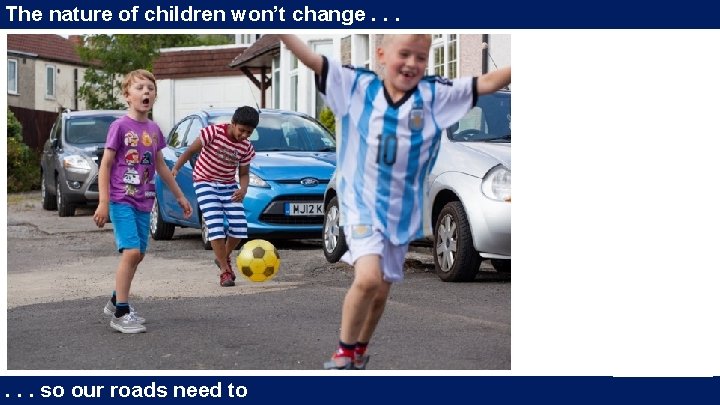
The nature of children won’t change. . . so our roads need to
Thank you Twitter: Taussig@LMaufe Lucy. Marstrand@projectcentre. co. uk