Regional Groundwater Flow I Introduction A Diagram the


")
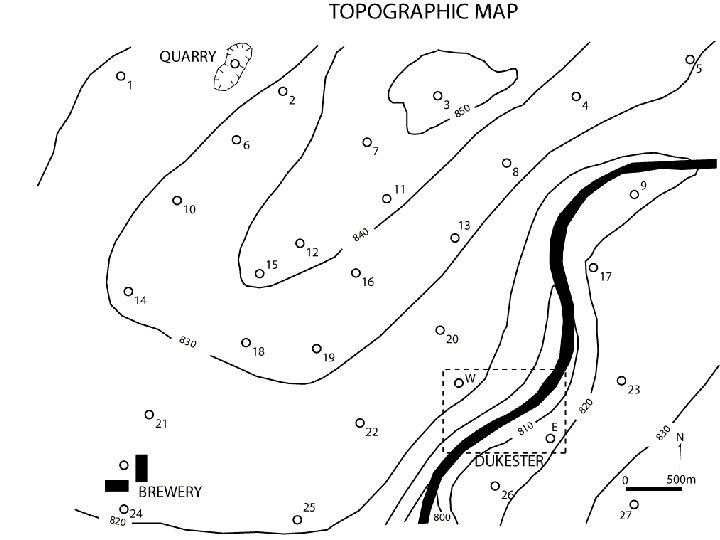
 A. Topography")
 A. B. Topography Piezometer Trends")
 A. B. C. Topography Piezometer Trends")
 A. B. C. D. Topography Piezometer")
 A. B. C. D. E. Topography")


")


 = ρw")
 = ρw")
- Slides: 26
Regional Groundwater Flow
I. Introduction A. Diagram “ the water table is a subdued replica of the surface topography”
II. Groundwater Flow Patterns
II. Groundwater Flow Patterns GW Divide
II. Groundwater Flow Patterns GW Divide Hinge Line
II. Groundwater Flow Patterns Discharge Zone Recharge Zone GW Divide Hinge Line Discharge Zone
III. Piezometer Patterns
IV. Effects of Topography Toth systems of flow local intermediate regional
IV. Effects of Topography
IV. Effects of Topography
V. Flow System Mapping (recharge and discharge zones)
V. Flow System Mapping (recharge and discharge zones) A. Topography
V. Flow System Mapping (recharge and discharge zones) A. B. Topography Piezometer Trends
V. Flow System Mapping (recharge and discharge zones) A. B. C. Topography Piezometer Trends Hydrochemical Trends
V. Flow System Mapping (recharge and discharge zones) A. B. C. D. Topography Piezometer Trends Hydrochemical Trends Environmental Isotopes
V. Flow System Mapping (recharge and discharge zones) A. B. C. D. E. Topography Piezometer Trends Hydrochemical Trends Environmental Isotopes Soil, Vegetation and Land Surface Features
VI. Salt Water Encroachment A. The problem
VI. Salt Water Encroachment B. Possible Solutions 1. modification of pumping pattern
VI. Salt Water Encroachment B. Possible Solutions 2. artificial recharge
3. pumping troughs
4. freshwater ridge (injection barrier)
5. subsurface barrier
VI. Salt Water Encroachment B. Possible Solutions 1. modification of pumping pattern 2. artificial recharge 3. pumping troughs 4. freshwater ridge (injection barrier) 5. subsurface barrier
VI. Salt Water Encroachment C. Predicting the Intrusion Ghyben-Herzberg Principle z(x, y) = ρw * h(x, y) ρs - ρw
VI. Salt Water Encroachment C. Predicting the Intrusion Ghyben-Herzberg Principle z(x, y) = ρw * h(x, y) ρs - ρw If ρs = 1. 025; ρw = 1. 000 then z(x, y) = 40 h(x, y)