Rand Water Capital Expenditure Programme Anthony ELS Tariff


- Slides: 35
Rand Water Capital Expenditure Programme Anthony ELS Tariff consultation 14 October 2015
CONTENT 1. Demand growth forecast 2. Augmentation & renewal plan to 2035 3. Capital budget 2
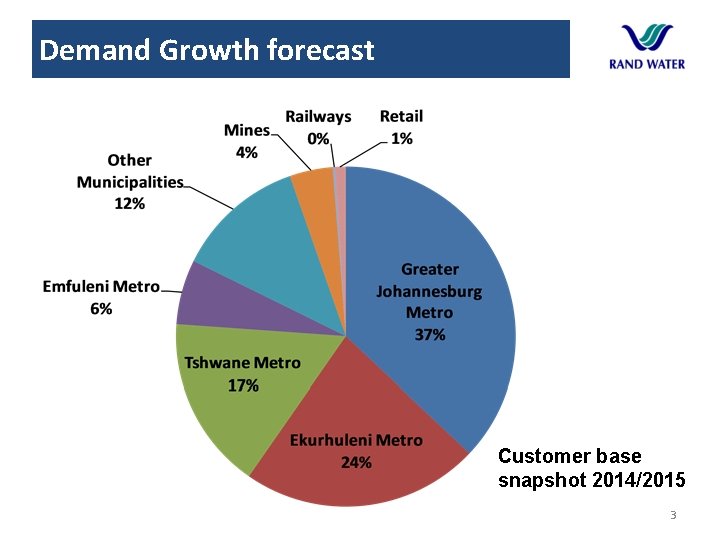
Demand Growth forecast Customer base snapshot 2014/2015 3
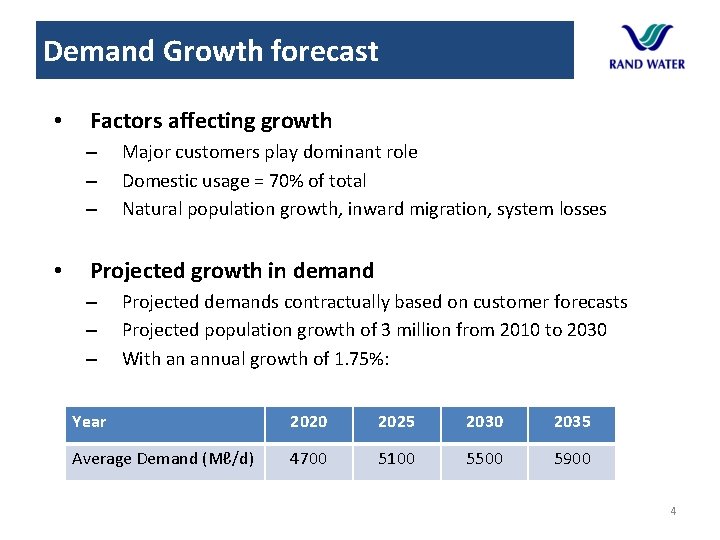
Demand Growth forecast • Factors affecting growth – – – • Major customers play dominant role Domestic usage = 70% of total Natural population growth, inward migration, system losses Projected growth in demand – – – Projected demands contractually based on customer forecasts Projected population growth of 3 million from 2010 to 2030 With an annual growth of 1. 75%: Year 2020 2025 2030 2035 Average Demand (Mℓ/d) 4700 5100 5500 5900 4
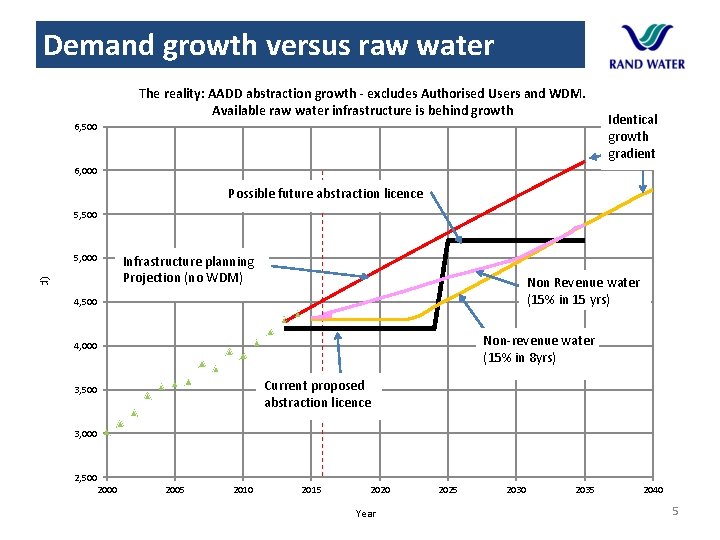
Demand growth versus raw water The reality: AADD abstraction growth - excludes Authorised Users and WDM. Available raw water infrastructure is behind growth 6, 500 Identical growth gradient 6, 000 Possible future abstraction licence 5, 500 Flow (Ml/d) 5, 000 Infrastructure planning Projection (no WDM) Non Revenue water (15% in 15 yrs) 4, 500 Non-revenue water (15% in 8 yrs) 4, 000 Current proposed abstraction licence 3, 500 3, 000 2, 500 2005 2010 2015 2020 Year 2025 2030 2035 2040 5
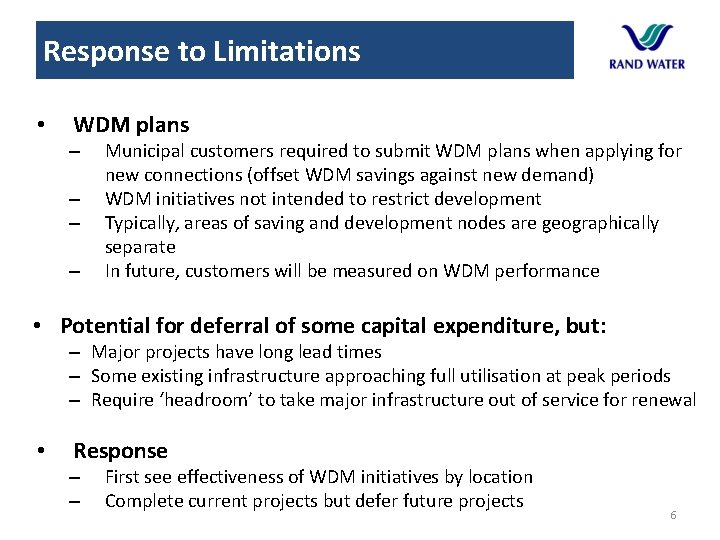
Response to Limitations • WDM plans – – Municipal customers required to submit WDM plans when applying for new connections (offset WDM savings against new demand) WDM initiatives not intended to restrict development Typically, areas of saving and development nodes are geographically separate In future, customers will be measured on WDM performance • Potential for deferral of some capital expenditure, but: – Major projects have long lead times – Some existing infrastructure approaching full utilisation at peak periods – Require ‘headroom’ to take major infrastructure out of service for renewal • Response – – First see effectiveness of WDM initiatives by location Complete current projects but defer future projects 6
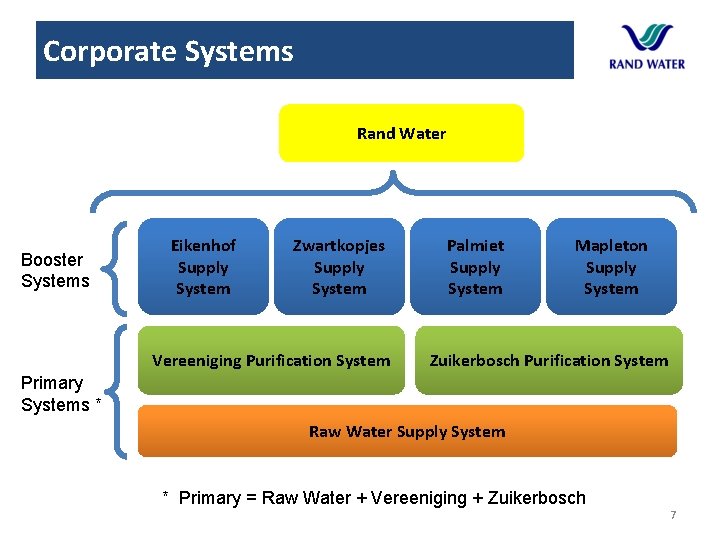
Corporate Systems Rand Water Booster Systems Eikenhof Supply System Zwartkopjes Supply System Vereeniging Purification System Palmiet Supply System Mapleton Supply System Zuikerbosch Purification System Primary Systems * Raw Water Supply System * Primary = Raw Water + Vereeniging + Zuikerbosch 7
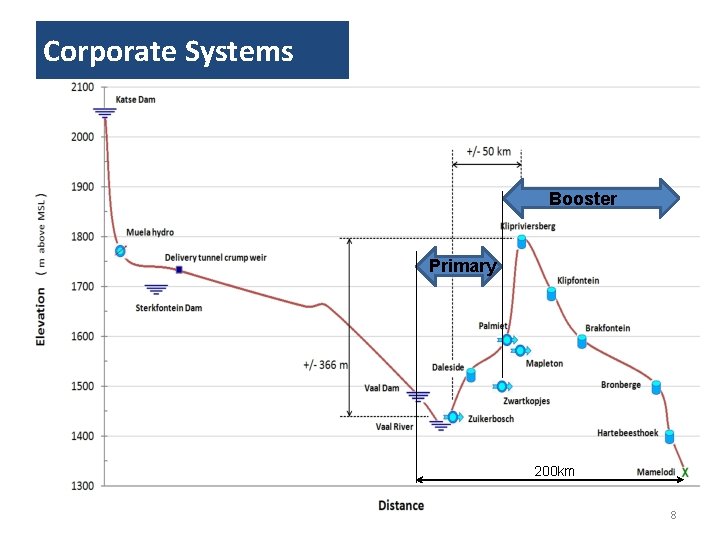
Corporate Systems Booster Primary 200 km 8
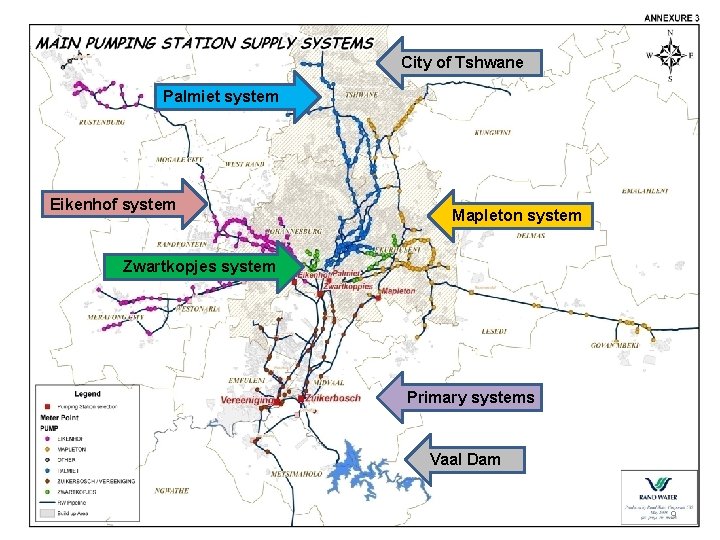
City of Tshwane Palmiet system Eikenhof system Mapleton system Zwartkopjes system Primary systems Vaal Dam 9
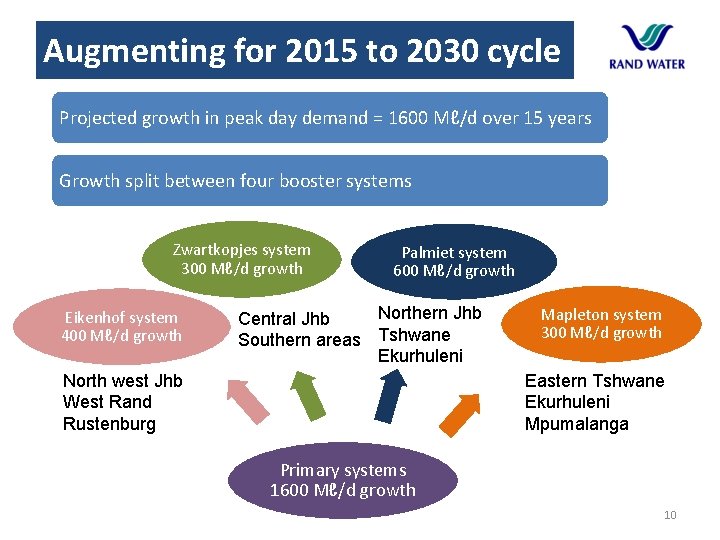
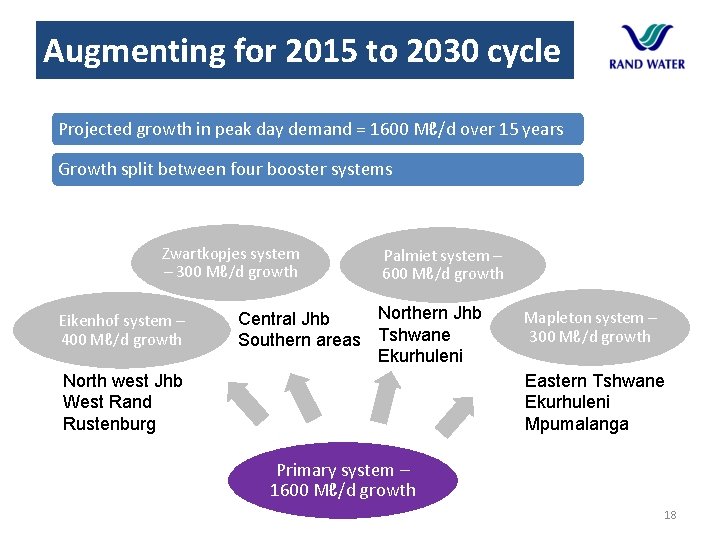
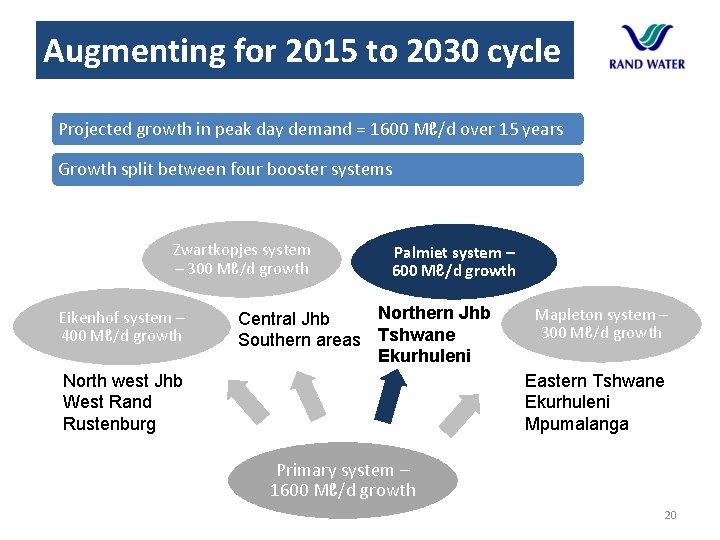
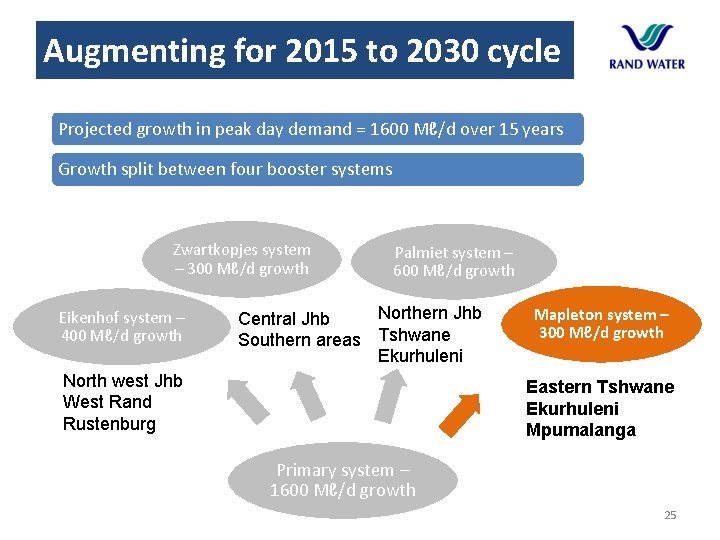
Augmenting for 2015 to 2030 cycle Projected growth in peak day demand = 1600 Mℓ/d over 15 years Growth split between four booster systems Zwartkopjes system 300 Mℓ/d growth Eikenhof system 400 Mℓ/d growth Palmiet system 600 Mℓ/d growth Northern Jhb Central Jhb Southern areas Tshwane Ekurhuleni North west Jhb West Rand Rustenburg Mapleton system 300 Mℓ/d growth Eastern Tshwane Ekurhuleni Mpumalanga Primary systems 1600 Mℓ/d growth 10
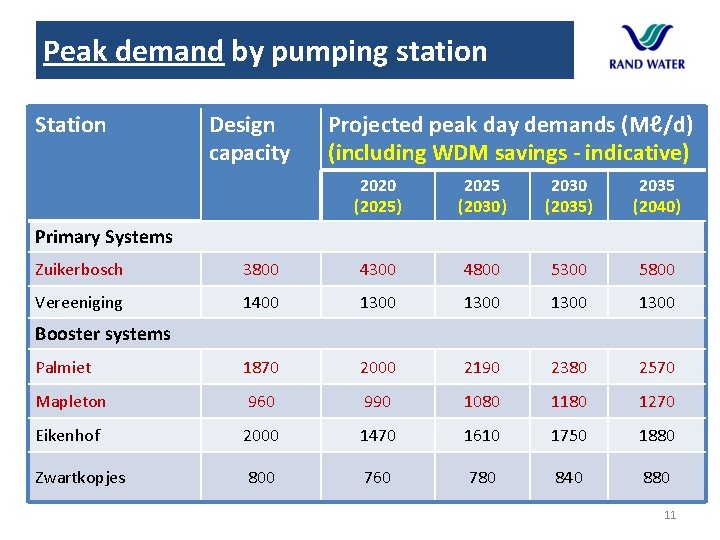
Peak demand by pumping station Station Design capacity Projected peak day demands (Mℓ/d) (including WDM savings - indicative) 2020 (2025) 2025 (2030) 2030 (2035) 2035 (2040) Primary Systems Zuikerbosch 3800 4300 4800 5300 5800 Vereeniging 1400 1300 Palmiet 1870 2000 2190 2380 2570 Mapleton 960 990 1080 1180 1270 Eikenhof 2000 1470 1610 1750 1880 Zwartkopjes 800 760 780 840 880 Booster systems 11
CONTENT 1. Demand growth forecast 2. Augmentation & renewal plan to 2035 3. Capital budget 12
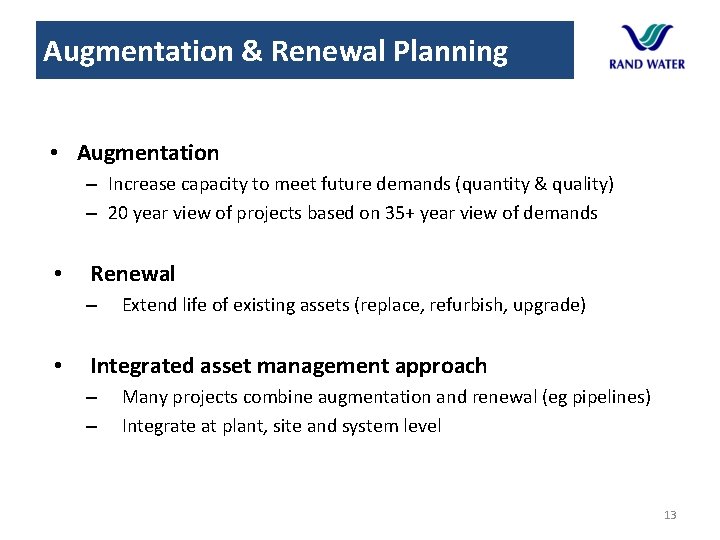
Augmentation & Renewal Planning • Augmentation – Increase capacity to meet future demands (quantity & quality) – 20 year view of projects based on 35+ year view of demands • Renewal – • Extend life of existing assets (replace, refurbish, upgrade) Integrated asset management approach – – Many projects combine augmentation and renewal (eg pipelines) Integrate at plant, site and system level 13
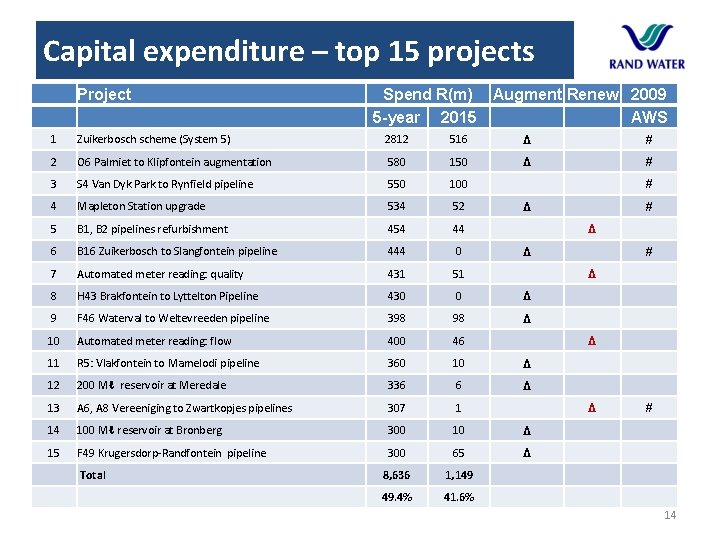
Capital expenditure – top 15 projects Project Spend R(m) Augment Renew 2009 5 -year 2015 AWS 1 Zuikerbosch scheme (System 5) 2812 516 Δ # 2 O 6 Palmiet to Klipfontein augmentation 580 150 Δ # 3 S 4 Van Dyk Park to Rynfield pipeline 550 100 4 Mapleton Station upgrade 534 52 5 B 1, B 2 pipelines refurbishment 454 44 6 B 16 Zuikerbosch to Slangfontein pipeline 444 0 7 Automated meter reading: quality 431 51 8 H 43 Brakfontein to Lyttelton Pipeline 430 0 Δ 9 F 46 Waterval to Weltevreeden pipeline 398 98 Δ 10 Automated meter reading: flow 400 46 11 R 5: Vlakfontein to Mamelodi pipeline 360 10 Δ 12 200 Mℓ reservoir at Meredale 336 6 Δ 13 A 6, A 8 Vereeniging to Zwartkopjes pipelines 307 1 14 100 Mℓ reservoir at Bronberg 300 10 Δ 15 F 49 Krugersdorp-Randfontein pipeline 300 65 Δ 8, 636 1, 149 49. 4% 41. 6% Total # Δ Δ Δ # 14
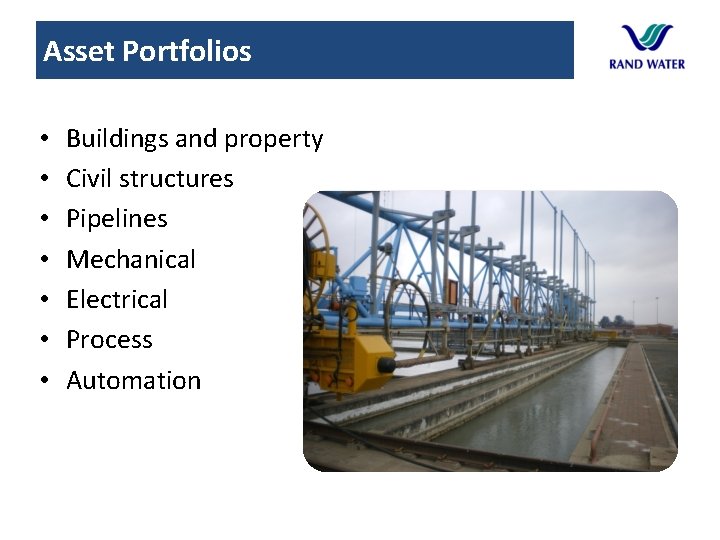
Asset Portfolios • • Buildings and property Civil structures Pipelines Mechanical Electrical Process Automation
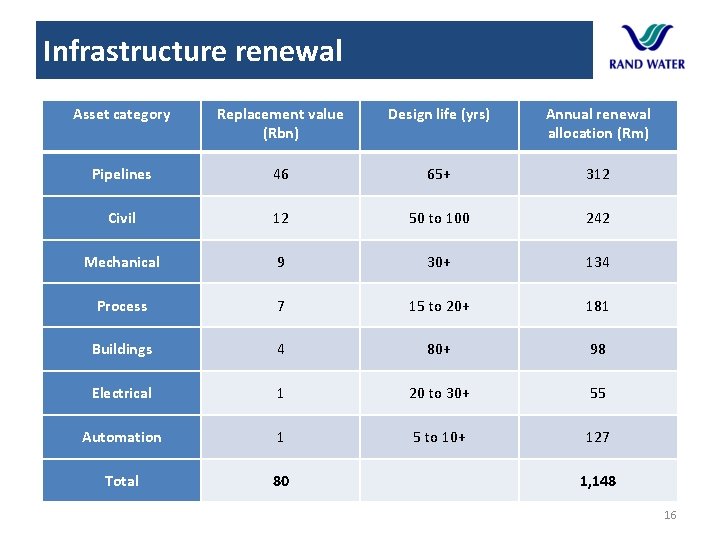
Infrastructure renewal Asset category Replacement value (Rbn) Design life (yrs) Annual renewal allocation (Rm) Pipelines 46 65+ 312 Civil 12 50 to 100 242 Mechanical 9 30+ 134 Process 7 15 to 20+ 181 Buildings 4 80+ 98 Electrical 1 20 to 30+ 55 Automation 1 5 to 10+ 127 Total 80 1, 148 16
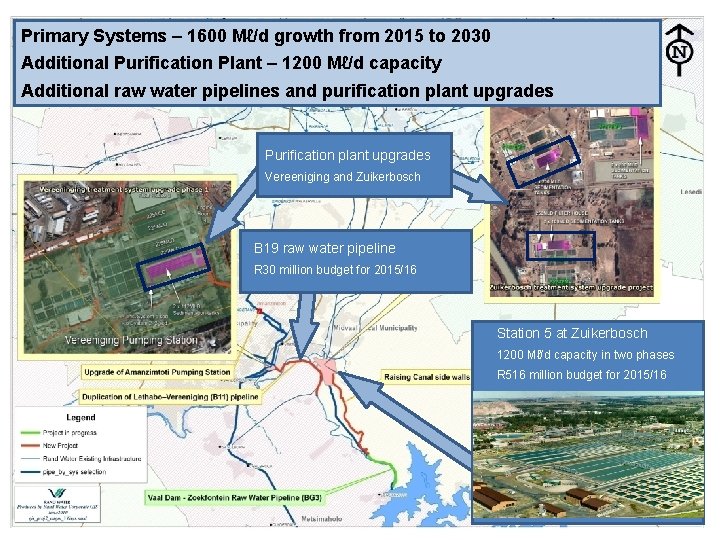
Infrastructure augmentation Providing for 2015 to 2030 augmentation cycle 2009 Additional Water Supply (AWS) Scheme Station 5 at Zuikerbosch • Augment primary capacity, with associated major pipelines and booster pumping capacity • Package of linked major projects for backbone infrastructure • Anchor project for the 2009 AWS Scheme • Purifies and pumps into the network additional 1200 Mℓ/d after completion of phase 2 17
Augmenting for 2015 to 2030 cycle Projected growth in peak day demand = 1600 Mℓ/d over 15 years Growth split between four booster systems Zwartkopjes system – 300 Mℓ/d growth Eikenhof system – 400 Mℓ/d growth Palmiet system – 600 Mℓ/d growth Northern Jhb Central Jhb Southern areas Tshwane Ekurhuleni North west Jhb West Rand Rustenburg Mapleton system – 300 Mℓ/d growth Eastern Tshwane Ekurhuleni Mpumalanga Primary system – 1600 Mℓ/d growth 18
Primary Systems – 1600 Mℓ/d growth from 2015 to 2030 Additional Purification Plant – 1200 Mℓ/d capacity Additional raw water pipelines and purification plant upgrades Purification plant upgrades Vereeniging and Zuikerbosch B 19 raw water pipeline R 30 million budget for 2015/16 Station 5 at Zuikerbosch 1200 Mℓ/d capacity in two phases R 516 million budget for 2015/16 19
Augmenting for 2015 to 2030 cycle Projected growth in peak day demand = 1600 Mℓ/d over 15 years Growth split between four booster systems Zwartkopjes system – 300 Mℓ/d growth Eikenhof system – 400 Mℓ/d growth Palmiet system – 600 Mℓ/d growth Northern Jhb Central Jhb Southern areas Tshwane Ekurhuleni North west Jhb West Rand Rustenburg Mapleton system – 300 Mℓ/d growth Eastern Tshwane Ekurhuleni Mpumalanga Primary system – 1600 Mℓ/d growth 20
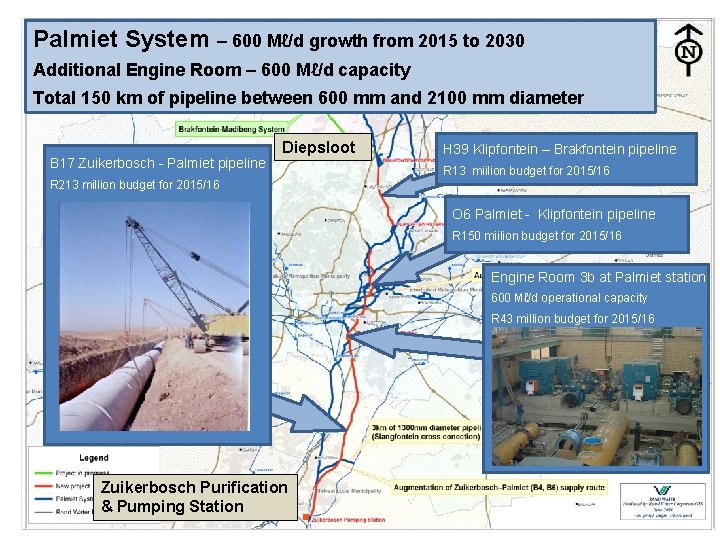
Palmiet System – 600 Mℓ/d growth from 2015 to 2030 Additional Engine Room – 600 Mℓ/d capacity Total 150 km of pipeline between 600 mm and 2100 mm diameter B 17 Zuikerbosch - Palmiet pipeline Diepsloot H 39 Klipfontein – Brakfontein pipeline R 13 miilion budget for 2015/16 R 213 million budget for 2015/16 O 6 Palmiet - Klipfontein pipeline R 150 miilion budget for 2015/16 Engine Room 3 b at Palmiet station 600 Mℓ/d operational capacity R 43 million budget for 2015/16 Zuikerbosch Purification & Pumping Station 21
Palmiet Augmentation Palmiet System pipelines for augmentation Description New pipe name Existing lines Diameter Length Required augmented (mm) (km) (year) 1 Zuikerbosch – Palmiet pipeline B 17 B 4, B 6, B 10 2100 46 2017 2 Klipfontein – Brakfontein pipeline (partial) H 39 H 12, H 21, H 27 1700 14. 7 2017 3 Palmiet – Klipfontein pipeline (phase 1) O 6 O 2 2100 18 2017 4 Palmiet – Klipfontein pipeline (phase 2) O 6 O 2, part O 5 1800 6 2025 5 Kwaggaspoort – Gomsand pipeline H 42 H 22, H 28 1000 9. 7 2015 6 Northridge – Airfield pipeline G 37/H 47 H 3 900 5. 8 2017 7 Brakfontein – Lyttelton pipeline H 43 H 12 portion 1500 26 2022 8 Lyttelton – Kwaggaspoort p/line H 42 H 14 portion 1200 6 2022 9 Brakfontein – Kwaggaspoort pipeline - H 25, H 30 1700 21 2027 10 Kwaggaspoort – Hartebeesthoek pipeline - H 22, H 28, H 42 1200 15 2032 11 Hartebeesthoek – Rosslyn pipeline - H 18, H 29 ptn 1400 7 2030 12 Rosslyn – Soshanguwe pipeline - H 16, H 29 ptn 1200 8 2030 13 Kensington – Yeoville pipeline O 7 New route 1200 8 2022 22
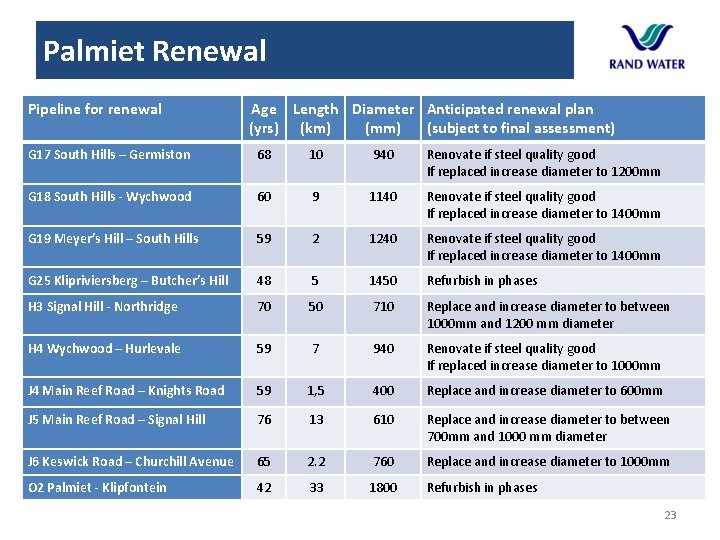
Palmiet Renewal Pipeline for renewal Age Length Diameter Anticipated renewal plan (yrs) (km) (mm) (subject to final assessment) G 17 South Hills – Germiston 68 10 940 Renovate if steel quality good If replaced increase diameter to 1200 mm G 18 South Hills - Wychwood 60 9 1140 Renovate if steel quality good If replaced increase diameter to 1400 mm G 19 Meyer’s Hill – South Hills 59 2 1240 Renovate if steel quality good If replaced increase diameter to 1400 mm G 25 Klipriviersberg – Butcher’s Hill 48 5 1450 Refurbish in phases H 3 Signal Hill - Northridge 70 50 710 Replace and increase diameter to between 1000 mm and 1200 mm diameter H 4 Wychwood – Hurlevale 59 7 940 Renovate if steel quality good If replaced increase diameter to 1000 mm J 4 Main Reef Road – Knights Road 59 1, 5 400 Replace and increase diameter to 600 mm J 5 Main Reef Road – Signal Hill 76 13 610 Replace and increase diameter to between 700 mm and 1000 mm diameter J 6 Keswick Road – Churchill Avenue 65 2. 2 760 Replace and increase diameter to 1000 mm O 2 Palmiet - Klipfontein 42 33 1800 Refurbish in phases 23
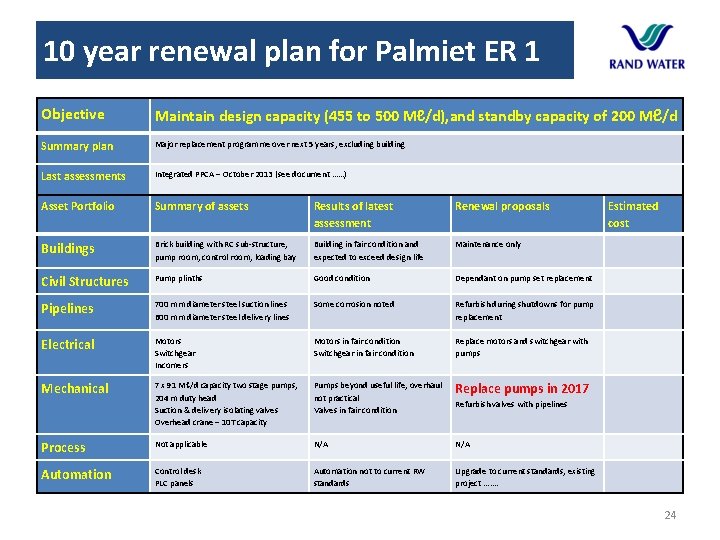
10 year renewal plan for Palmiet ER 1 Objective Maintain design capacity (455 to 500 Mℓ/d), and standby capacity of 200 Mℓ/d Summary plan Major replacement programme over next 5 years, excluding building Last assessments Integrated PPCA – October 2013 (see document ……) Asset Portfolio Summary of assets Results of latest assessment Renewal proposals Estimated cost Buildings Brick building with RC sub-structure, pump room, control room, loading bay Building in fair condition and expected to exceed design life Maintenance only Civil Structures Objective Pump plinths Good condition Dependant on pump set replacement Maintain design capacity with slight increase from 455 Ml/d to 500 Ml/d, and standby capacity of 200 Ml/d Summary plan 700 mm diameter steel suction lines Some corrosion noted Major replacement programme over next 5 years, excluding building 600 mm diameter steel delivery lines Integrated PPCA – October 2013 (see document ……) Refurbish during shutdowns for pump replacement Electrical Motors Switchgear Incomers Motors in fair condition Switchgear in fair condition Replace motors and switchgear with pumps Mechanical 7 x 91 Mℓ/d capacity two stage pumps, 204 m duty head Suction & delivery isolating valves Overhead crane – 10 T capacity Pumps beyond useful life, overhaul not practical Valves in fair condition Replace pumps in 2017 Process Not applicable N/A Automation Control desk PLC panels Automation not to current RW standards Upgrade to current standards, existing project ……. Pipelines Last assessments Refurbish valves with pipelines 24
Augmenting for 2015 to 2030 cycle Projected growth in peak day demand = 1600 Mℓ/d over 15 years Growth split between four booster systems Zwartkopjes system – 300 Mℓ/d growth Eikenhof system – 400 Mℓ/d growth Palmiet system – 600 Mℓ/d growth Northern Jhb Central Jhb Southern areas Tshwane Ekurhuleni North west Jhb West Rand Rustenburg Mapleton system – 300 Mℓ/d growth Eastern Tshwane Ekurhuleni Mpumalanga Primary system – 1600 Mℓ/d growth 25
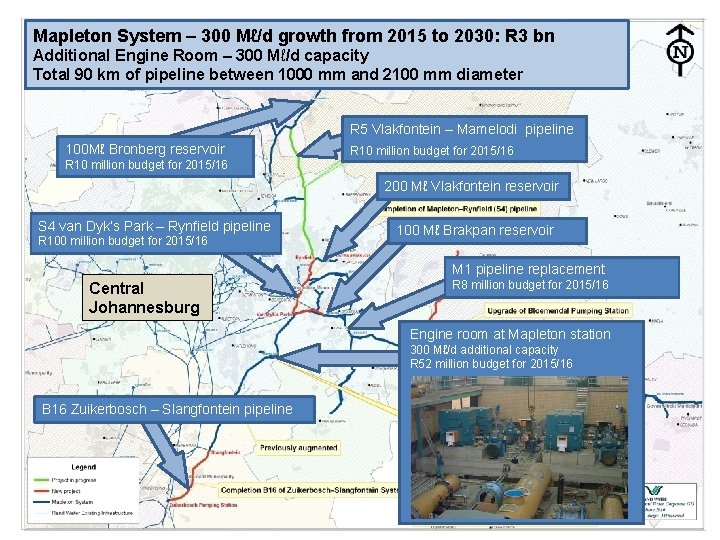
Mapleton System – 300 Mℓ/d growth from 2015 to 2030: R 3 bn Additional Engine Room – 300 Mℓ/d capacity Total 90 km of pipeline between 1000 mm and 2100 mm diameter R 5 Vlakfontein – Mamelodi pipeline 100 Mℓ Bronberg reservoir R 10 million budget for 2015/16 200 Mℓ Vlakfontein reservoir S 4 van Dyk’s Park – Rynfield pipeline R 100 million budget for 2015/16 100 Mℓ Brakpan reservoir M 1 pipeline replacement Central Johannesburg R 8 million budget for 2015/16 Engine room at Mapleton station 300 Mℓ/d additional capacity R 52 million budget for 2015/16 B 16 Zuikerbosch – Slangfontein pipeline 26
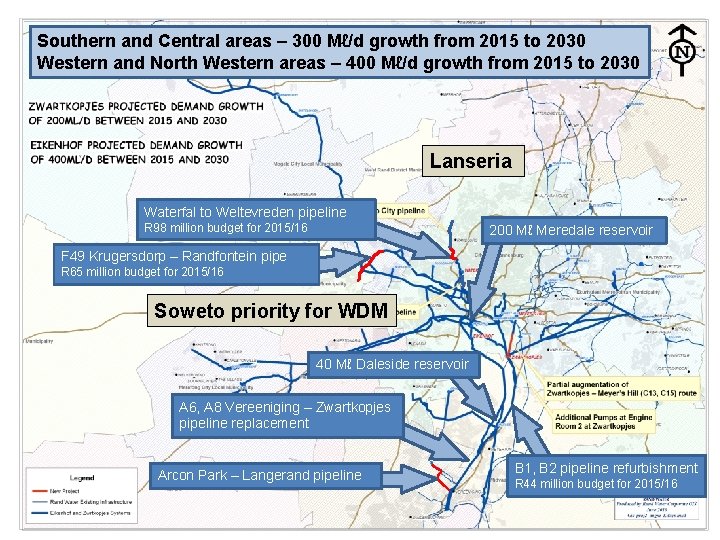
Southern and Central areas – 300 Mℓ/d growth from 2015 to 2030 Western and North Western areas – 400 Mℓ/d growth from 2015 to 2030 Lanseria Waterfal to Weltevreden pipeline R 98 million budget for 2015/16 200 Mℓ Meredale reservoir F 49 Krugersdorp – Randfontein pipe R 65 million budget for 2015/16 Soweto priority for WDM 40 Mℓ Daleside reservoir A 6, A 8 Vereeniging – Zwartkopjes pipeline replacement Arcon Park – Langerand pipeline B 1, B 2 pipeline refurbishment R 44 million budget for 2015/16 27
CONTENT 1. Demand growth forecast 2. Augmentation & renewal plan to 2035 3. Capital budget 28
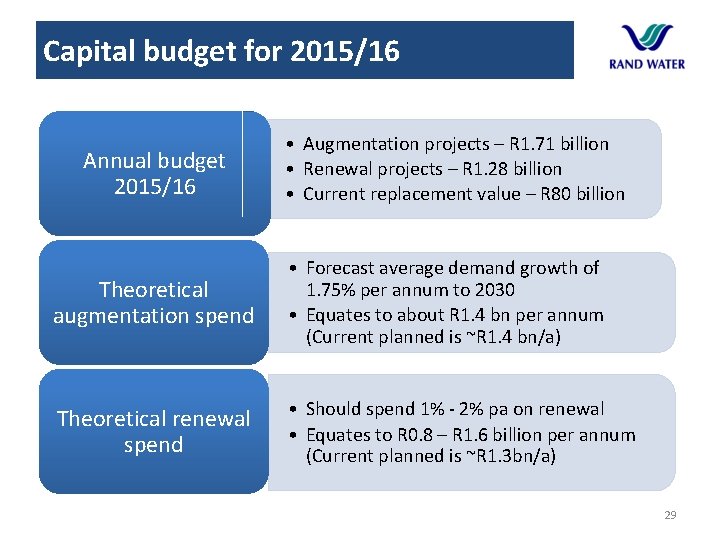
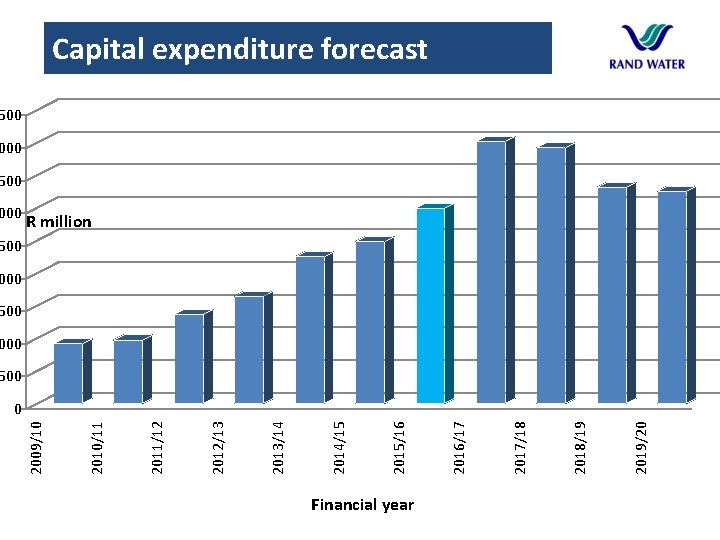
Capital budget for 2015/16 Annual budget 2015/16 • Augmentation projects – R 1. 71 billion • Renewal projects – R 1. 28 billion • Current replacement value – R 80 billion Theoretical augmentation spend • Forecast average demand growth of 1. 75% per annum to 2030 • Equates to about R 1. 4 bn per annum (Current planned is ~R 1. 4 bn/a) Theoretical renewal spend • Should spend 1% - 2% pa on renewal • Equates to R 0. 8 – R 1. 6 billion per annum (Current planned is ~R 1. 3 bn/a) 29
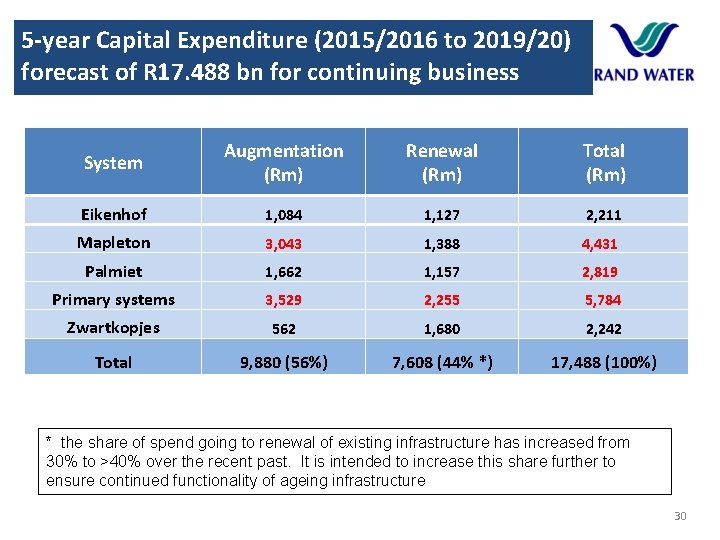
5 -year Capital Expenditure (2015/2016 to 2019/20) forecast of R 17. 488 bn for continuing business System Augmentation (Rm) Renewal (Rm) Total (Rm) Eikenhof 1, 084 1, 127 2, 211 Mapleton 3, 043 1, 388 4, 431 Palmiet 1, 662 1, 157 2, 819 Primary systems 3, 529 2, 255 5, 784 Zwartkopjes 562 1, 680 2, 242 Total 9, 880 (56%) 7, 608 (44% *) 17, 488 (100%) * the share of spend going to renewal of existing infrastructure has increased from 30% to >40% over the recent past. It is intended to increase this share further to ensure continued functionality of ageing infrastructure 30
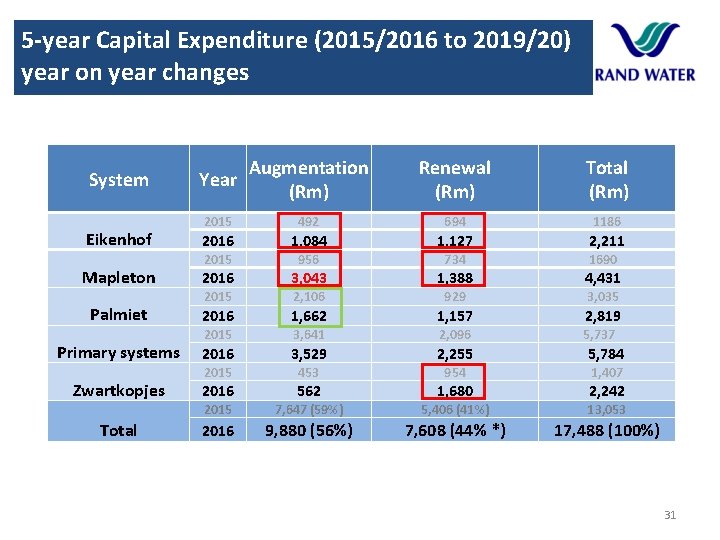
5 -year Capital Expenditure (2015/2016 to 2019/20) year on year changes System Eikenhof Mapleton Palmiet Primary systems Zwartkopjes Total Year Augmentation (Rm) Renewal (Rm) Total (Rm) 2015 492 694 1186 2016 1, 084 1, 127 2015 956 734 1690 2016 3, 043 1, 388 4, 431 2015 2, 106 929 3, 035 2016 1, 662 1, 157 2, 819 2015 3, 641 2, 096 5, 737 2016 3, 529 2, 255 5, 784 2015 453 954 1, 407 2016 562 1, 680 2, 242 2015 7, 647 (59%) 5, 406 (41%) 13, 053 2016 9, 880 (56%) 7, 608 (44% *) 17, 488 (100%) 2, 211 31
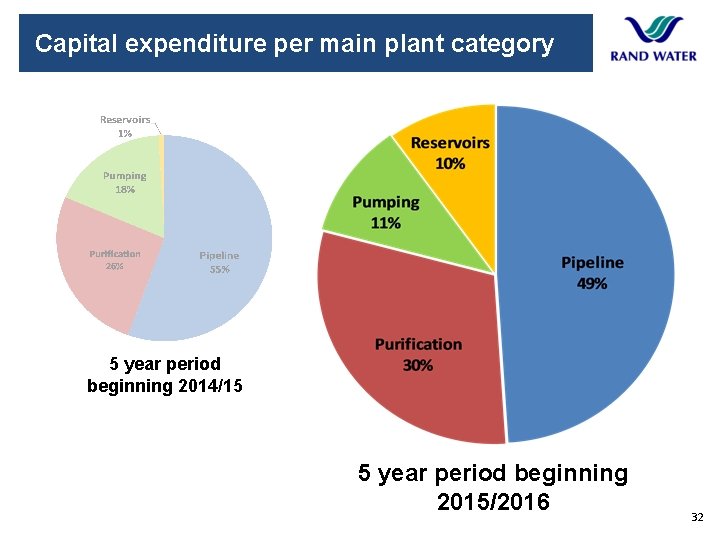
Capital expenditure per main plant category 5 year period beginning 2014/15 5 year period beginning 2015/2016 32
Capital expenditure forecast 500 000 R million 500 000 500 Financial year 2019/20 2018/19 2017/18 2016/17 2015/16 2014/15 2013/14 2012/13 2011/12 2010/11 2009/10 0
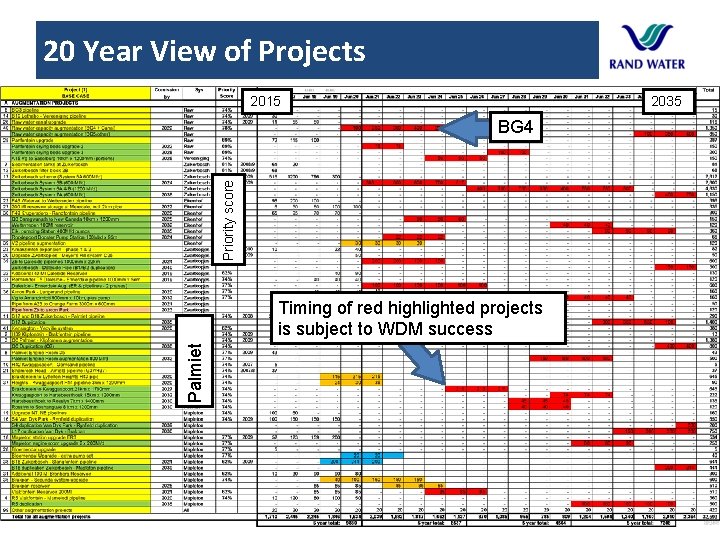
20 Year View of Projects 2015 2035 Priority score BG 4 Palmiet Timing of red highlighted projects is subject to WDM success
THANK YOU 35