PTC System Monitor DeepDive PTC Windchill ProActive Monitoring




- Slides: 40

PTC System Monitor Deep-Dive: PTC Windchill Pro-Active Monitoring and Performance Troubleshooting Stephen Vaillancourt Fellow - PTC Technical Support Tim Atwood Senior Technical Consultant - PTC Enterprise Deployment Center June, 2014

Agenda • PSM 3. 0 New Features • Which dashboards to start from for initial analysis? • Self-help in diagnosing and resolving problems • Transition from Reactive to Proactive monitoring of your PTC Environment • Tips for adjusting incident actions and thresholds • Tips for creating Reports • How to better monitor your company’s critical “business transactions” using new dashboards and optional Auto. Baselines 2

PSM 3. 0 New Features 3

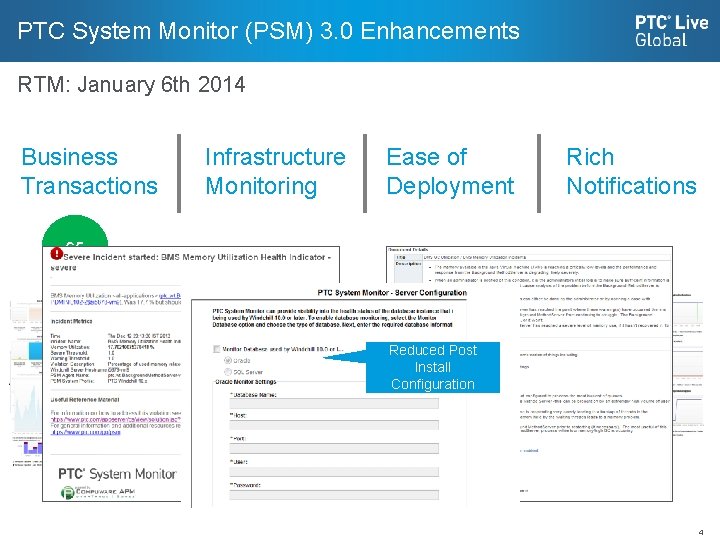
PTC System Monitor (PSM) 3. 0 Enhancements RTM: January 6 th 2014 Business Transactions Infrastructure Monitoring Ease of Deployment Rich Notifications 65 Reduced Post Install PSM Incident to PTC KB Configuration 4

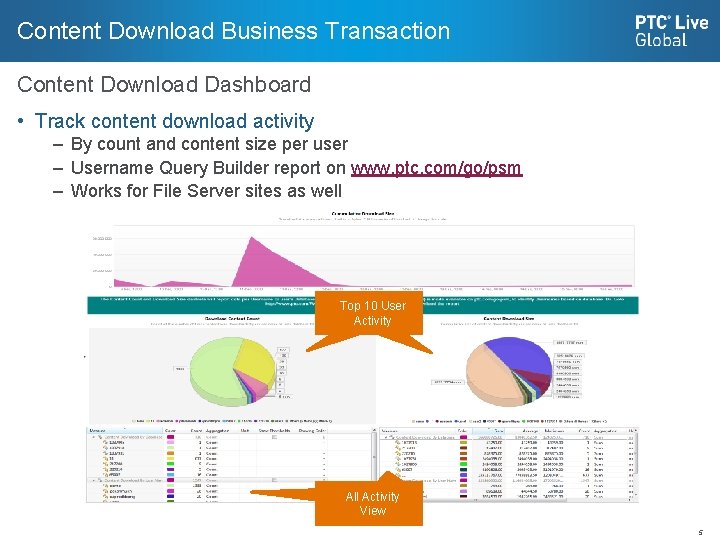
Content Download Business Transaction Content Download Dashboard • Track content download activity – By count and content size per user – Username Query Builder report on www. ptc. com/go/psm – Works for File Server sites as well Queue Top 10 User Activity Name All Activity View 5

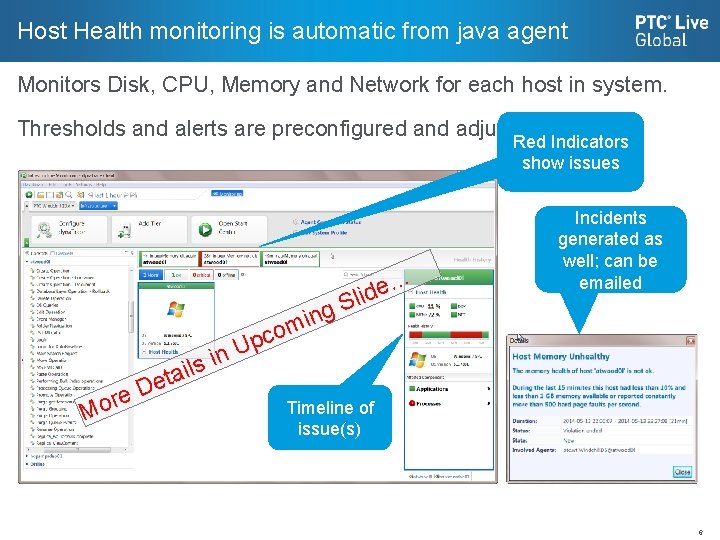
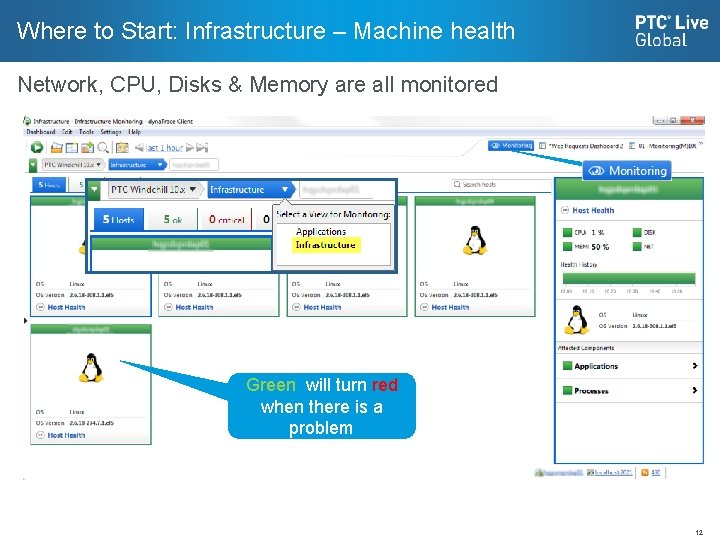
Host Health monitoring is automatic from java agent Monitors Disk, CPU, Memory and Network for each host in system. Thresholds and alerts are preconfigured and adjustable. Red Indicators show issues n D e r Mo i s l i eta o c p U g n i m … e d i Sl Incidents generated as well; can be emailed Timeline of issue(s) 6

Where to Start? 7

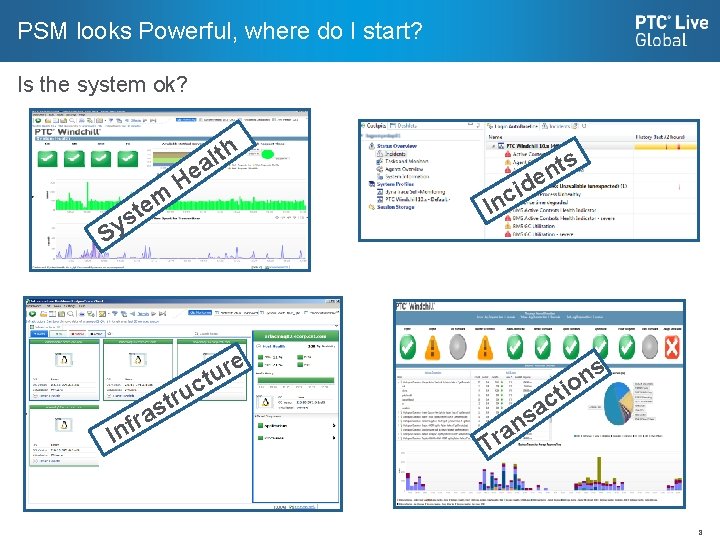
PSM looks Powerful, where do I start? Is the system ok? m e st h t l ea H Sy ts n ide Inc e r u t c u r t In s a r f s n tio c a s n a Tr 8

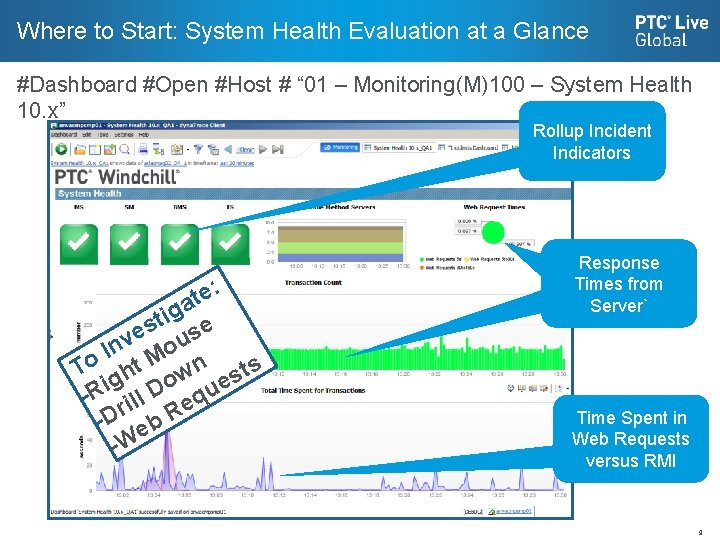
Where to Start: System Health Evaluation at a Glance #Dashboard #Open #Host # “ 01 – Monitoring(M)100 – System Health 10. x” Rollup Incident Indicators : e t ga i t es use v n Mo I To ght wn sts o ue i D R - rill q e -D eb R -W Response Times from Server` Server Time Spent in Web Requests versus RMI 9

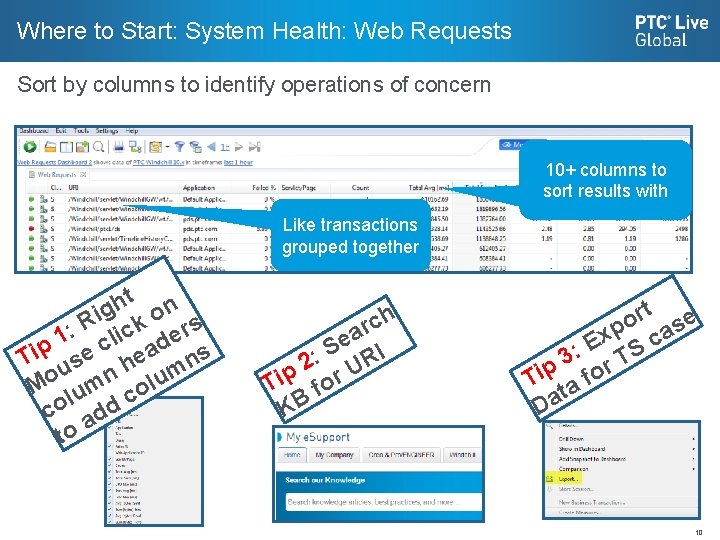
Where to Start: System Health: Web Requests Sort by columns to identify operations of concern 10+ columns to sort results with Like transactions grouped together t n h g i ko s R r : c i e 1 l d c Tip use hea ns m n o u l M lum co co add to h c r a e : S RI 2 U p r i T fo KB rt se o xp ca E S : 3 T r Tip a fo t Da 10

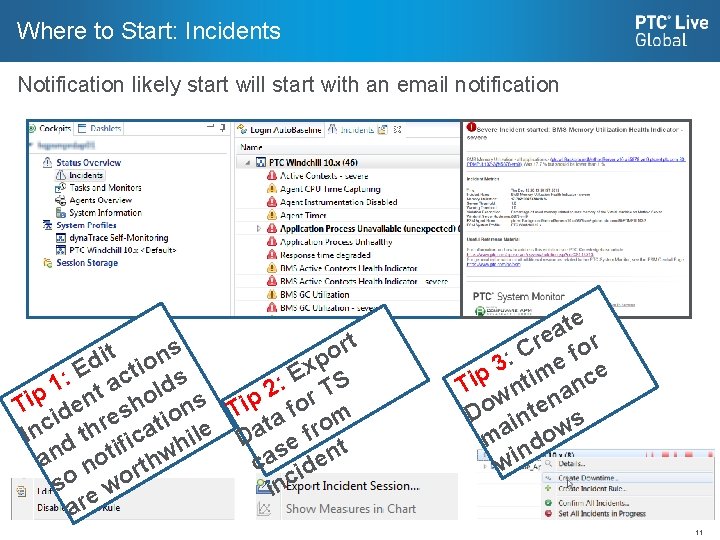
Where to Start: Incidents Notification likely start will start with an email notification t r s t o i p d tion x E E c lds : S : a 1 2 T t p Ti iden esho ons Tip for m i e a ro r t t c a a h n f I d t fic hil D e s ent a an noti rthw c id o o s nc w i are te a re for C : e e 3 m Tip wnti anc n Do inte s ma ndow wi 11

Where to Start: Infrastructure – Machine health Network, CPU, Disks & Memory are all monitored Probl Green will turn red when there is a problem 12

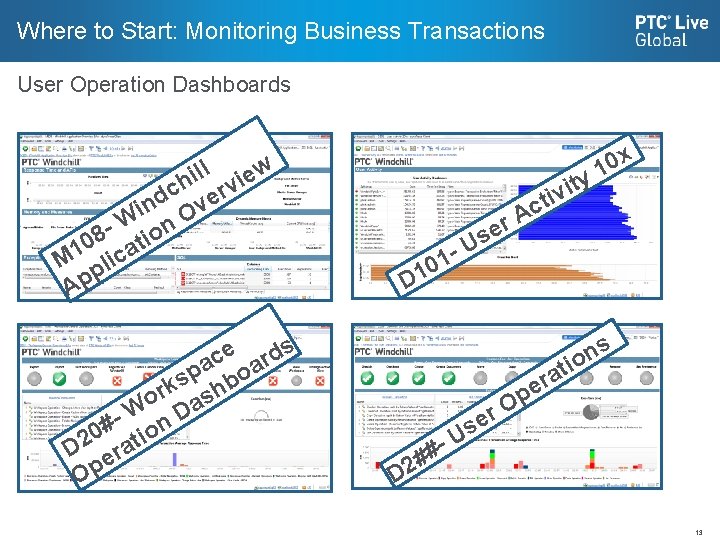
Where to Start: Monitoring Business Transactions User Operation Dashboards ill view h c er d n Ov i W n 8 tio 0 M 1 plica Ap e rds c pa boa s rk sh o W Da # ion 0 D 2 erat Op x t i v ti 0 1 y c A r se U 1 0 1 D s n io t a er p O r - # 2# e s U D 13

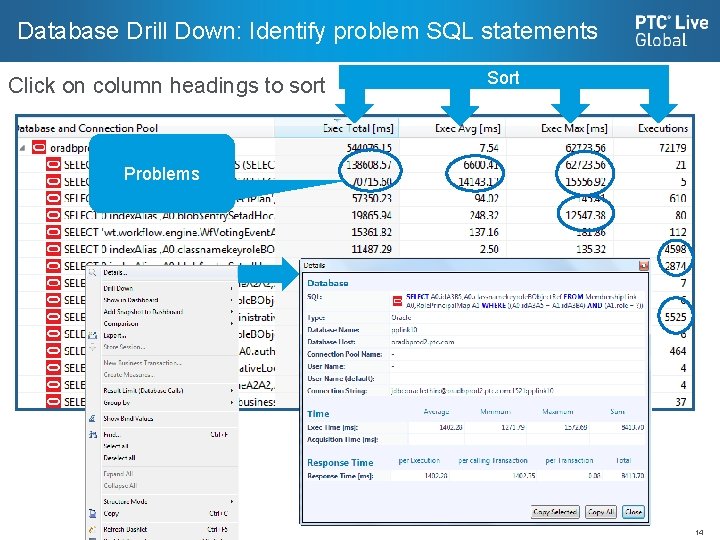
Database Drill Down: Identify problem SQL statements Click on column headings to sort Sort Problems 14

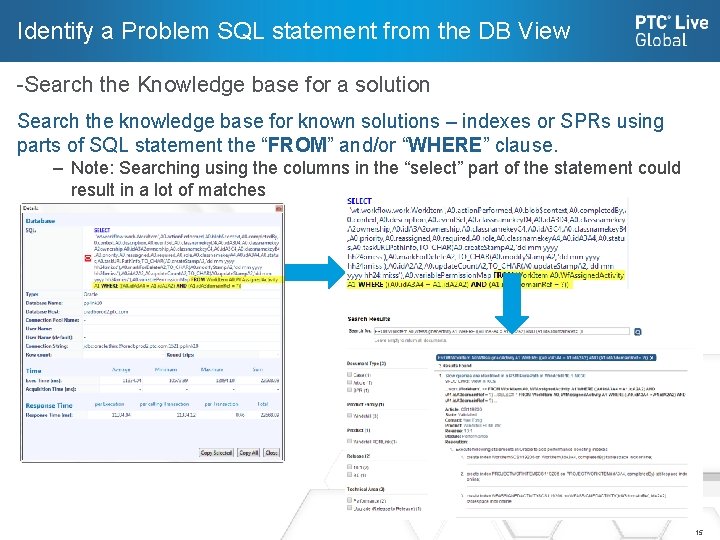
Identify a Problem SQL statement from the DB View -Search the Knowledge base for a solution Search the knowledge base for known solutions – indexes or SPRs using parts of SQL statement the “FROM” and/or “WHERE” clause. – Note: Searching using the columns in the “select” part of the statement could result in a lot of matches 15

Using PSM and the Knowledge Base to get a solution 16

Proactive Approach 17

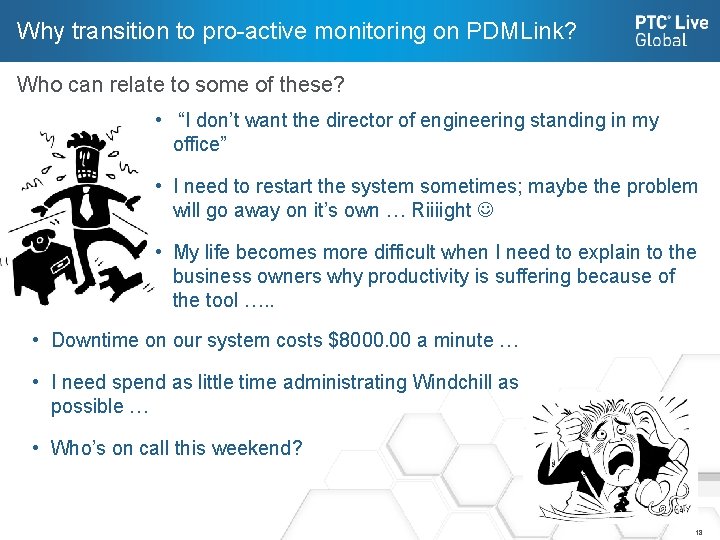
Why transition to pro-active monitoring on PDMLink? Who can relate to some of these? • “I don’t want the director of engineering standing in my office” • I need to restart the system sometimes; maybe the problem will go away on it’s own … Riiiight • My life becomes more difficult when I need to explain to the business owners why productivity is suffering because of the tool …. . • Downtime on our system costs $8000. 00 a minute … • I need spend as little time administrating Windchill as possible … • Who’s on call this weekend? 18

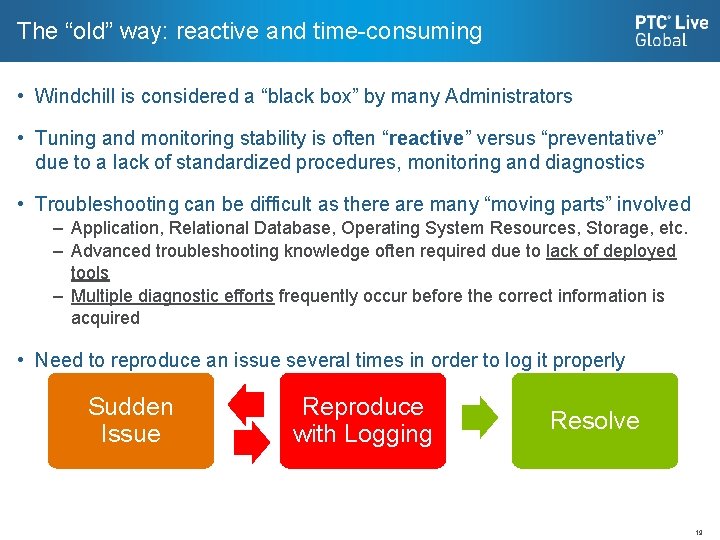
The “old” way: reactive and time-consuming • Windchill is considered a “black box” by many Administrators • Tuning and monitoring stability is often “reactive” versus “preventative” due to a lack of standardized procedures, monitoring and diagnostics • Troubleshooting can be difficult as there are many “moving parts” involved – Application, Relational Database, Operating System Resources, Storage, etc. – Advanced troubleshooting knowledge often required due to lack of deployed tools – Multiple diagnostic efforts frequently occur before the correct information is acquired • Need to reproduce an issue several times in order to log it properly Sudden Issue Reproduce with Logging Resolve 19

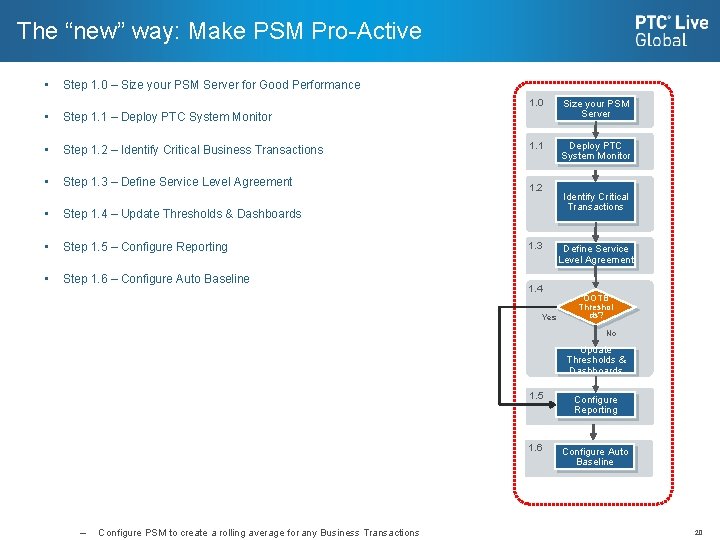
The “new” way: Make PSM Pro-Active • • Step 1. 0 – Size your PSM Server for Good Performance – Check the PSM Sizing Calculator to ensure you have the proper resources allocated to your PSM server Step 1. 1 – Deploy PTC System Monitor – 1. 2 Install and configure PSM in your Development, Test and Production Step – Identify Critical Business Transactions 1. 1 Deploy PTC System Monitor 1. 2 – Identify Critical Business Transactions Step 1. 5 Configure Reporting 1. 3 – Use OOTB Business Transaction Dashboards to identify common and slow transactions Step 1. 6 – Configure Auto Baseline – Engage your Business Unit leadership to identify critical set of end-user transactions, based on the following metrics Frequency of Use Business critical transactions Historically Slow running transactions 1. 4 Yes Based on feedback from Business Unit define what are the acceptable thresholds for your system from a Business Transaction and System availability perspective • Make adjustments to the OOTB incidents and thresholds as needed • Step 1. 4 – Update Thresholds & Dashboards • Step 1. 5 – Configure Reporting – Identify Critical Transactions Define Service Level Agreement OOTB Threshol ds? No Update Thresholds & Dashboards Step 1. 3 – Define Service Level Agreement – • Size your PSM Server Environments. Follow instructions in the Install Guide for detailed steps. – Ensure that you use a database (Oracle or SQL Server) for your Step 1. 3 – Define Warehouse Service Level Agreement performance and not the embedded database built-in the dyna. Trace Server – Ensure you configure the Mail Server settings to receive notifications on Step 1. 4 – Update Thresholds & Dashboards important Infrastructure and Application incidents. • • 1. 0 1. 5 Configure Reporting 1. 6 Configure Auto Baseline Based on output from Step 1. 3, create custom report dashboards, set frequency for reporting and define target audience for reports. Step 1. 6 – Configure Auto Baseline – Configure PSM to create a rolling average for any Business Transactions 20

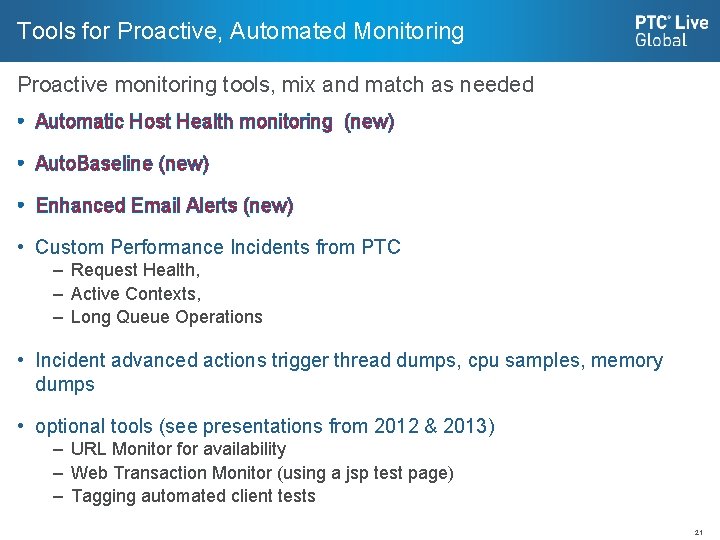
Tools for Proactive, Automated Monitoring Proactive monitoring tools, mix and match as needed • Automatic Host Health monitoring (new) • Auto. Baseline (new) • Enhanced Email Alerts (new) • Custom Performance Incidents from PTC – Request Health, – Active Contexts, – Long Queue Operations • Incident advanced actions trigger thread dumps, cpu samples, memory dumps • optional tools (see presentations from 2012 & 2013) – URL Monitor for availability – Web Transaction Monitor (using a jsp test page) – Tagging automated client tests 21

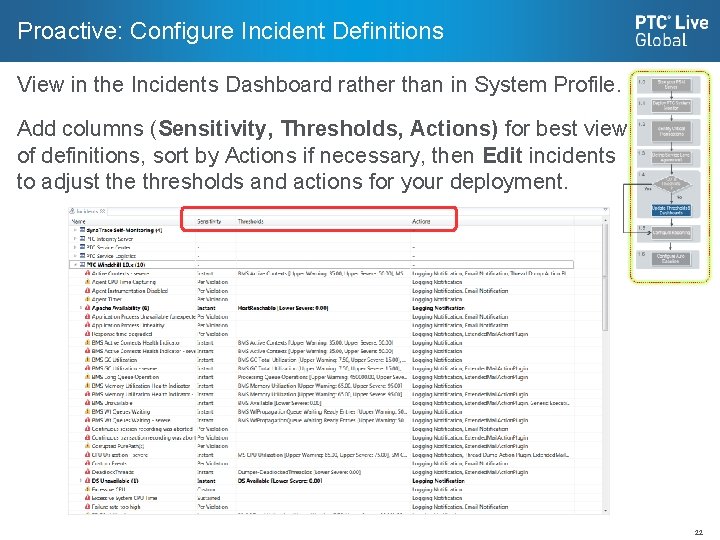
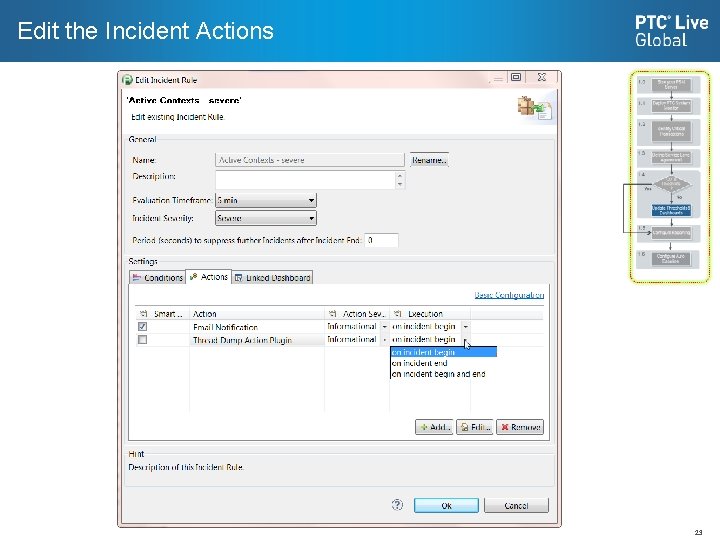
Proactive: Configure Incident Definitions View in the Incidents Dashboard rather than in System Profile. Add columns (Sensitivity, Thresholds, Actions) for best view of definitions, sort by Actions if necessary, then Edit incidents to adjust the thresholds and actions for your deployment. 22

Edit the Incident Actions 23

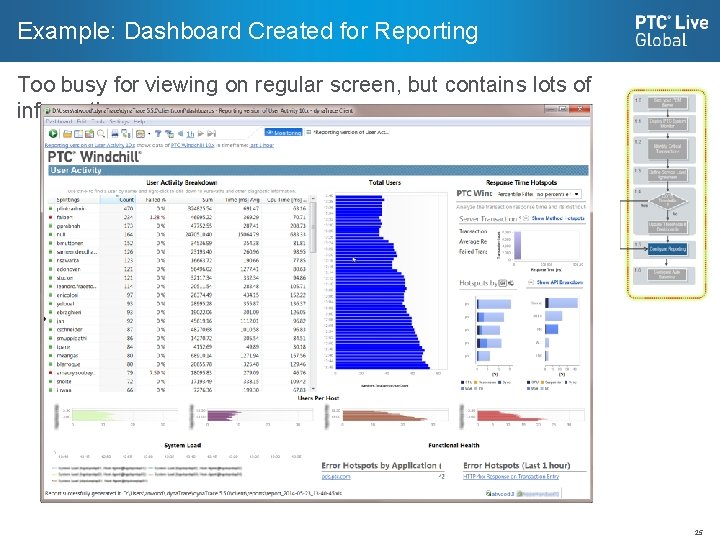
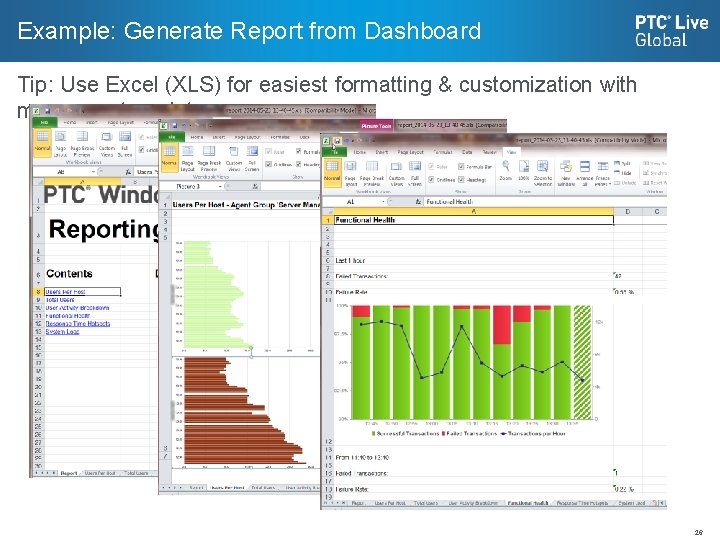
Reports increase ROI from PTC System Monitor Reports are generated based on dashboards • Improving ROI from deploying PSM – – Show throughput and trends for key Business Transactions Show utilization and/or adoption of system over time Show which locations are critical to business Show trends for future growth: users, hardware resources, disk space, etc • Keep your managers informed • Generate on demand or from a schedule (uses last saved version of dashboard) • Tip: use a custom “_report” dashboard for best formatting as pdf or xls – Add legends and details to charts that are not on regular dashboard – May not display properly in client without really large screen – Can have multiple layers of dashlets not shown in client but shown on separate pages in report. – Keeps reporting dashboards from being modified accidentally by clients with admin privileges. 24

Example: Dashboard Created for Reporting Too busy for viewing on regular screen, but contains lots of information 25

Example: Generate Report from Dashboard Tip: Use Excel (XLS) for easiest formatting & customization with macros or templates 26

Business Transaction Thresholds 27

Business Transactions Filters that help you process the large amount of monitoring data • PSM 3. 0 has over 60 new BTs to pick and choose from • Thresholds can be individually tailored for your most important BTs • Additional custom BTs can be created as needed • A new functionality called Auto. Baselines allows for dynamic thresholds based on the past week’s usage data. 28

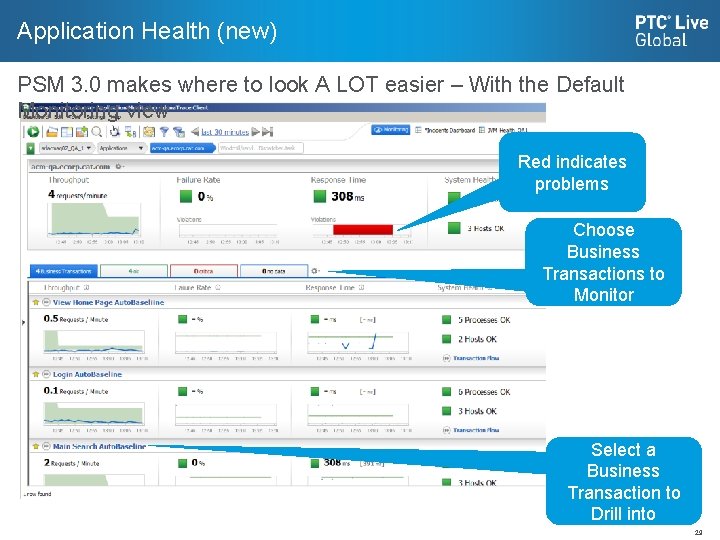
Application Health (new) PSM 3. 0 makes where to look A LOT easier – With the Default Monitoring view Red indicates problems Choose Business Transactions to Monitor Select a Business Transaction to Drill into 29

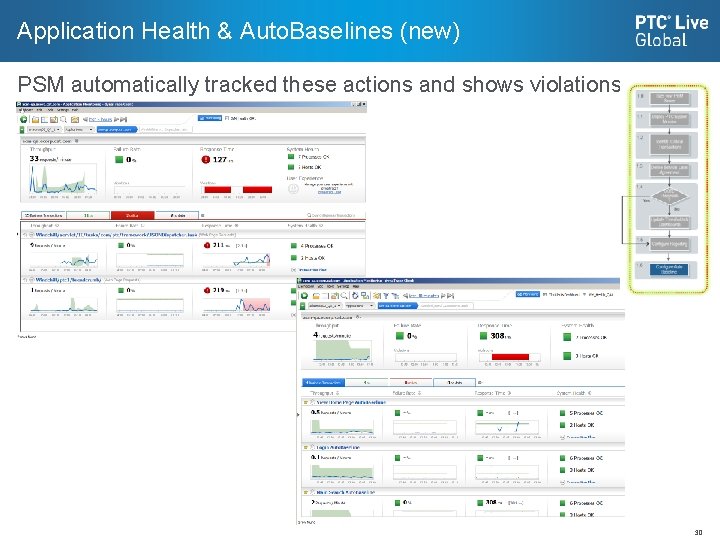
Application Health & Auto. Baselines (new) PSM automatically tracked these actions and shows violations occurring 30

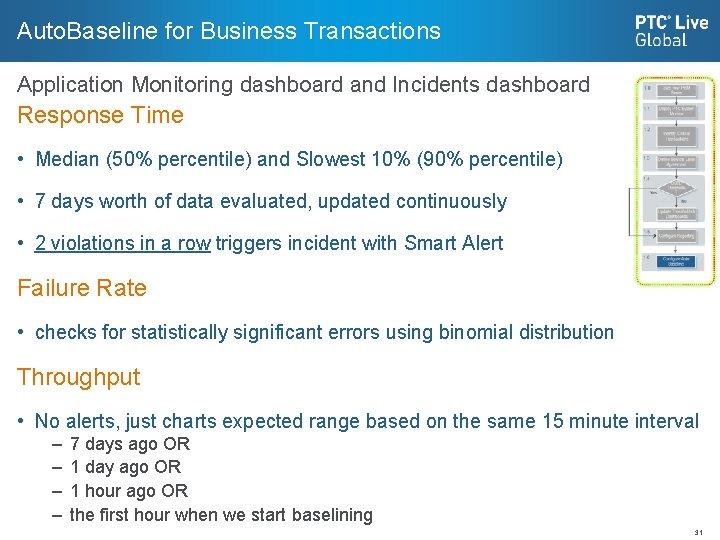
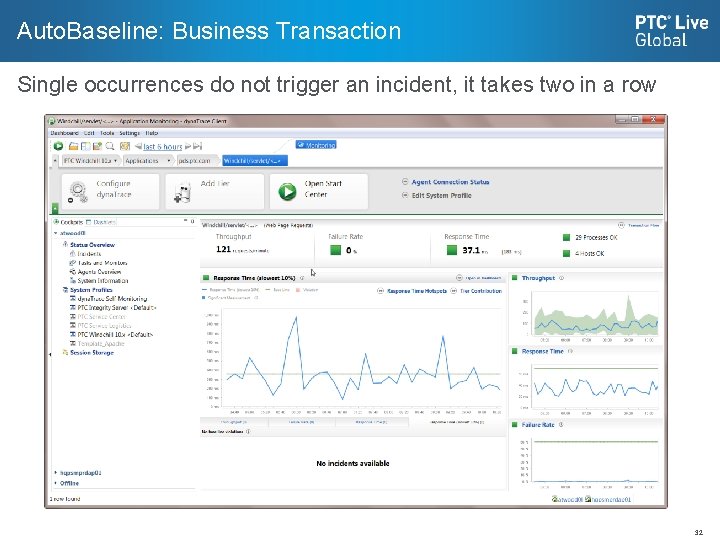
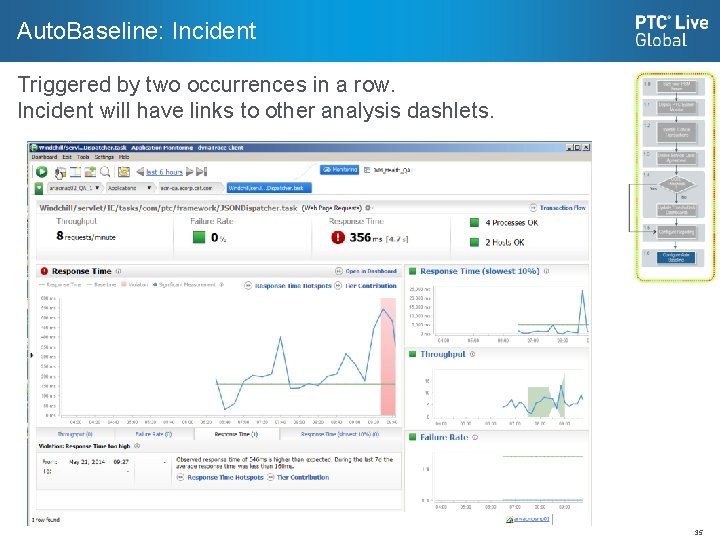
Auto. Baseline for Business Transactions Application Monitoring dashboard and Incidents dashboard Response Time • Median (50% percentile) and Slowest 10% (90% percentile) • 7 days worth of data evaluated, updated continuously • 2 violations in a row triggers incident with Smart Alert Failure Rate • checks for statistically significant errors using binomial distribution Throughput • No alerts, just charts expected range based on the same 15 minute interval – – 7 days ago OR 1 day ago OR 1 hour ago OR the first hour when we start baselining 31

Auto. Baseline: Business Transaction Single occurrences do not trigger an incident, it takes two in a row 32

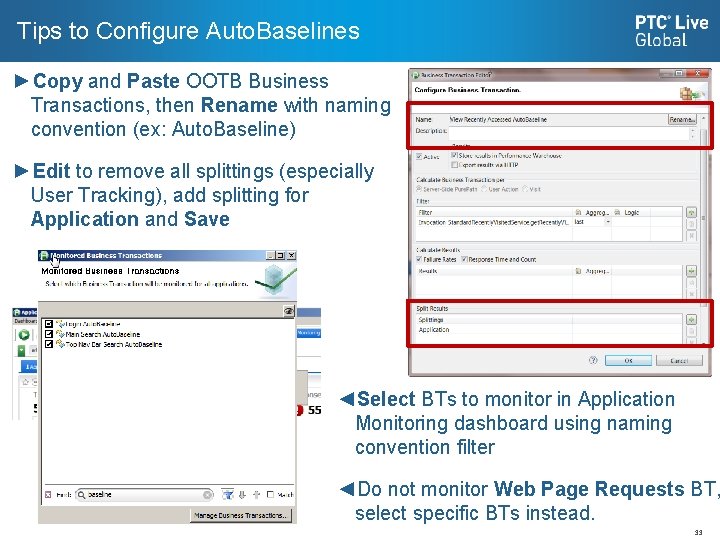
Tips to Configure Auto. Baselines ►Copy and Paste OOTB Business Transactions, then Rename with naming convention (ex: Auto. Baseline) ►Edit to remove all splittings (especially User Tracking), add splitting for Application and Save ◄Select BTs to monitor in Application Monitoring dashboard using naming convention filter ◄Do not monitor Web Page Requests BT, select specific BTs instead. 33

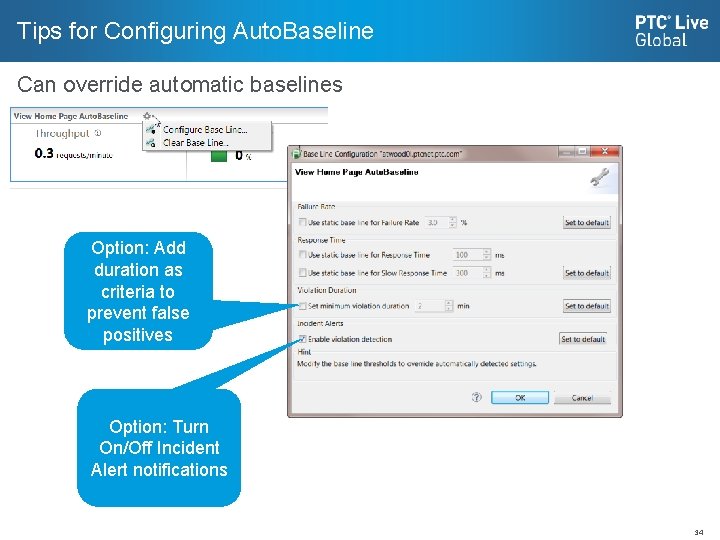
Tips for Configuring Auto. Baseline Can override automatic baselines Option: Add duration as criteria to prevent false positives Option: Turn On/Off Incident Alert notifications 34

Auto. Baseline: Incident Triggered by two occurrences in a row. Incident will have links to other analysis dashlets. 35

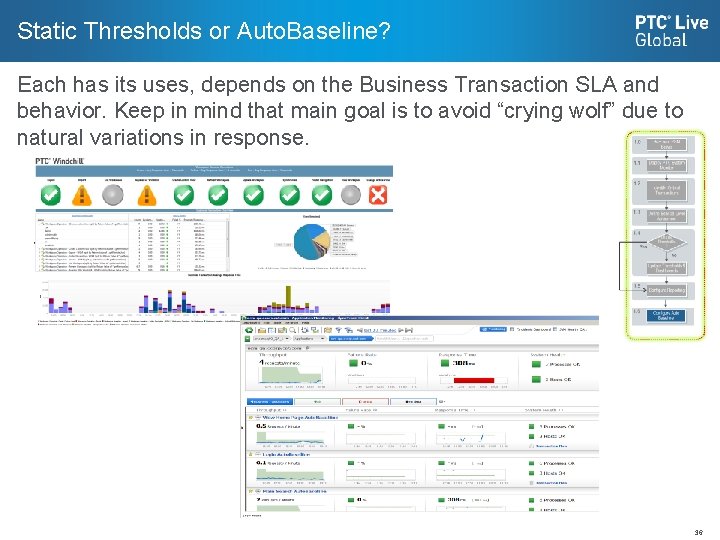
Static Thresholds or Auto. Baseline? Each has its uses, depends on the Business Transaction SLA and behavior. Keep in mind that main goal is to avoid “crying wolf” due to natural variations in response. 36

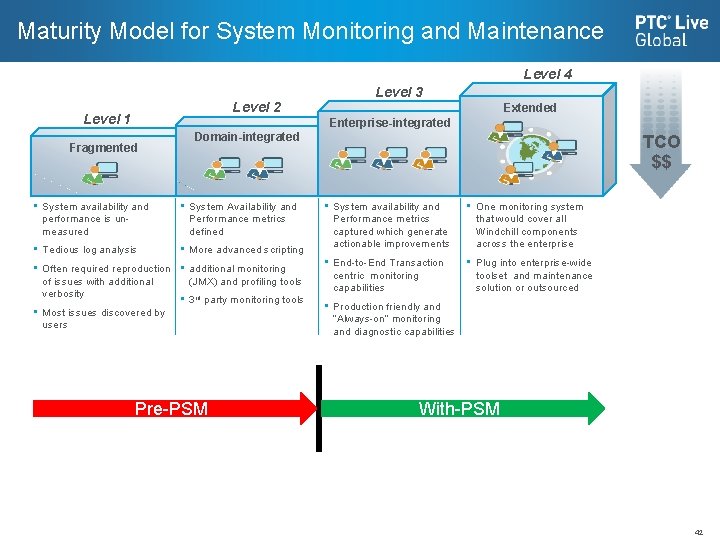
Maturity Model for System Monitoring and Maintenance Level 4 Level 2 Level 1 Level 3 Extended Enterprise-integrated Fragmented Domain-integrated • System availability and performance is unmeasured • System Availability and Performance metrics defined • Tedious log analysis • More advanced scripting • Often required reproduction • additional monitoring of issues with additional (JMX) and profiling tools verbosity • 3 rd party monitoring tools • Most issues discovered by users Pre-PSM TCO $$ • System availability and Performance metrics captured which generate actionable improvements • One monitoring system that would cover all Windchill components across the enterprise • End-to-End Transaction centric monitoring capabilities • Plug into enterprise-wide toolset and maintenance solution or outsourced • Production friendly and “Always-on” monitoring and diagnostic capabilities With-PSM 42

Summary • Many new features in PSM 3. 0 make Administrators’ lives easier • There are several key dashboards that are good starting places for both monitoring and digging into a problem • Utilize PSM diagnostic results to perform targeted searches of the TS Knowledge base • PSM can be configured to be more proactive using both new and existing features • Use both static thresholds (with new dashboards) and self-adjusting Auto. Baselines to proactively monitor the user transactions which are most important your company • Use Reports to monitor and track KPI’s (such as throughput and logins) and broadcast that information to key stakeholders 43

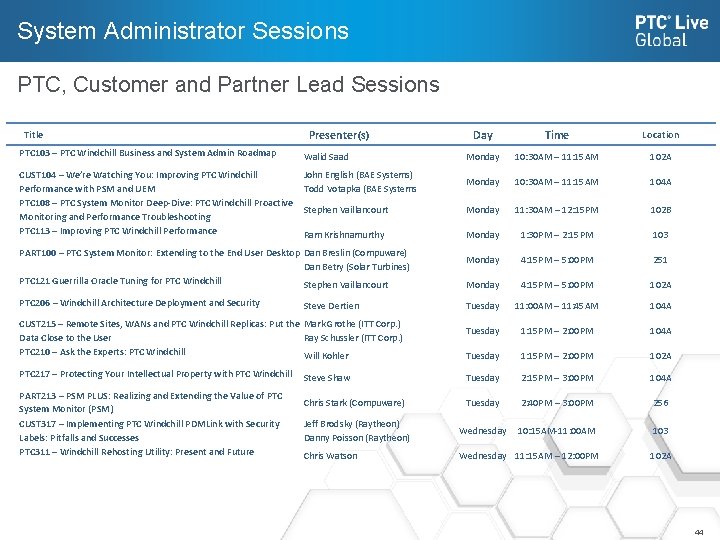
System Administrator Sessions PTC, Customer and Partner Lead Sessions Title Presenter(s) Day Time Location PTC 103 – PTC Windchill Business and System Admin Roadmap Walid Saad Monday 10: 30 AM – 11: 15 AM 102 A CUST 104 – We’re Watching You: Improving PTC Windchill Performance with PSM and UEM PTC 108 – PTC System Monitor Deep-Dive: PTC Windchill Proactive Monitoring and Performance Troubleshooting PTC 113 – Improving PTC Windchill Performance John English (BAE Systems) Todd Votapka (BAE Systems Monday 10: 30 AM – 11: 15 AM 104 A Stephen Vaillancourt Monday 11: 30 AM – 12: 15 PM 102 B Ram Krishnamurthy Monday 1: 30 PM – 2: 15 PM 103 Monday 4: 15 PM – 5: 00 PM 251 Monday 4: 15 PM – 5: 00 PM 102 A Tuesday 11: 00 AM – 11: 45 AM 104 A Tuesday 1: 15 PM – 2: 00 PM 102 A Steve Shaw Tuesday 2: 15 PM – 3: 00 PM 104 A Chris Stark (Compuware) Tuesday 2: 40 PM – 3: 00 PM 256 Jeff Brodsky (Raytheon) Danny Poisson (Raytheon) Wednesday 10: 15 AM-11: 00 AM 103 Chris Watson Wednesday 11: 15 AM – 12: 00 PM 102 A PART 100 – PTC System Monitor: Extending to the End User Desktop Dan Breslin (Compuware) Dan Betry (Solar Turbines) PTC 121 Guerrilla Oracle Tuning for PTC Windchill Stephen Vaillancourt PTC 206 – Windchill Architecture Deployment and Security Steve Dertien CUST 215 – Remote Sites, WANs and PTC Windchill Replicas: Put the Mark Grothe (ITT Corp. ) Data Close to the User Ray Schussler (ITT Corp. ) PTC 210 – Ask the Experts: PTC Windchill Will Kohler PTC 217 – Protecting Your Intellectual Property with PTC Windchill PART 213 – PSM PLUS: Realizing and Extending the Value of PTC System Monitor (PSM) CUST 317 – Implementing PTC Windchill PDMLink with Security Labels: Pitfalls and Successes PTC 311 – Windchill Rehosting Utility: Present and Future 44

liveglobal. ptc. com