Production Costs Perfect Competition Unit 3 Types of


: how much additional")


- Slides: 23
Production, Costs, & Perfect Competition Unit 3
Types of Production
Paper Chain Factories • Two loops of paper glued together make a chain. • The longer your chain, the more productive your factory and its workers are. • The goal of your paper chain factory, of course, is to make the longest chain possible in a fixed amount of time using a fixed amount of land capital, with labor as your only variable resource. • Resources • Land resources: Desks are your factory floor. Paper is your land resource. • Capital resources: Every factory needs tools. The tools you’ll have for this activity are two pairs of scissors and two glue. • Since this is a short-run simulation, the amount of land capital cannot be varied, therefore you may NOT use more scissors and glue as more workers join the production process. • Labor resources: These will consist of the members of your class. The simulation will start with just one worker, and in each successive round one additional worker will be added until at least eight members of your class have joined the factory floor.
Paper Chain Factories • Each round will be one minute with the timer on the board. • Each team will have a data collector. • At the beginning of each round, the data collector will record the number of workers under Quantity of Labor. • At the end of the minute the recorder must count the number of links in the chain, record it in the production table as TOTAL PRODUCT, and then take the chain and any links that were cut but not stapled aside in preparation for the next round. • With this information, the collector will now enter MARGINAL PRODUCT, which is the change in TP for each round. • As a team, determine the AVERAGE PRODUCT by dividing the tp by the quantity of the variable input.
Production & Costs • Law of Diminishing Marginal Returns – As variable resources are added to fixed resources, the additional output from each new worker will eventually fall.
Paper Chain Factories – Group Poster • With your productivity data tables complete, you will now plot your data for total, marginal and average product on a graph (use three different colors), with the quantity of labor on the x-axis and the firm’s output on the y-axis. • Answer the following questions with your group: 1. Analyze the relationships between total and marginal product. 2. Determine whether your paper chain factory ever experienced increasing returns and whether it ever experienced diminishing returns. 3. Discuss the reasons for the changes in total product during each round of production. 4. Discuss the meanings of marginal product and average product and determine how they changed as workers were added to your factory floor. 5. What is the relationship between marginal product and average product? 6. Decide whether the law of diminishing marginal returns applied to your factory. If so, why? If not, why not?
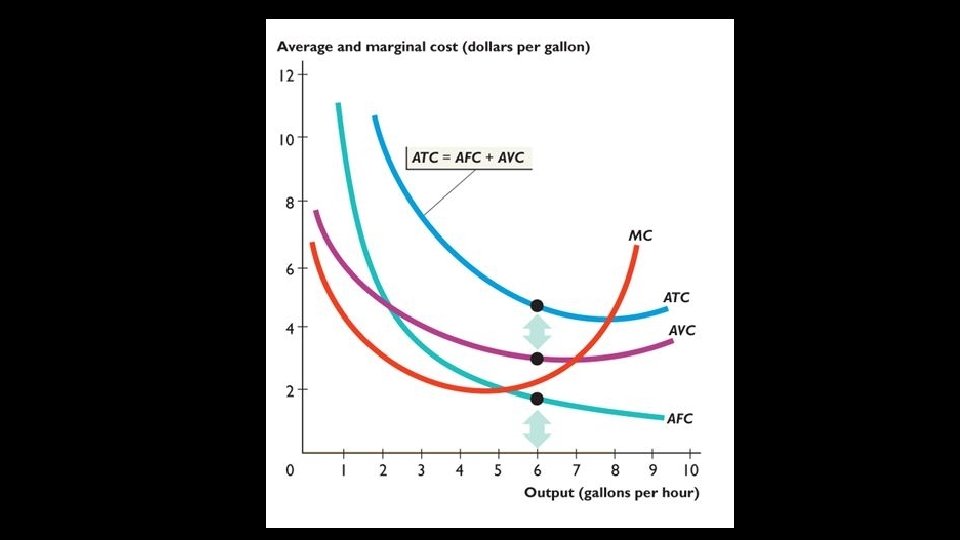
Relationships of various costs & products • When economists discuss costs, they are also incorporating opportunity costs! • This is called implicit cost • SO, economic profit is calculated by : revenue – (implicit cost + explicit cost) • This is different accounting profit, or assessment of cost, which only looks at explicit cost. • Fixed Costs: DO NOT CHANGE when more output is produced • Ex. Rent for a bakery • Ex. The payment on an oven • Variable Costs: DO CHANGE as more output is produced • Ex. Increase in bagels = increase in workers Fixed Costs + Variable Costs = Total Cost Bottle Deposits
Relationships of various costs & products Profits for Penny Blossoms •
Relationships of various costs & products • Marginal Product Curve (MPC): how much additional output is produced when an input is added by a firm Intersects The Average Product Curve (AP) at its max. points This can be found by TP/variable input used in production
Relationships of various costs & products •
Costs and production in the Short Run & Long Run • Short Run : at least one fixed resource • EX. Think back to the rent on the bakery location – if you can’t get out of your lease, you have to stay in the building, making one of your factors of production fixed. • Long Run : all resources are available • This changes the cost curves • There is no fixed cost • Firms are also unable to enter or leave an industry in the SR. TC, AC, & MC will be higher in the short run than in the long run if the fixed variable from is more than the cost-minimizing amount.
Costs and production in the Short Run & Long Run • Economies of scale: the range of output where the LRAC curve has a negative slope, indicating the cost per unit if falling. • Diseconomies of scale: the range of output where the LRAC is increasing.
Costs and production in the Short Run & Long Run • Why do we look at Economies of Scale? • Economies of scale show producers how they reduce their average costs of production if they were to expand (So, in the long run!). • If there is a lowering in the costs then the company if working with more productive efficiency. • MC = AC
Taxes & Cost Curves • Per Unit Tax - a tax on each additional unit of output • Ex : Excise Tax – placed on a specific product • A per unit tax would only increase if the amount of output increases. • What type of cost would this be? • Variable Cost - Average Fixed Cost would not change • MC, ATC, & AVC shift up • Lump Sum Tax – a fixed amount of tax regardless of output • What type of cost would this be? • Fixed Cost – Marginal cost and Average Variable Cost would not change • AFC and ATC shift
Perfect Competition
Characteristics of Perfect Competiton If economic profits exist, new firms will enter the market and drive profits downward to zero. If economic losses are being incurred, existing firms will exit the market and drive losses upward to zero. No individual firm, or consumer, can affect the market price of the product being sold, or bought. PRICE – TAKERS.
Perfect Competition • The equilibrium price is determined in the market and firms sell as much as they want at that price. • Ex. : Suppose the market price was $5. • If you could sell all you want at $5, raising your price to $5. 05 would be illogical when 1000’s of other identical sellers are charging $5. • If you lower your price to $4. 95, and you can sell all you want at $5, you’re losing profit.
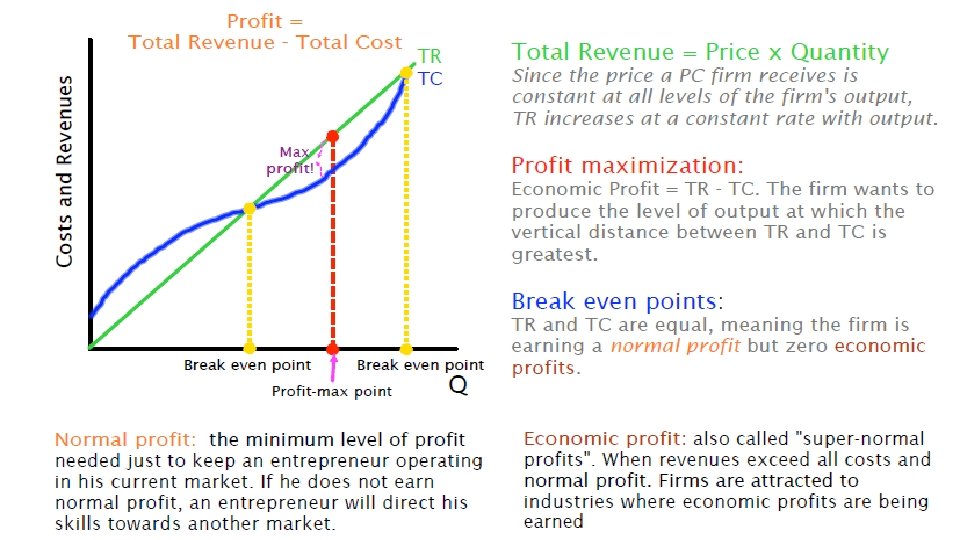
Perfect Competition - Firm In a perfectly competitive firm, the firms are PRICE TAKERS. Therefore demand is perfectly elastic. This also means this is the only price consumers are willing to accept D = MR (Marginal Revenue) Profit Maximization is at the point MR=MC
The Shut-Down Point • Shutdown is a short-run decision to not produce anything during a specific period. • Note: This is different from exiting the market! The intersection of the average variable cost curve and the marginal cost curve, which shows the price where the firm would lack enough revenue to cover its variable costs Shaded area = TFC So, if we look at the $8 price, this would be the shut down point because the company is no longer making enough to cover any of its fixed costs.
The Shut Down Point • Price < minimum average variable cost, then firm shuts down • If the perfectly competitive firm can charge a price above the shutdown point, then the firm is at least covering its average variable costs. • It is also making enough revenue to cover at least a portion of fixed costs • Even with SR losses, the losses will be smaller than if the firm shuts down immediately and incurs a loss equal to total fixed costs. • Price = minimum average variable cost, then firm stays in business • If the firm is receiving a price below the price at the shutdown point, then the firm is not even covering its variable costs. In this case, staying open is making the firm’s losses larger should shut down immediately.
Shut Down Point Example – Justin’s Yoga Shop • Justin has found a space to rent at $10, 000 a month. • If he stays open this month, he must hire yoga teachers. The cost to hire teachers for the month is $15, 000. • Justin has three scenarios, what should he do in each? • Justin forgot to advertise so he has 0 customers this month. • Justin advertised and had 1, 000 yogis visit at $10 a session in this month. • Justin’s reputation in the yoga world precedes him and he has 2, 000 yogis visit from all over the Triangle at $10 a session in this month.