PROCESSING OF DATA The collected data in research


 from which data")


- Slides: 19
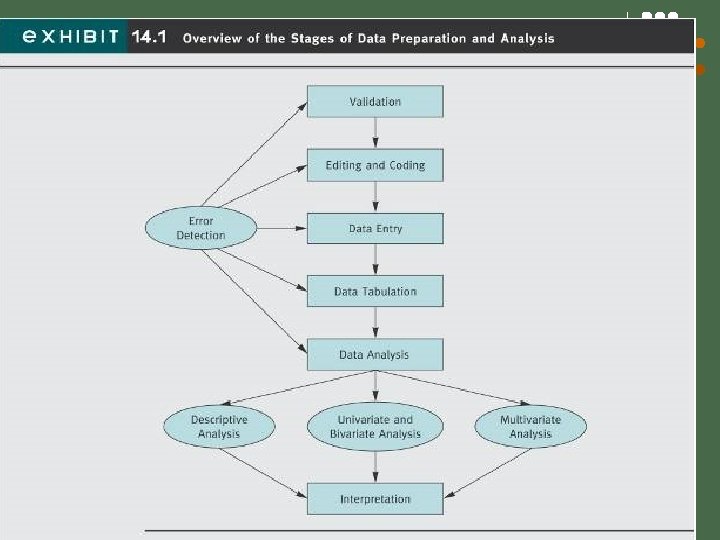
PROCESSING OF DATA The collected data in research is processed analyzed to come to some conclusions or to verify the hypothesis made. Processing of data is important as it makes further analysis of data easier and efficient. Processing of data technically means 1. Editing of the data 2. Coding of data 3. Classification of data 4. Tabulation of data.
EDITING: Data editing is a process by which collected data is examined to detect any errors or omissions and further these are corrected as much as possible before proceeding further. Editing is of two types: 1. Field Editing 2. Central Editing.
FIELD EDITING: This is a type of editing that relates to abbreviated or illegible written form of gathered data. Such editing is more effective when done on same day or the very next day after the interview. The investigator must not jump to conclusion while doing field editing. CENTRAL EDITING: Such type of editing relates to the time when all data collection process has been completed. Here a single or common editor corrects the errors like entry in the wrong place, entry in wrong unit e. t. c. As a rule all the wrong answers should be dropped from the final results.
EDITING REQUIRES SOME CAREFUL CONSIDERATIONS: l l Editor must be familiar with the interviewer’s mind set, objectives and everything related to the study. Different colors should be used when editors make entry in the data collected. They should initial all answers or changes they make to the data. The editors name and date of editing should be placed on the data sheet.
CODING: ØClassification of responses may be done on the basis of one or more common concepts. ØIn coding a particular numeral or symbol is assigned to the answers in order to put the responses in some definite categories or classes. ØThe classes of responses determined by the researcher should be appropriate and suitable to the study. ØCoding enables efficient and effective analysis as the responses are categorized into meaningful classes. ØCoding decisions are considered while developing or designing the questionnaire or any other data collection tool. ØCoding can be done manually or through computer.
CLASSIFICATION: Ø Classification of the data implies that the collected raw data is categorized into common group having common feature. Ø Data having common characteristics are placed in a common group. Ø The entire data collected is categorized into various groups or classes, which convey a meaning to the researcher. Classification is done in two ways: 1. Classification according to attributes. 2. Classification according to the class intervals.
CLASSIFICATION ACCORDING THE ATTRIBUTES: ØHere the data is classified on the basis of common characteristics that can be descriptive like literacy, sex, honesty, marital status e. t. c. or numeral like weight, height, income e. t. c. ØDescriptive features are qualitative in nature and cannot be measured quantitatively but are kindly considered while making an analysis. ØAnalysis used for such classified data is known as statistics of attributes and the classification is known as the classification according to the attributes.
CLASSIFICATION ON THE BASIS OF THE INTERVAL: The numerical feature of data can be measured quantitatively and analyzed with the help of some statistical unit like the data relating to income, production, age, weight e. t. c. come under this category. This type of data is known as statistics of variables and the data is classified by way of intervals. CLASSIFICATION ACCORDING TO THE CLASS INTERVAL USUALLY INVOLVES THE FOLLOWING THREE MAIN PROBLEMS: 1. Number of Classes. 2. How to select class limits. 3. How to determine the frequency of each class.
TABULATION: The mass of data collected has to be arranged in some kind of concise and logical order. Tabulation summarizes the raw data and displays data in form of some statistical tables. Tabulation is an orderly arrangement of data in rows and columns. OBJECTIVE OF TABULATION: 1. Conserves space & minimizes explanation and descriptive statements. 2. Facilitates process of comparison and summarization. 3. Facilitates detection of errors and omissions. 4. Establish the basis of various statistical computations.
BASIC PRINCIPLES OF TABULATION: 1. Tables should be clear, concise & adequately titled. 2. Every table should be distinctly numbered for easy reference. 3. Column headings & row headings of the table should be clear & brief. 4. Units of measurement should be specified at appropriate places. 5. Explanatory footnotes concerning the table should be placed at appropriate places. 6. Source of information of data should be clearly indicated.
7. The columns & rows should be clearly separated with dark lines 8. Demarcation should also be made between data of one class and that of another. 9. Comparable data should be put side by side. 10. The figures in percentage should be approximated before tabulation. 11. The alignment of the figures, symbols etc. should be properly aligned and adequately spaced to enhance the readability of the same. 12. Abbreviations should be avoided.
Discuss techniques used for data tabulation and data analysis Data Tabulation l One-way frequency table– l l the number of respondents who responded to each possible response to a questions given the available alternatives One-way Frequency Table Identify l l l Missing data Determining valid percentages Summary statistics 13
ANALYSIS OF DATA The important statistical measures that are used to analyze the research or the survey are: 1. Measures of central tendency(mean, median & mode) 2. Measures of dispersion(standard deviation, range, mean deviation) 3. Measures of asymmetry(skew ness) 4. Measures of relationship etc. ( correlation and regression) 5. Association in case of attributes. 6. Time series Analysis
TESTING THE HYPOTHESIS Several factor are considered into the determination of the appropriate statistical technique to use when conducting a hypothesis tests. The most important are as: 1. The type of data being measured. 2. The purpose or the objective of the statistical inference. Hypothesis can be tested by various techniques. The hypothesis testing techniques are divided into two broad categories: 1. Parametric Tests. 2. Non- Parametric Tests.
PARAMETRIC TESTS: These tests depends upon assumptions typically that the population(s) from which data are randomly sampled have a normal distribution. Types of parametric tests are: 1. t- test 2. z- test 3. F- test 4. 2 - test
NON PARAMETRIC TESTS The various types of Non Parametric Tests are: 1. Wilcox on Signed Rank Test ( for comparing two population) 2. Kolmogorov Smirnov Test( to test whether or not the sample of data is consistent with a specified distribution function) 3. Runs Tests (in studies where measurements are made according to some well defined ordering, either in time or space, a frequent question is whether or not the average value of the measurement is different points in the sequence. This test provides a means of testing this. 4. Sign Test (this is single sample test that can be used instead of the single sample t- test or paired t- test.
INTERPRETATION: Interpretation is the relationship amongst the collected data, with analysis. Interpretation looks beyond the data of the research and includes researches, theory and hypothesis. Interpretation in a way act as a tool to explain the observations of the researcher during the research period and it acts as a guide for future researches. WHY Interpretation? -the researcher understands the abstract principle underlying the findings. -Interpretation links up the findings with those of other similar studies. -The researcher is able to make others understand the real importance of his research findings.
PRECAUTIONS IN INTERPRETATION: 1. Researcher must ensure that the data is appropriate, trust worthy and adequate for drawing inferences. 2. Researcher must be cautious about errors and take due necessary actions if the error arises 3. Researcher must ensure the correctness of the data analysis process whether the data is qualitative or quantitative. 4. Researcher must try to bring out hidden facts and un obvious factors and facts to the front and combine it with the factual interpretation. 5. The researcher must also ensure that there should be constant interaction between initial hypothesis, empirical observations, and theoretical concepts.