PPF a tool to study solar irradiation and
- Slides: 19
PPF: a tool to study solar irradiation and illuminance in urban areas Raphaël Compagnon (September 2002) Developed in the framework of the European project: PRECis: Assessing the Potential for Renewable Energy in Cities
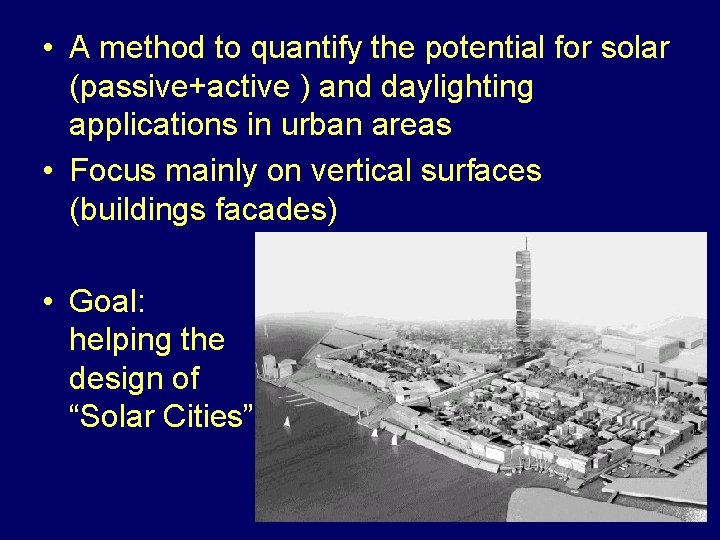
• A method to quantify the potential for solar (passive+active ) and daylighting applications in urban areas • Focus mainly on vertical surfaces (buildings facades) • Goal: helping the design of “Solar Cities”
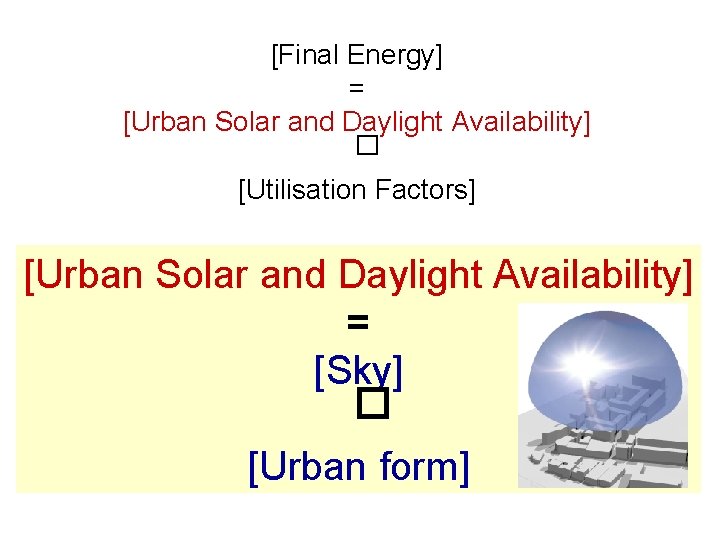
[Final Energy] = [Urban Solar and Daylight Availability] � [Utilisation Factors] [Urban Solar and Daylight Availability] = [Sky] � [Urban form]
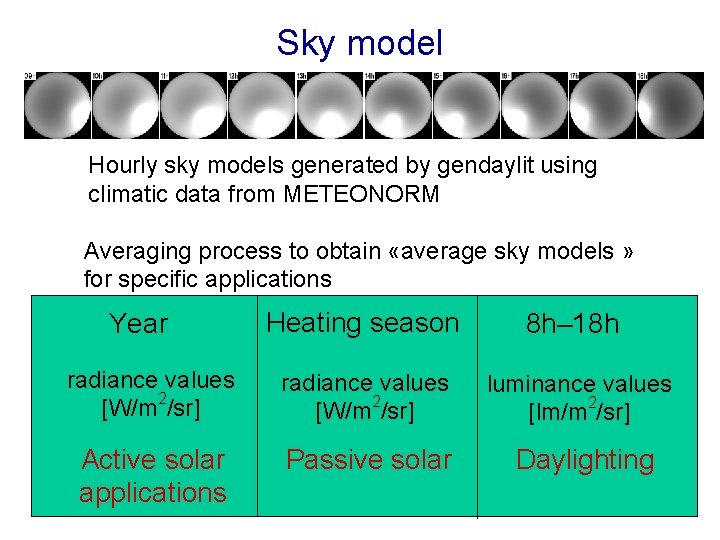
Sky model Hourly sky models generated by gendaylit using climatic data from METEONORM Averaging process to obtain «average sky models » for specific applications Heating season 8 h– 18 h radiance values [W/m 2/sr] luminance values [lm/m 2/sr] Active solar applications Passive solar Daylighting Year
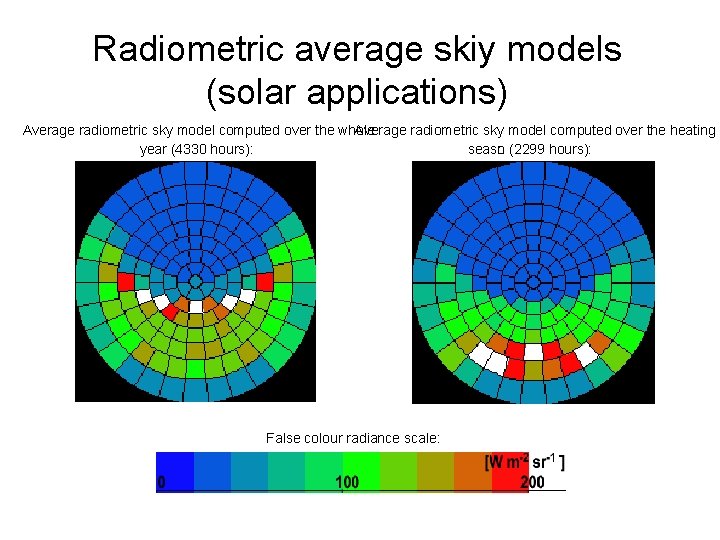
Radiometric average skiy models (solar applications) Average radiometric sky model computed over the whole Average radiometric sky model computed over the heating year (4330 hours): seaso n (2299 hours): False colour radiance scale:
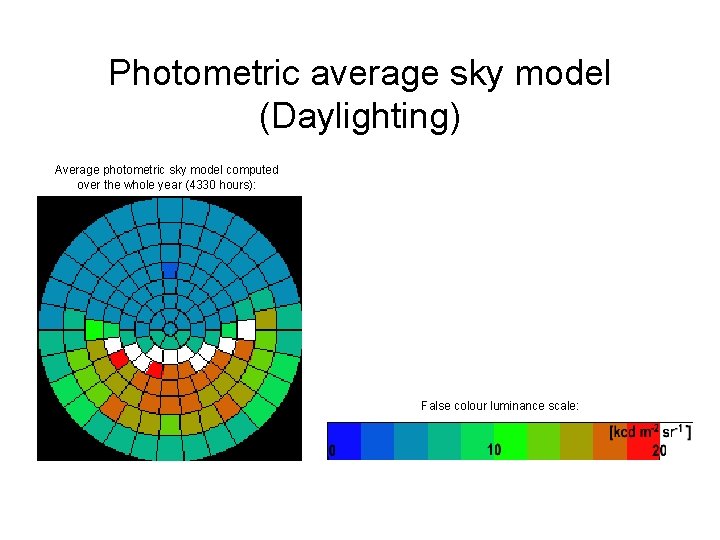
Photometric average sky model (Daylighting) Average photometric sky model computed over the whole year (4330 hours): False colour luminance scale:
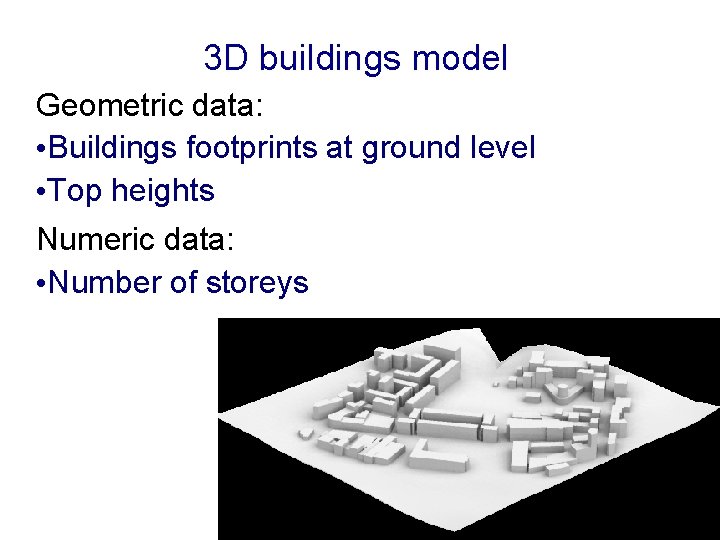
3 D buildings model Geometric data: • Buildings footprints at ground level • Top heights Numeric data: • Number of storeys
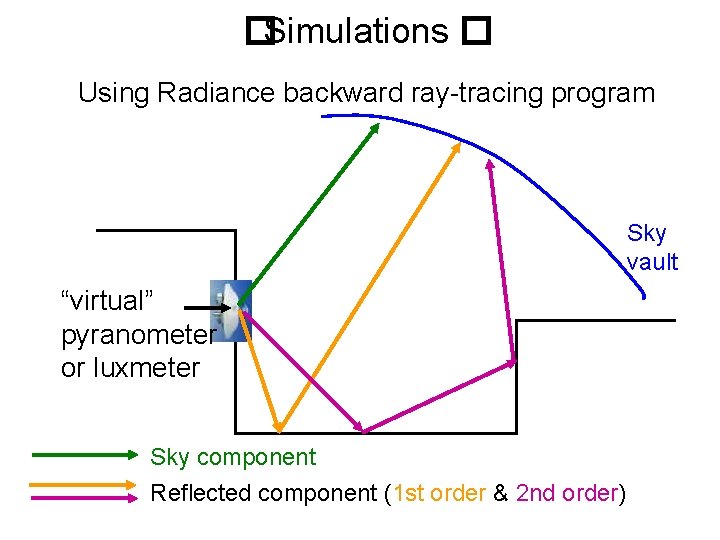
� Simulations � Using Radiance backward ray-tracing program Sky vault “virtual” pyranometer or luxmeter Sky component Reflected component (1 st order & 2 nd order)
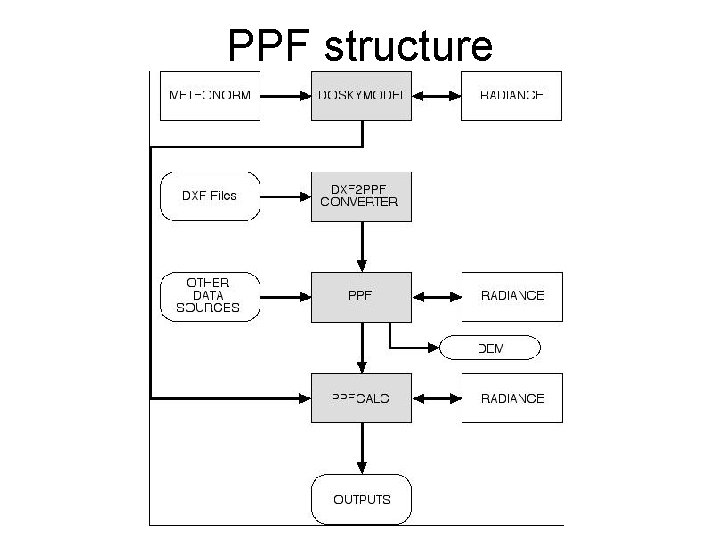
PPF structure
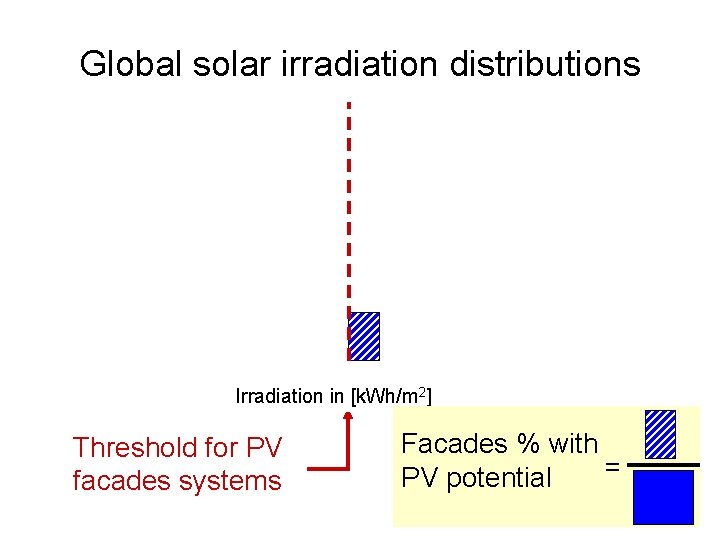
Global solar irradiation distributions Irradiation in [k. Wh/m 2] Threshold for PV facades systems Facades % with = PV potential
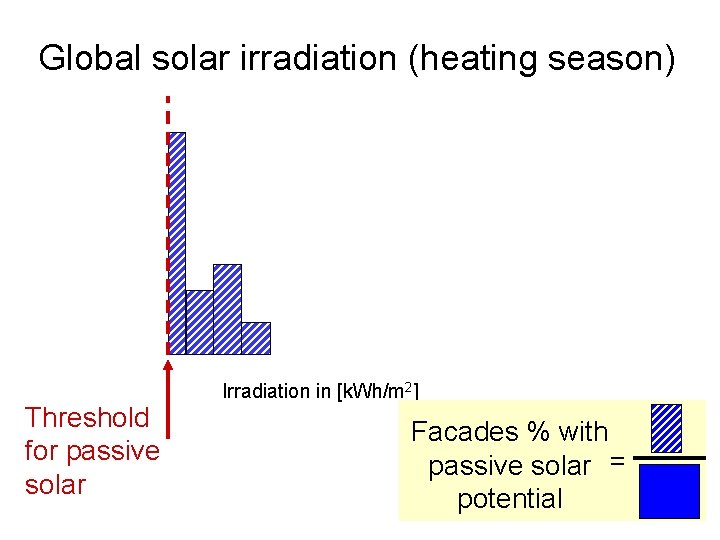
Global solar irradiation (heating season) Threshold for passive solar Irradiation in [k. Wh/m 2] Facades % with passive solar = potential
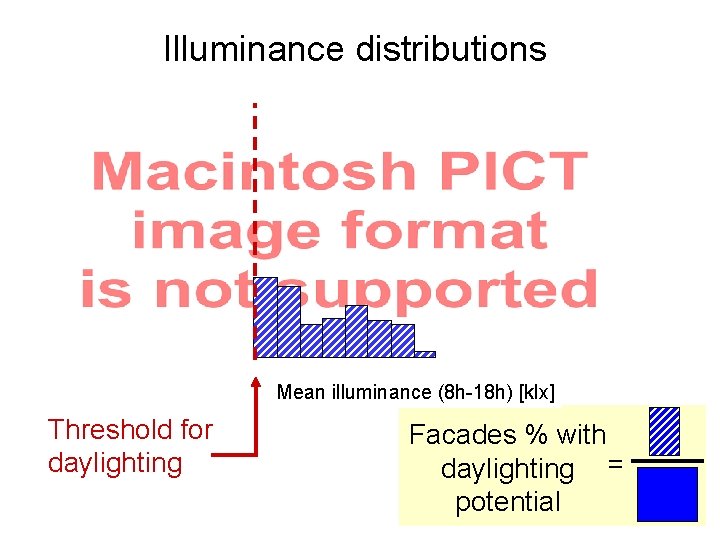
Illuminance distributions Mean illuminance (8 h-18 h) [klx] Threshold for daylighting Facades % with daylighting = potential
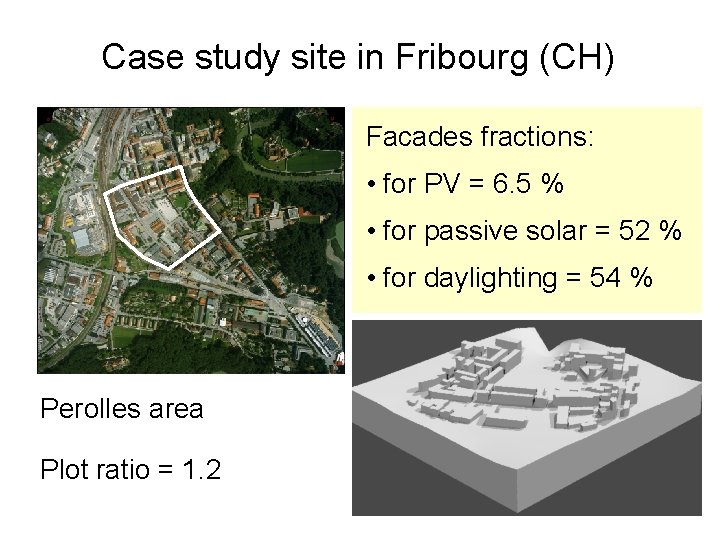
Case study site in Fribourg (CH) Facades fractions: • for PV = 6. 5 % • for passive solar = 52 % • for daylighting = 54 % Perolles area Plot ratio = 1. 2
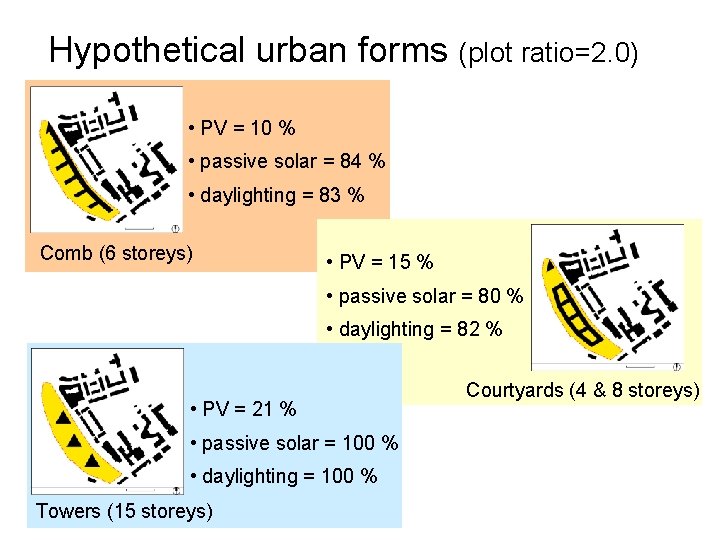
Hypothetical urban forms (plot ratio=2. 0) • PV = 10 % • passive solar = 84 % • daylighting = 83 % Comb (6 storeys) • PV = 15 % • passive solar = 80 % • daylighting = 82 % • PV = 21 % • passive solar = 100 % • daylighting = 100 % Towers (15 storeys) Courtyards (4 & 8 storeys)
Climatically independent characteristics Outdoor daylight factors (CIE overcast sky) Sky view factors (SVF)
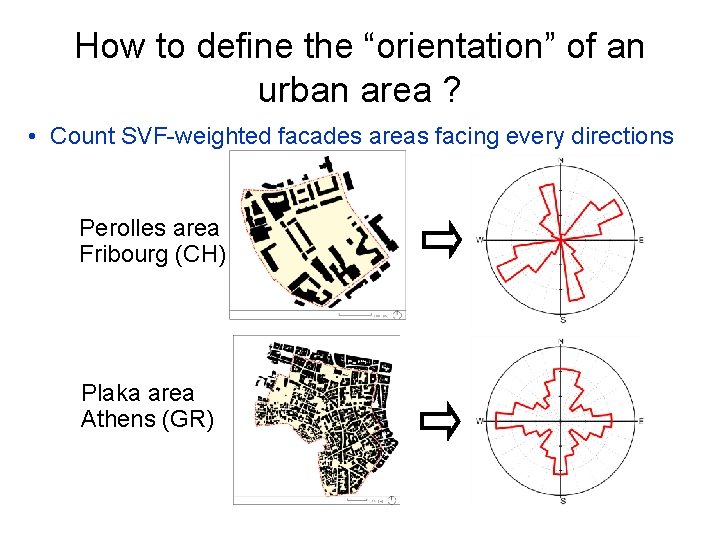
How to define the “orientation” of an urban area ? • Count SVF-weighted facades areas facing every directions Perolles area Fribourg (CH) Plaka area Athens (GR)
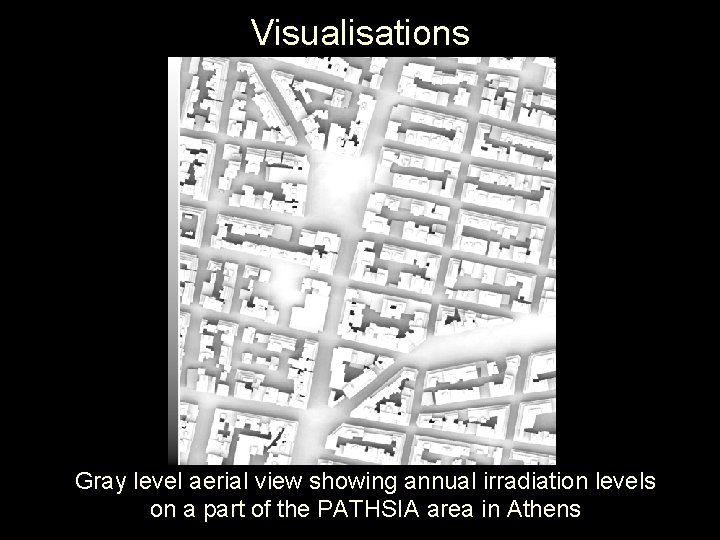
Visualisations Gray level aerial view showing annual irradiation levels on a part of the PATHSIA area in Athens
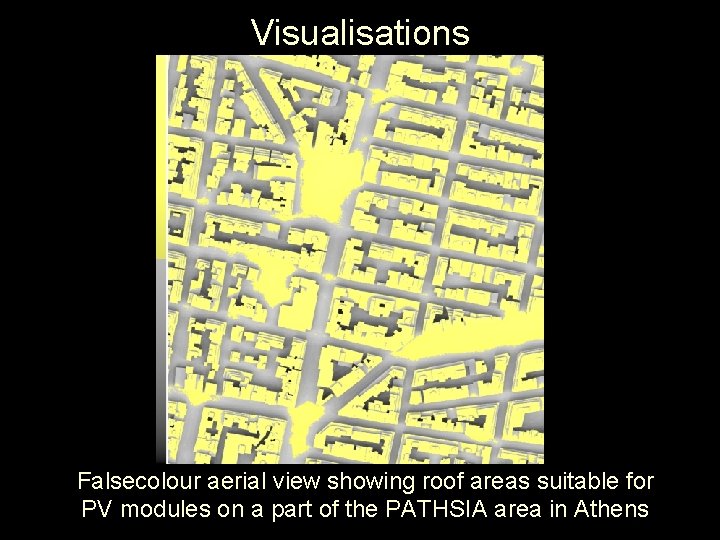
Visualisations Falsecolour aerial view showing roof areas suitable for PV modules on a part of the PATHSIA area in Athens
Conclusions • PPF allows to compute irradiation and illuminance distributions over large urban areas • Already used for several case studies • PPF used as a tool for ongoing projects in collaboration with EPFL • New extensions planned for urban open space analysis