
Chapter 01 Economics The Study of Opportunity Cost



- Slides: 22
Chapter 01 Economics: The Study of Opportunity Cost Mc. Graw-Hill/Irwin Copyright © 2012 by The Mc. Graw-Hill Companies, Inc. All rights reserved.
Chapter Outline • Economics And Opportunity Cost • Modeling Opportunity Cost Using A Production Possibilities Frontier • Attributes Of The Production Possibilities Frontier • The Big Picture • Thinking Economically • Kick It Up A Notch: Demonstrating Constant And Increasing Opportunity Cost on a Production Possibilities Frontier 1 -2
Economics and Opportunity Cost • Economics: the study of the allocation and use of scarce resources to satisfy unlimited human wants 1 -3
Choices Have Consequences • Opportunity Cost • The forgone alternative of the choice made Or • What you would have done had you not done what you did. 1 -4
Modeling Opportunity Cost Using a Production Possibilities Frontier Definitions • PPF: a graph which relates the amounts of different goods that can be produced in a fully employed society • Model: a simplification of the real world that we can manipulate to explain the real world • Simplifying Assumption: an assumption that may, on its face, be silly but allows for a clearer explanation • Scarce: not freely available and infinite • Resources: anything we either consume directly or use to make things that we will ultimately consume 1 -5
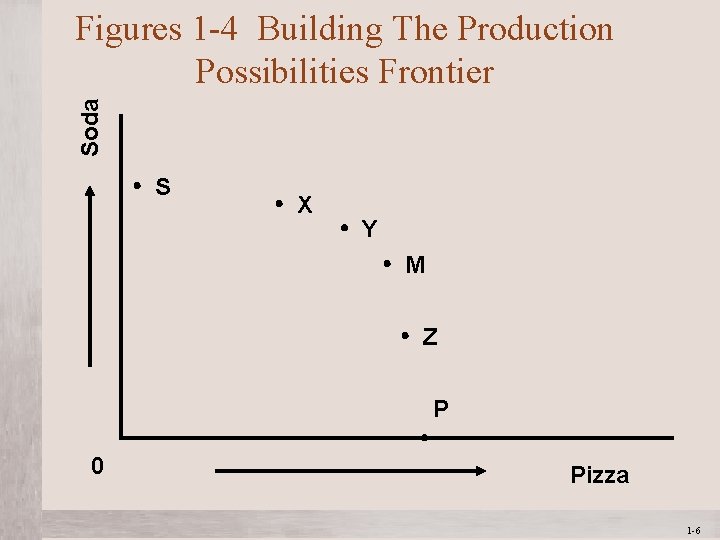
Soda Figures 1 -4 Building The Production Possibilities Frontier S X Y M Z P 0 Pizza 1 -6
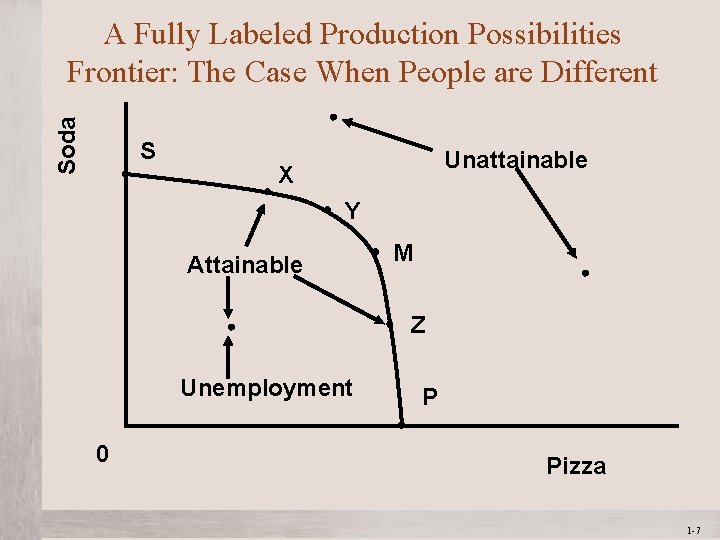
Soda A Fully Labeled Production Possibilities Frontier: The Case When People are Different S Unattainable X Y Attainable M Z Unemployment 0 P Pizza 1 -7
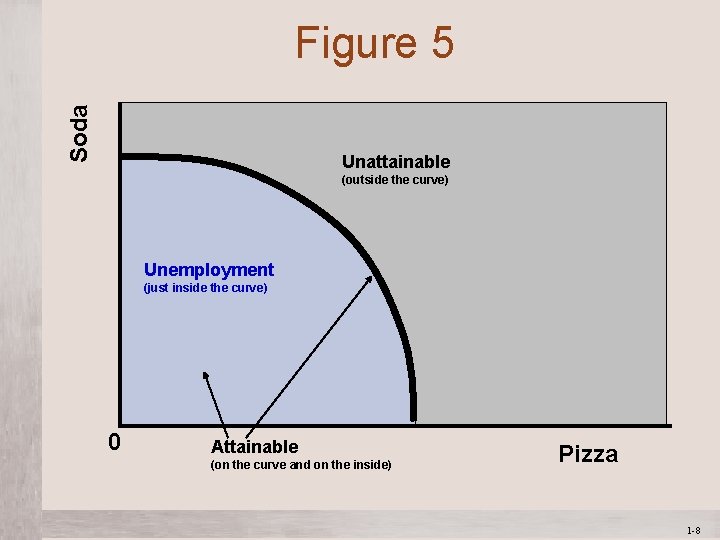
Soda Figure 5 Unattainable (outside the curve) Unemployment (just inside the curve) 0 Attainable (on the curve and on the inside) Pizza 1 -8
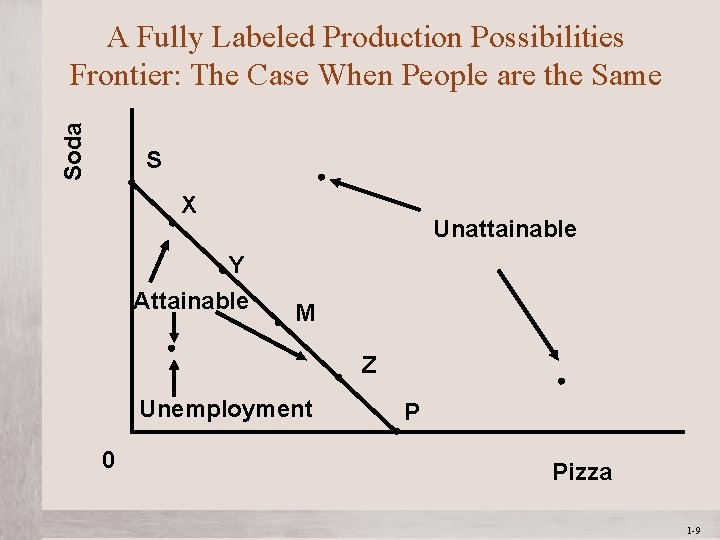
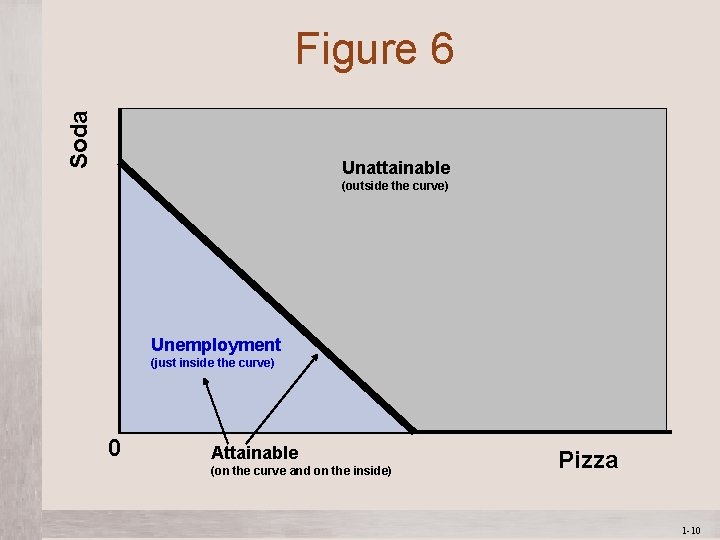
Soda A Fully Labeled Production Possibilities Frontier: The Case When People are the Same S X Y Attainable Unattainable M Z Unemployment 0 P Pizza 1 -9
Soda Figure 6 Unattainable (outside the curve) Unemployment (just inside the curve) 0 Attainable (on the curve and on the inside) Pizza 1 -10
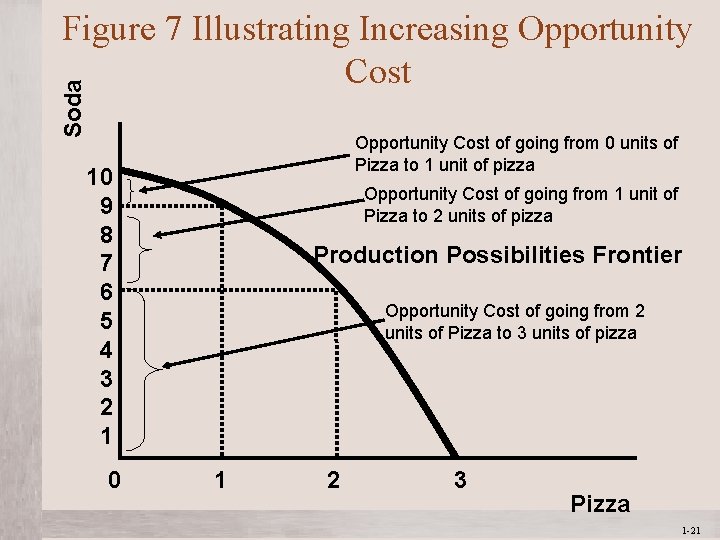
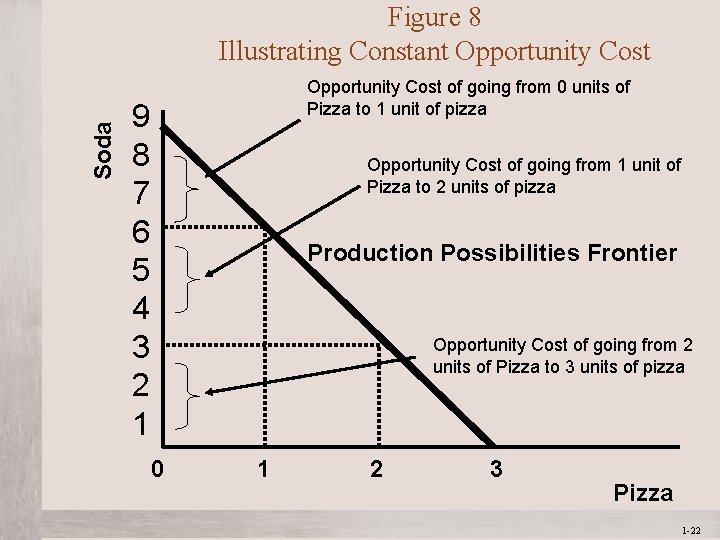
Increasing and Constant Opportunity Cost • Increasing Opportunity Cost • Exists when the additional resources required to produce an additional unit grows as more output is produced. • Likely to occur when people are different in their skills. • Constant Opportunity Cost • Exists when the additional resources required to produce an additional unit remains the same as more output is produced. • Likely to occur when people are identical in their skills. 1 -11
The Big Picture • circular flow model: A model that shows the interactions of all economic actors • Markets are where the interactions take place • Actors are the entities interacting 1 -12
Markets in a Circular Flow Diagram • Market: Any mechanism by which buyers and sellers negotiate an exchange • Factor Market: A mechanism by which buyers and sellers of labor and financial capital negotiate an exchange. • Goods and Services Market: A mechanism by which buyers and sellers of goods and services negotiate an exchange. • Foreign Exchange Market: A mechanism by which buyers and sellers of the currencies of various countries negotiate an exchange. 1 -13
Actors in a Circular Flow Diagram • Households • Firms • Government 1 -14
The Circular Flow Diagram 1 -15
Thinking Economically: Marginal Analysis • Optimization Assumption: an assumption that suggests that the person in question is trying to maximize some objective • Marginal Benefit: the increase in the benefit that results from an action • Marginal Cost: the increase in the cost that results from an action • Net Benefit: the difference between all benefits and all costs 1 -16
Positive and Normative Analysis • Positive Analysis: a form of analysis that seeks to understand the way things are and why they are that way • Normative Analysis: a form of analysis that seeks to understand the ways things should be 1 -17
Economics Incentives • Incentive: something that influences the decisions we make • Examples: prices influence the amount we buy; taxes influence how much we work and save 1 -18
Logical Flaws • Fallacy of Composition: the mistake in logic that suggests that the total economic impact of something is always and simply equal to the sum of the individual parts • Correlation = Causation: the mistake that suggests that because two variables are correlated that one caused the other to happen. 1 -19
Kick it Up a Notch Demonstrating Increasing and Constant Opportunity Cost 1 -20
Soda Figure 7 Illustrating Increasing Opportunity Cost of going from 0 units of Pizza to 1 unit of pizza 10 9 8 7 6 5 4 3 2 1 0 Opportunity Cost of going from 1 unit of Pizza to 2 units of pizza Production Possibilities Frontier Opportunity Cost of going from 2 units of Pizza to 3 units of pizza 1 2 3 Pizza 1 -21
Soda Figure 8 Illustrating Constant Opportunity Cost of going from 0 units of Pizza to 1 unit of pizza 9 8 7 6 5 4 3 2 1 Opportunity Cost of going from 1 unit of Pizza to 2 units of pizza Production Possibilities Frontier Opportunity Cost of going from 2 units of Pizza to 3 units of pizza 0 1 2 3 Pizza 1 -22