
SUMMIT COUNTY Solar Photovoltaic Feasibility Study Dr Maud
SUMMIT COUNTY Solar Photovoltaic Feasibility Study Dr Maud de Bel maud@bacgen. com C: 206 -459 -9418 November 14, 2016
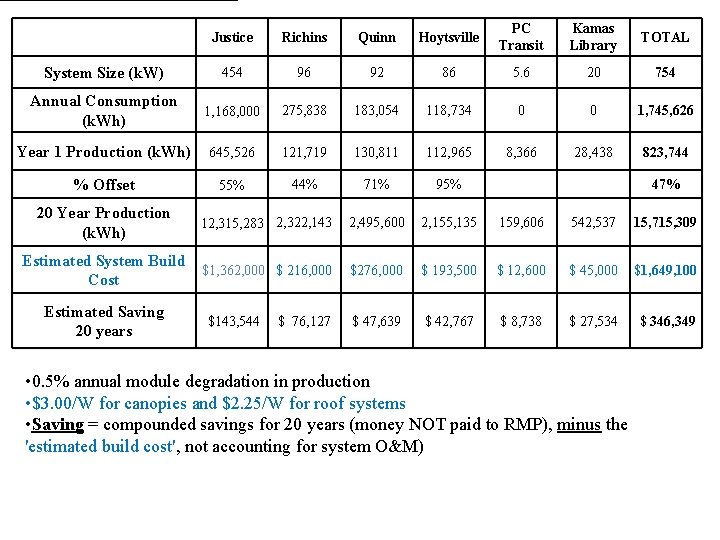
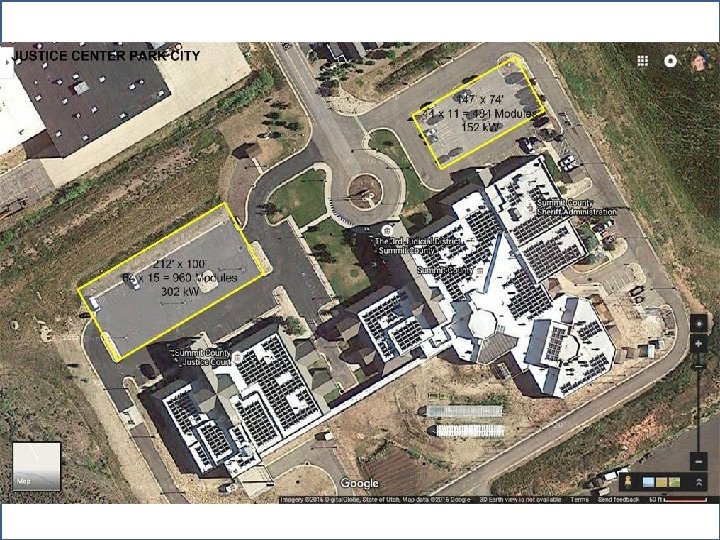
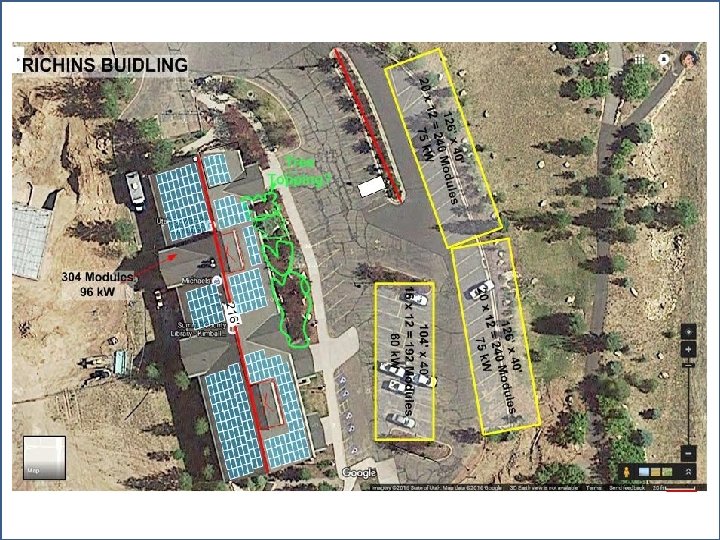
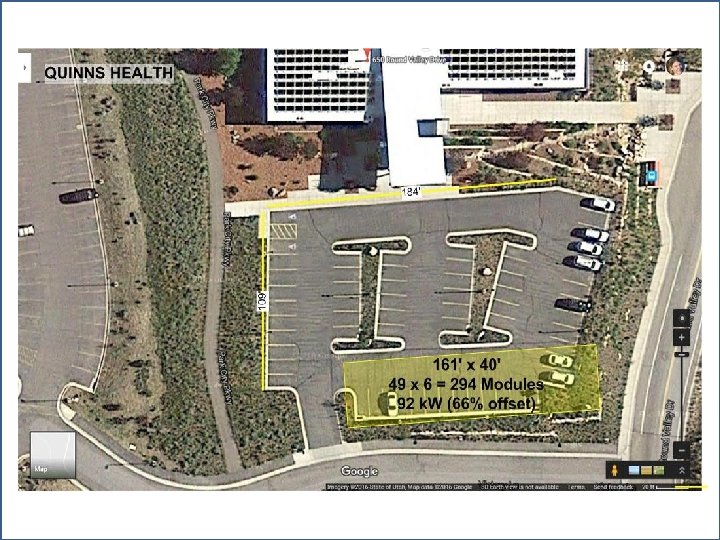
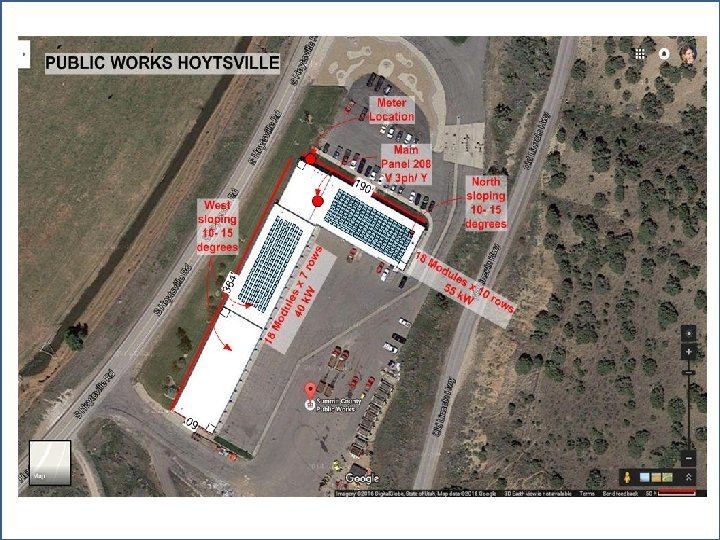
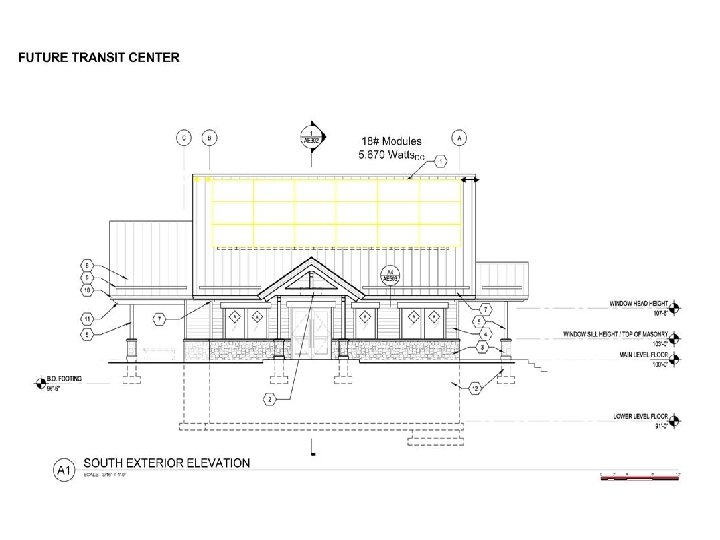
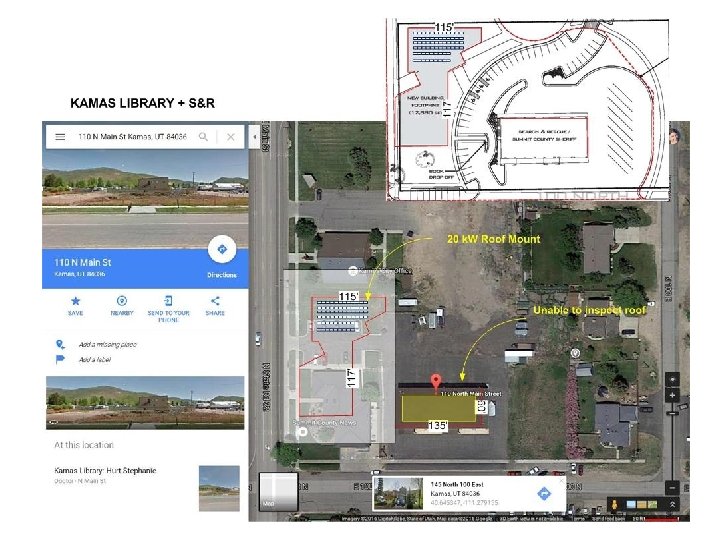
Justice Richins Quinn Hoytsville PC Transit Kamas Library TOTAL System Size (k. W) 454 96 92 86 5. 6 20 754 Annual Consumption (k. Wh) 1, 168, 000 275, 838 183, 054 118, 734 0 0 1, 745, 626 Year 1 Production (k. Wh) 645, 526 121, 719 130, 811 112, 965 8, 366 28, 438 823, 744 % Offset 55% 44% 71% 95% 12, 315, 283 2, 322, 143 2, 495, 600 2, 155, 135 159, 606 542, 537 15, 715, 309 Estimated System Build $1, 362, 000 $ 216, 000 Cost $276, 000 $ 193, 500 $ 12, 600 $ 45, 000 $1, 649, 100 $ 47, 639 $ 42, 767 $ 8, 738 $ 27, 534 $ 346, 349 20 Year Production (k. Wh) Estimated Saving 20 years $143, 544 $ 76, 127 47% • 0. 5% annual module degradation in production • $3. 00/W for canopies and $2. 25/W for roof systems • Saving = compounded savings for 20 years (money NOT paid to RMP), minus the 'estimated build cost', not accounting for system O&M)
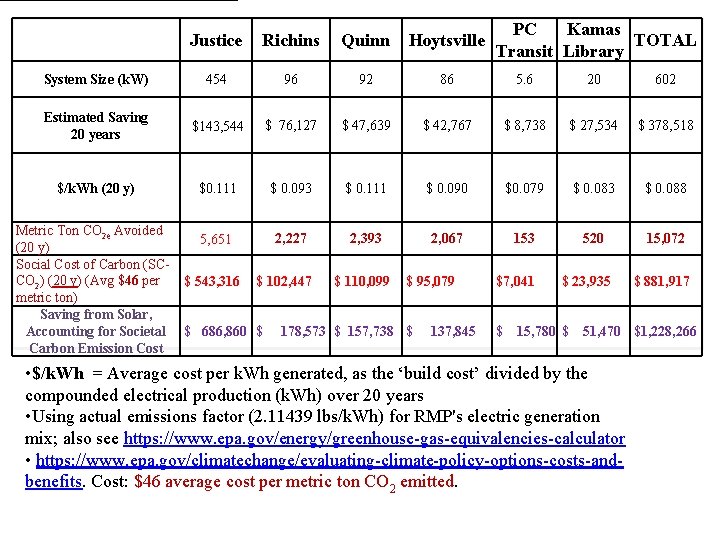
PC Kamas TOTAL Transit Library Justice Richins Quinn Hoytsville System Size (k. W) 454 96 92 86 5. 6 20 602 Estimated Saving 20 years $143, 544 $ 76, 127 $ 47, 639 $ 42, 767 $ 8, 738 $ 27, 534 $ 378, 518 $/k. Wh (20 y) $0. 111 $ 0. 093 $ 0. 111 $ 0. 090 $0. 079 $ 0. 083 $ 0. 088 Metric Ton CO 2 e Avoided 2, 227 2, 393 2, 067 153 520 15, 072 5, 651 (20 y) Social Cost of Carbon (SCCO 2) (20 y) (Avg $46 per $ 543, 316 $ 102, 447 $ 110, 099 $ 95, 079 $7, 041 $ 23, 935 $ 881, 917 metric ton) Saving from Solar, Accounting for Societal $ 686, 860 $ 178, 573 $ 157, 738 $ 137, 845 $ 15, 780 $ 51, 470 $1, 228, 266 Carbon Emission Cost • $/k. Wh = Average cost per k. Wh generated, as the ‘build cost’ divided by the compounded electrical production (k. Wh) over 20 years • Using actual emissions factor (2. 11439 lbs/k. Wh) for RMP's electric generation mix; also see https: //www. epa. gov/energy/greenhouse-gas-equivalencies-calculator • https: //www. epa. gov/climatechange/evaluating-climate-policy-options-costs-andbenefits. Cost: $46 average cost per metric ton CO 2 emitted.
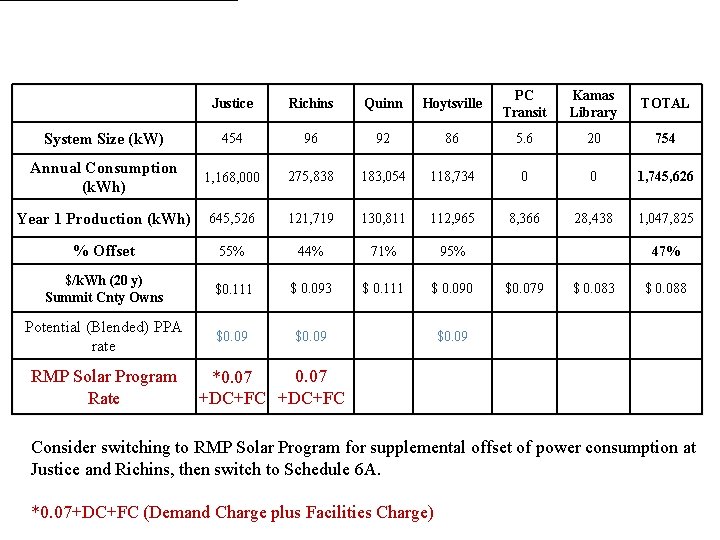
Justice Richins Quinn Hoytsville PC Transit Kamas Library TOTAL System Size (k. W) 454 96 92 86 5. 6 20 754 Annual Consumption (k. Wh) 1, 168, 000 275, 838 183, 054 118, 734 0 0 1, 745, 626 Year 1 Production (k. Wh) 645, 526 121, 719 130, 811 112, 965 8, 366 28, 438 1, 047, 825 % Offset 55% 44% 71% 95% $/k. Wh (20 y) Summit Cnty Owns $0. 111 $ 0. 093 $ 0. 111 $ 0. 090 Potential (Blended) PPA rate $0. 09 RMP Solar Program Rate 47% $0. 079 $ 0. 083 $ 0. 088 $0. 09 0. 07 *0. 07 +DC+FC Consider switching to RMP Solar Program for supplemental offset of power consumption at Justice and Richins, then switch to Schedule 6 A. *0. 07+DC+FC (Demand Charge plus Facilities Charge)
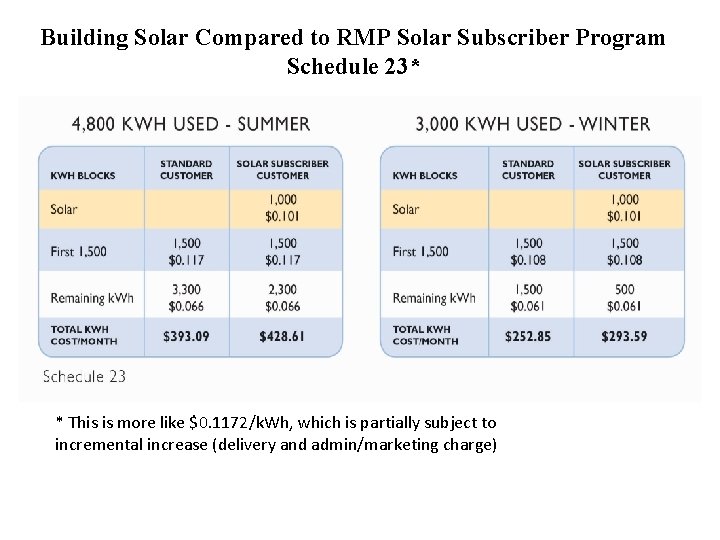
Building Solar Compared to RMP Solar Subscriber Program Schedule 23* * This is more like $0. 1172/k. Wh, which is partially subject to incremental increase (delivery and admin/marketing charge)
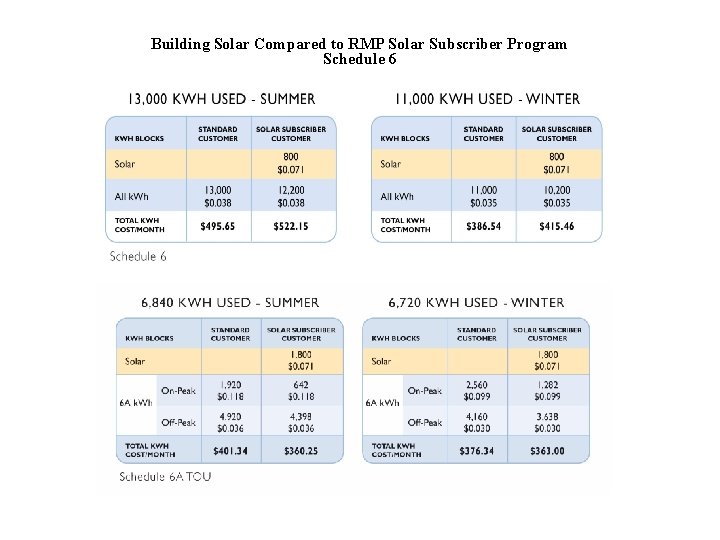
Building Solar Compared to RMP Solar Subscriber Program Schedule 6
- Slides: 12