Phase Diagram of Ruthenate Ca 2 x Srx


- Slides: 20
Phase Diagram of Ruthenate: Ca 2 -x. Srx. Ru. O 4 (CSRO) (0. 0<x<2. 0) Biao Hu
Outline: 1. Introduction to Ruthenates 2. Phase diagram of Ca 2 -x. Srx. Ru. O 4 3. Lattice dynamics in Ca 2 -x. Srx. Ru. O 4 4. Summary
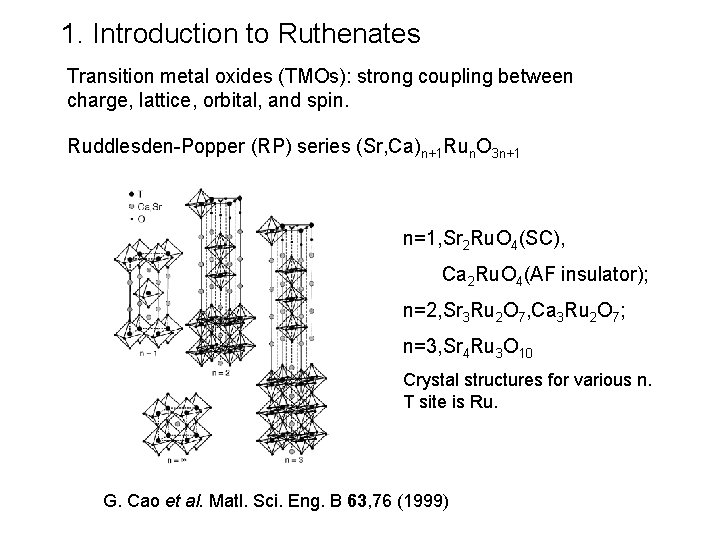
1. Introduction to Ruthenates Transition metal oxides (TMOs): strong coupling between charge, lattice, orbital, and spin. Ruddlesden-Popper (RP) series (Sr, Ca)n+1 Run. O 3 n+1 n=1, Sr 2 Ru. O 4(SC), Ca 2 Ru. O 4(AF insulator); n=2, Sr 3 Ru 2 O 7, Ca 3 Ru 2 O 7; n=3, Sr 4 Ru 3 O 10 Crystal structures for various n. T site is Ru. G. Cao et al. Matl. Sci. Eng. B 63, 76 (1999)
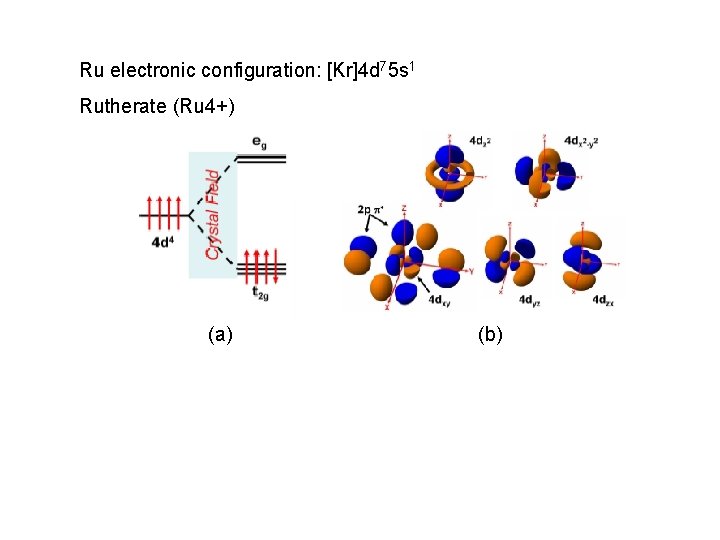
Ru electronic configuration: [Kr]4 d 75 s 1 Rutherate (Ru 4+) (a) (b)
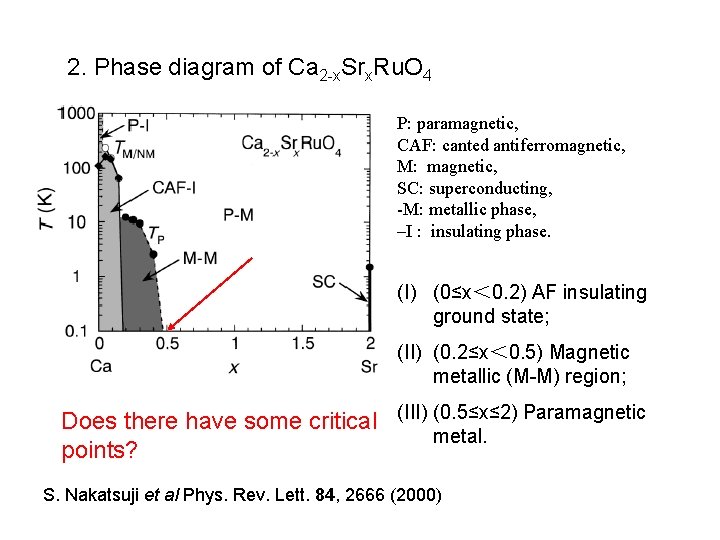
2. Phase diagram of Ca 2 -x. Srx. Ru. O 4 P: paramagnetic, CAF: canted antiferromagnetic, M: magnetic, SC: superconducting, -M: metallic phase, –I : insulating phase. (I) (0≤x< 0. 2) AF insulating ground state; (II) (0. 2≤x< 0. 5) Magnetic metallic (M-M) region; Does there have some critical (III) (0. 5≤x≤ 2) Paramagnetic metal. points? S. Nakatsuji et al Phys. Rev. Lett. 84, 2666 (2000)
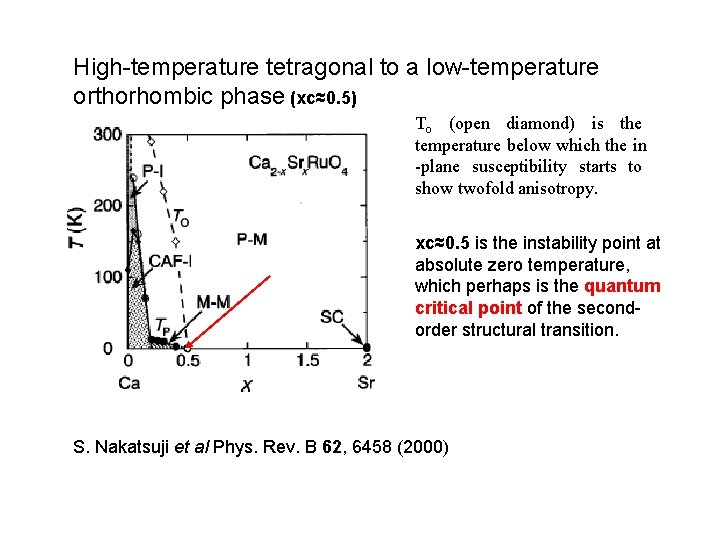
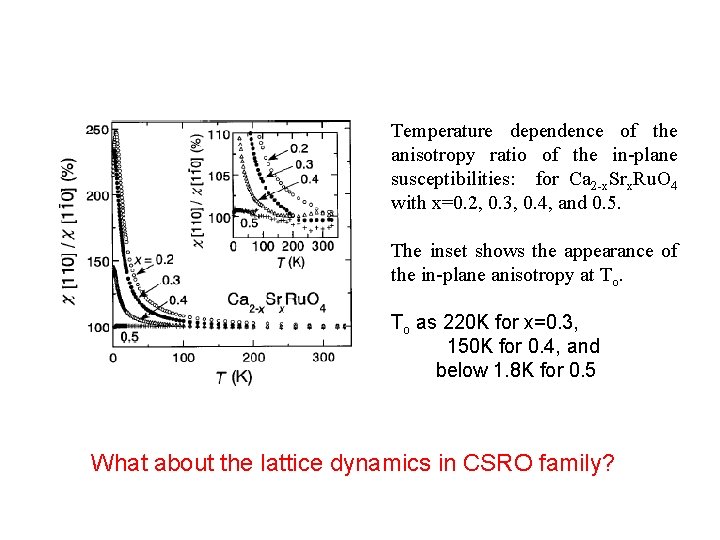
High-temperature tetragonal to a low-temperature orthorhombic phase (xc≈0. 5) To (open diamond) is the temperature below which the in -plane susceptibility starts to show twofold anisotropy. xc≈0. 5 is the instability point at absolute zero temperature, which perhaps is the quantum critical point of the secondorder structural transition. S. Nakatsuji et al Phys. Rev. B 62, 6458 (2000)
Temperature dependence of the anisotropy ratio of the in-plane susceptibilities: for Ca 2 -x. Srx. Ru. O 4 with x=0. 2, 0. 3, 0. 4, and 0. 5. The inset shows the appearance of the in-plane anisotropy at To. To as 220 K for x=0. 3, 150 K for 0. 4, and below 1. 8 K for 0. 5 What about the lattice dynamics in CSRO family?
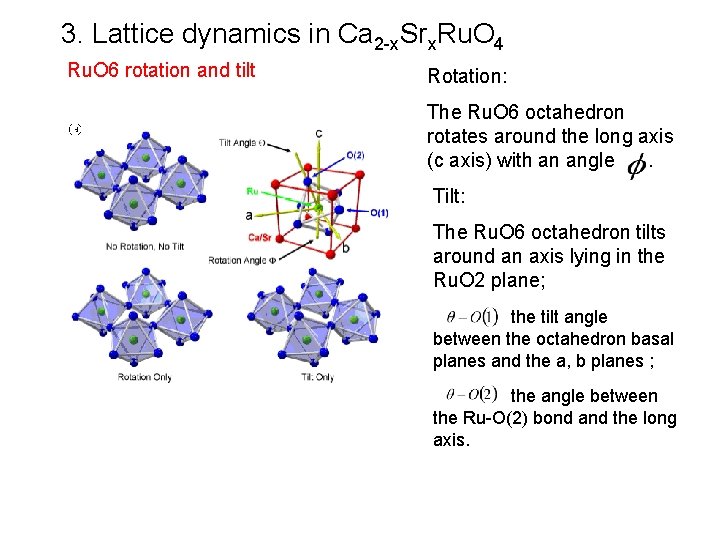
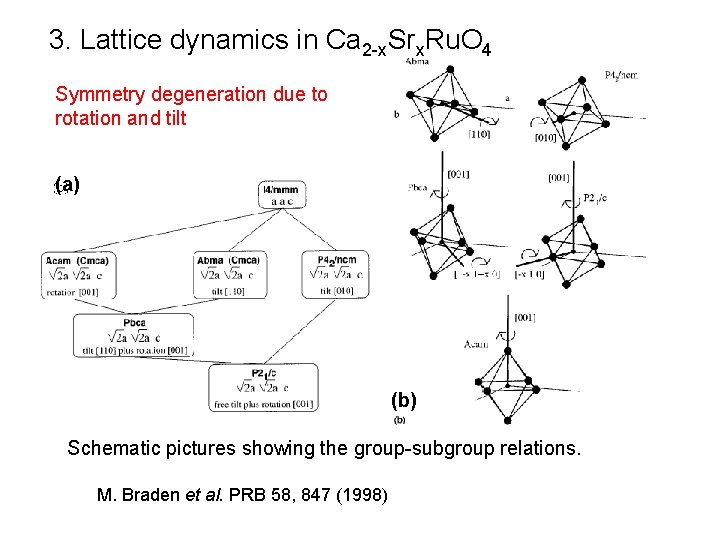
3. Lattice dynamics in Ca 2 -x. Srx. Ru. O 4 Ru. O 6 rotation and tilt Rotation: The Ru. O 6 octahedron rotates around the long axis (c axis) with an angle. Tilt: The Ru. O 6 octahedron tilts around an axis lying in the Ru. O 2 plane; the tilt angle between the octahedron basal planes and the a, b planes ; the angle between the Ru-O(2) bond and the long axis.
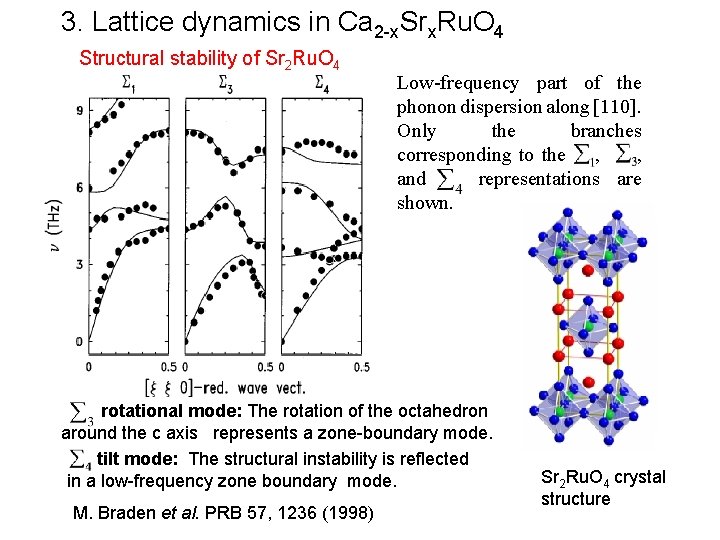
3. Lattice dynamics in Ca 2 -x. Srx. Ru. O 4 Structural stability of Sr 2 Ru. O 4 Low-frequency part of the phonon dispersion along [110]. Only the branches corresponding to the , , and representations are shown. rotational mode: The rotation of the octahedron around the c axis represents a zone-boundary mode. tilt mode: The structural instability is reflected in a low-frequency zone boundary mode. M. Braden et al. PRB 57, 1236 (1998) Sr 2 Ru. O 4 crystal structure
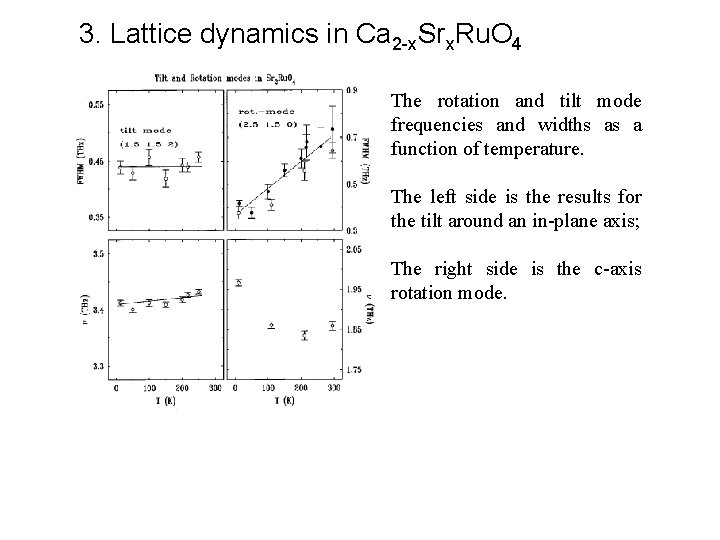
3. Lattice dynamics in Ca 2 -x. Srx. Ru. O 4 The rotation and tilt mode frequencies and widths as a function of temperature. The left side is the results for the tilt around an in-plane axis; The right side is the c-axis rotation mode.
3. Lattice dynamics in Ca 2 -x. Srx. Ru. O 4 Symmetry degeneration due to rotation and tilt (a) (b) Schematic pictures showing the group-subgroup relations. M. Braden et al. PRB 58, 847 (1998)
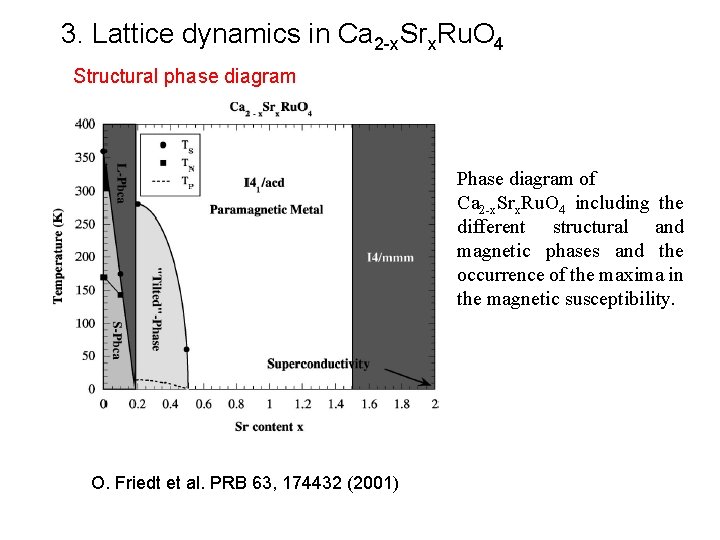
3. Lattice dynamics in Ca 2 -x. Srx. Ru. O 4 Structural phase diagram Phase diagram of Ca 2 -x. Srx. Ru. O 4 including the different structural and magnetic phases and the occurrence of the maxima in the magnetic susceptibility. O. Friedt et al. PRB 63, 174432 (2001)
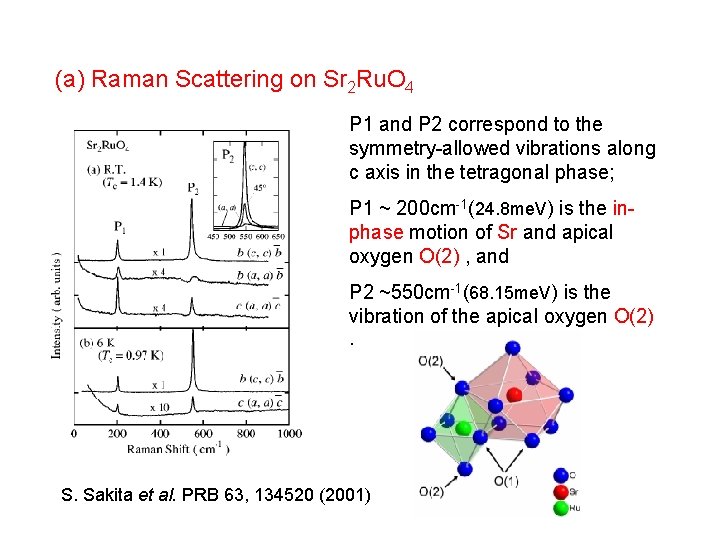
(a) Raman Scattering on Sr 2 Ru. O 4 P 1 and P 2 correspond to the symmetry-allowed vibrations along c axis in the tetragonal phase; P 1 ~ 200 cm-1(24. 8 me. V) is the inphase motion of Sr and apical oxygen O(2) , and P 2 ~550 cm-1(68. 15 me. V) is the vibration of the apical oxygen O(2). S. Sakita et al. PRB 63, 134520 (2001)
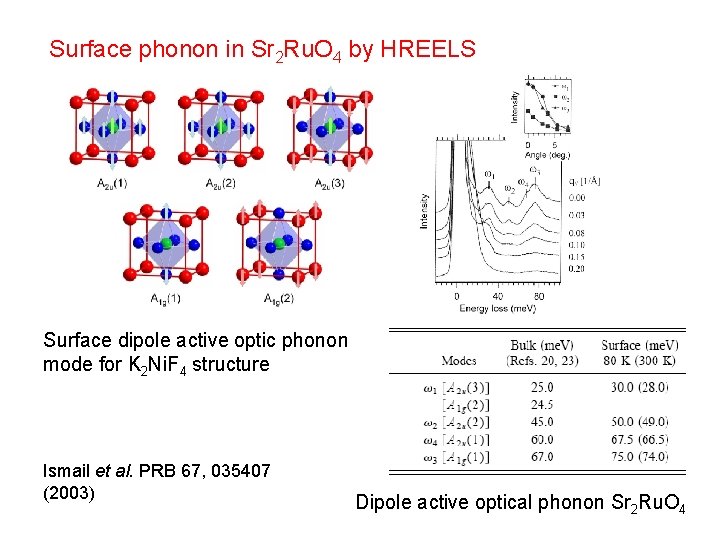
Surface phonon in Sr 2 Ru. O 4 by HREELS Surface dipole active optic phonon mode for K 2 Ni. F 4 structure Ismail et al. PRB 67, 035407 (2003) Dipole active optical phonon Sr 2 Ru. O 4
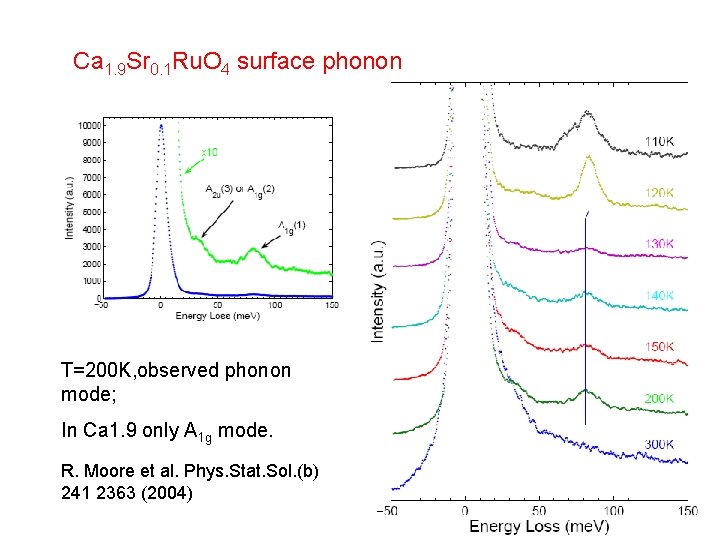
Ca 1. 9 Sr 0. 1 Ru. O 4 surface phonon T=200 K, observed phonon mode; In Ca 1. 9 only A 1 g mode. R. Moore et al. Phys. Stat. Sol. (b) 241 2363 (2004)
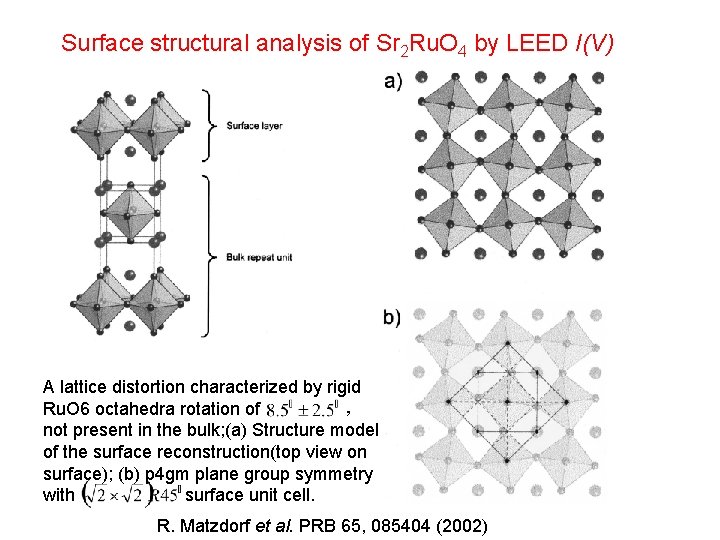
Surface structural analysis of Sr 2 Ru. O 4 by LEED I(V) A lattice distortion characterized by rigid Ru. O 6 octahedra rotation of , not present in the bulk; (a) Structure model of the surface reconstruction(top view on surface); (b) p 4 gm plane group symmetry with surface unit cell. R. Matzdorf et al. PRB 65, 085404 (2002)
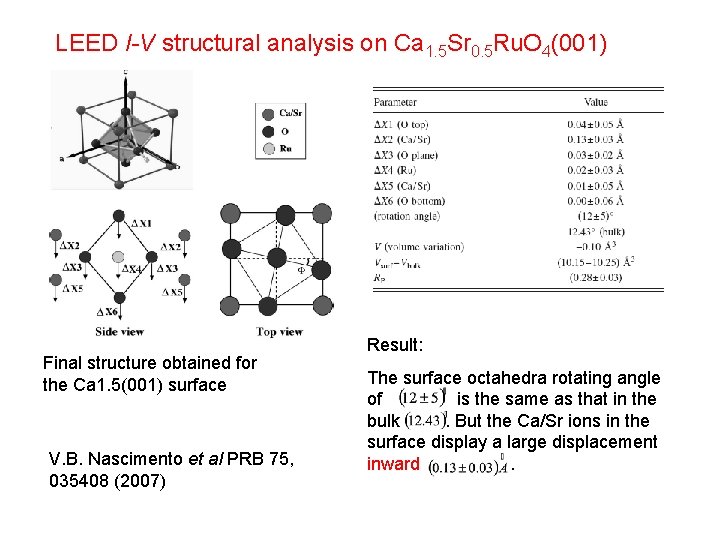
LEED I-V structural analysis on Ca 1. 5 Sr 0. 5 Ru. O 4(001) Final structure obtained for the Ca 1. 5(001) surface V. B. Nascimento et al PRB 75, 035408 (2007) Result: The surface octahedra rotating angle of is the same as that in the bulk. But the Ca/Sr ions in the surface display a large displacement inward.
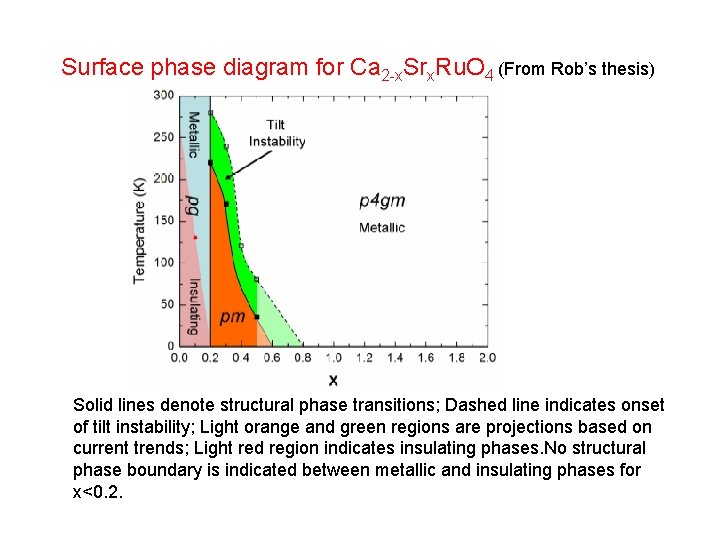
Surface phase diagram for Ca 2 -x. Srx. Ru. O 4 (From Rob’s thesis) Solid lines denote structural phase transitions; Dashed line indicates onset of tilt instability; Light orange and green regions are projections based on current trends; Light red region indicates insulating phases. No structural phase boundary is indicated between metallic and insulating phases for x<0. 2.
5. Summary (a) From the analysis to phase diagram Ca 2 -x. Srx. Ru. O 4, there exists a quantum critical point at x=0. 5. (b) The substitution of Ca 2+ for Sr 2+ will generate a different structure involving a static rotation and tilt of the Ru. O 6 octahedral. Rotational and tilt play a significant role in lattice dynamics for Ca 2 -x. Srx. Ru. O 4 compounds.
Thank you for attention!