Pharmacists role in a family medicine clinic a


 • Number of patients referred = 168")


")


- Slides: 24
Pharmacists’ role in a family medicine clinic: a focus on patients with diabetes Benjamin Chavez, Pharm. D, BCPP, BCACP Associate Professor Pacific University Oregon School of Pharmacy Previously: Clinical Associate Professor University of Hawaii John A Burns School of Medicine Department of Family Medicine and Community Health
Disclosures • No conflicts of interest to disclose
Objective • To describe the role of clinical pharmacist embedded in a family medicine clinic serving an underserved population
Practice Site – Physician Center at Mililani • Outpatient primary care, family-medicine, clinic • Main outpatient clinic for residency program for Department of Family Medicine and Community Health at University of Hawaii • 18 residents (6 each year) • 7 attending physicians • 6 -8 medical assistants • Front desk staff • 10 patient rooms
Patient Population • Serves mostly under-served lower socio-economic patient population – Mostly on Hawaii’s Medicaid or uninsured • “Rural” area • Large Pacific Islander patient population – – – Marshal Islands Federated States of Micronesia (Yap, Chuuk, Pohnpei, Kosrae) Guam Samoa Palau • Asian descent • As well as Hawaii locals
LET’S TALK GEOGRAPHY. . .
BACK TO OUR SERVICE
Pharmacy Services • Started in July 2010 • From electronic patient records, high-risk patients would be identified for intervention – Started with Hg. A 1 C > 10% – Telephone calls asking people to come in for appt with pharmacist – Success was moderate • Eventually, physicians and residents started referring more and more patients with different disease states • Specific protocols written for diabetes, hypertension, and hyperlipidemia • Other disease states seen as well • Pharmacy students were integrated in October 2010
Office Visits • Patient appointments were scheduled for 30 minutes • We did not bill for these services • Seen as an added benefit for our patients • ~2 -3 days per week of scheduled appointments – Also there to precept/support residents and students • ~1 -2 days per week of serving as preceptor for residents
Other Responsibilities • Communication with retail pharmacies • Phone calls from patients re: medication questions • Insurance companies prior authorizations • Provider education – Journal club – Topic discussions • Curbside consults
Data Collected (Sept 2010 – July 2013) • Number of patients referred = 168 – Number of patients who never showed = 41 • Number of appointments scheduled = 602 • Number of appointments completed = 380 • No show rate = 36. 9% (Clinic average was 10%-15%) • Numbers of patients with > 1 appointment = 73 • Average number of visit/patient = 2. 3
Reasons for Office Visits Reason for Visit Number of visits Diabetes 322 Hypertension 125 Hyperlipidemia 35 Device education 5 Smoking cessation 10 Psychiatric 38 Medication Reconciliation 63 Other* 57 - Reason for visit only accounts what physician put down as reason for referral or patient’s chief complaint - It may not account for other disease states/conditions treated during appointment * Other = constipation, pain, fatigue, migraines
Types of Interventions 300 250 200 150 100 50 0 Medication change Diet/exercise counseling Med education Device education Disease state education Labs order
Types of intervention - Limitations • Retrospectively collected from chart • Medication change included increase, decrease, d/c, or adding a new medication • Lab order not accurately captured initially • Device education – Many were tacked on to end of visit with PCP and not documented
Office visits – With Diabetes • Number of patients with DM = 102 (61%) – Only 3 patients did not come in for at least 1 visit • Total number of scheduled visits = 469 • Number of visits completed = 322 • No show rate = 29. 8% • Average number of visits per patient = 3. 2
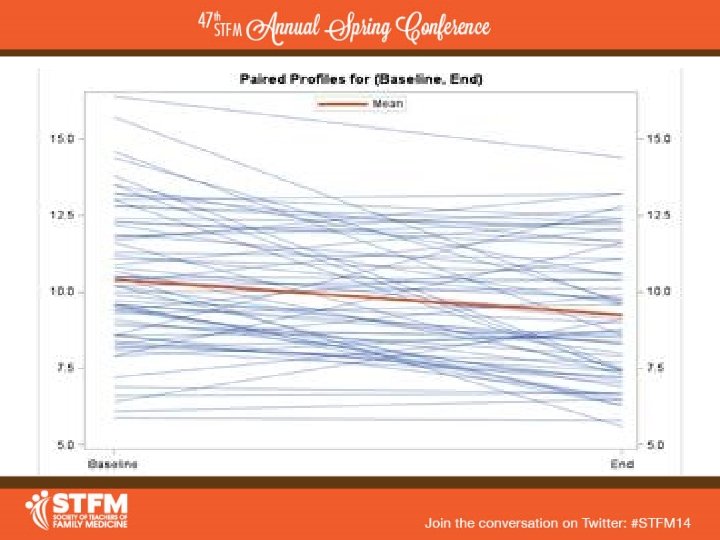
Laboratory Values – 3 years - DM • DM patients and labs were the only ones we had sufficient numbers for meaningful data • 70 patients had pre- and post- A 1 C – Pre-A 1 C had to be no > 3 months prior to referral – Post-A 1 C no > 6 months after last visit • Average Pre-A 1 C = 10. 2% (5. 9 -16. 4%) • Average Post-A 1 C = 8. 8% (5. 8 -14. 4%) • Average Change = -1. 23% (p<0. 001) – 95% CI (-1. 68, -. 061)
Other DM Results • Range of A 1 C improvement = -6. 3% to +4. 2% • Only 19 out of 70 patients had an increase in A 1 C – Only 8 of those were > 1% • 34 out of 70 patients had a decrease of > 1% – 21 were > 2% – 14 were > 3% – 8 were > 4% – 5 were > 5% • • 25 patients were < 8% A 1 C at end 11 patients were < 7% A 1 C at end • Examined for correlation with medications – No clear relationship found
Challenges / Limitations • Recruitment of patients • High no-show rate • Retrospective collection method • Multiple factors involved in improvement • Not everything pharmacy did was documented
QUESTIONS? COMMENTS?