Performance Profiling in a Virtualized Environments Hadi Salimi
![References [1] Performance Counters for Linux. 2010. http: //lwn. net/Articles/310176/. [2] G. Banga, P. References [1] Performance Counters for Linux. 2010. http: //lwn. net/Articles/310176/. [2] G. Banga, P.](https://slidetodoc.com/presentation_image_h2/bb24e9212d0d94c235cc79f388b611e4/image-18.jpg)
![References(cont’d) [4] F. Bellard. QEMU, a fast and portable dynamic translator. In Proceedings of References(cont’d) [4] F. Bellard. QEMU, a fast and portable dynamic translator. In Proceedings of](https://slidetodoc.com/presentation_image_h2/bb24e9212d0d94c235cc79f388b611e4/image-19.jpg)
- Slides: 19

Performance Profiling in a Virtualized Environments Hadi Salimi Distributed Systems Lab, School of Computer Engineering, Iran University of Science and Technology, hsalimi@iust. ac. ir Fall 2010

Outline • Review of Virtualization Technology • Profiling in a Virtualized Environments • Review of Performance Profiling • Structure of a Profiler • Profiling Techniques in a Virtualized Environment • Profiling Packet Receive • Other Important Things • Conclusions 2

Review of Virtualization Technology • Virtualization is the most Important Technology for Cloud Computing • Virtualization uses workload consolidation and migration for improves the resource utilization and the scalability of a cloud • The Virtual Machine Monitor (VMM) exports a set of virtual machines to the guest operating systems and manages accesses to the underlying hardware resources shared by multiple guests 3

Review of Virtualization Technology(cont’d) • Diverse implementations • Software: Xen, KVM, VMware, …. • Hardware: Intel x 86, AMD x 86, Power. PC, … • Opportunities for performance profiling & tuning • Public cloud: guest OS & applications • Private cloud: whole software stack • Profilers based on CPU performance counters do not work well with virtual machines 4

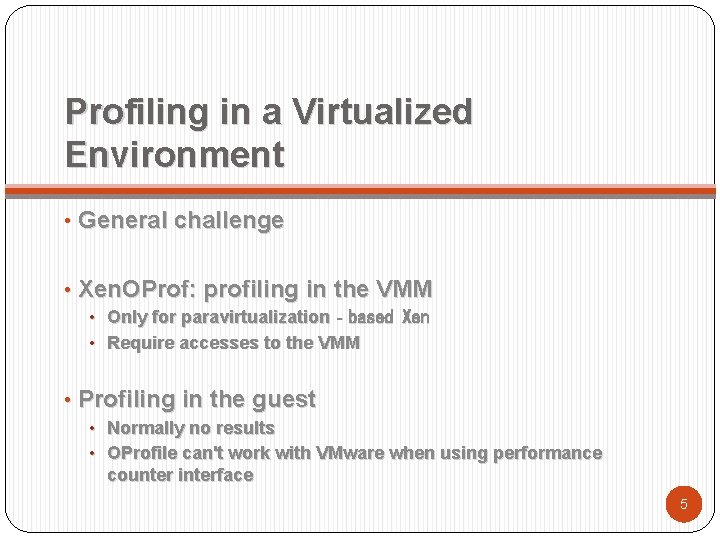
Profiling in a Virtualized Environment • General challenge • Xen. OProf: profiling in the VMM • Only for paravirtualization‐based Xen • Require accesses to the VMM • Profiling in the guest • Normally no results • OProfile can't work with VMware when using performance counter interface 5

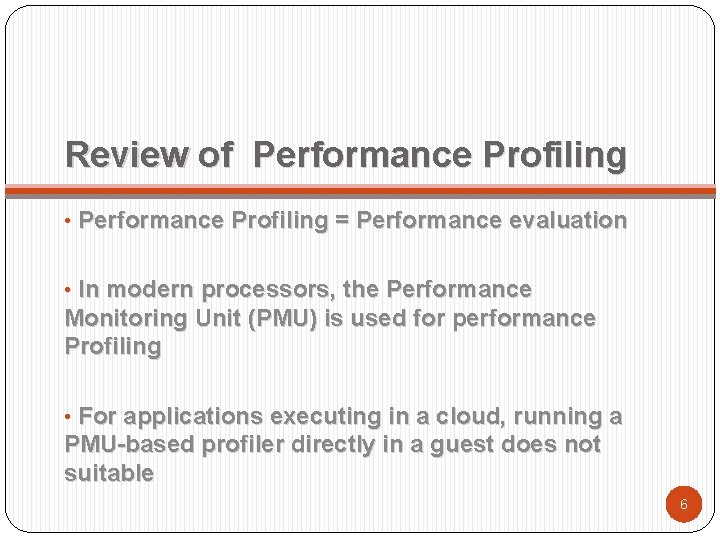
Review of Performance Profiling • Performance Profiling = Performance evaluation • In modern processors, the Performance Monitoring Unit (PMU) is used for performance Profiling • For applications executing in a cloud, running a PMU-based profiler directly in a guest does not suitable 6

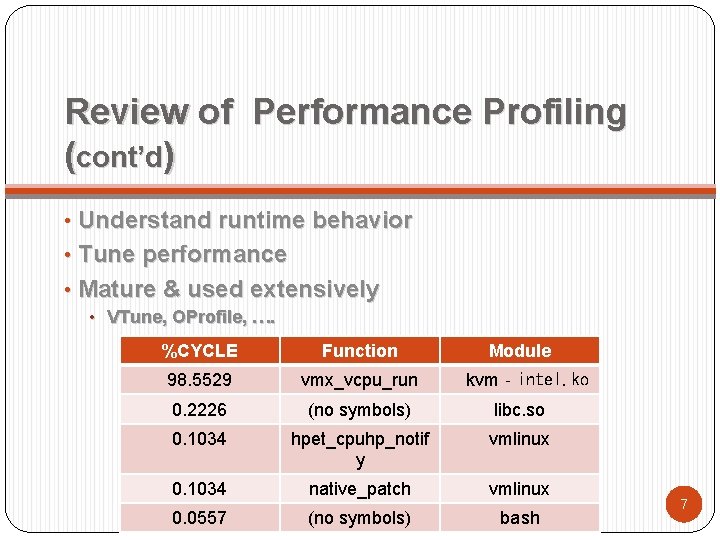
Review of Performance Profiling (cont’d) • Understand runtime behavior • Tune performance • Mature & used extensively • VTune, OProfile, …. %CYCLE Function Module 98. 5529 vmx_vcpu_run 0. 2226 (no symbols) libc. so 0. 1034 hpet_cpuhp_notif y vmlinux 0. 1034 native_patch vmlinux 0. 0557 (no symbols) bash kvm‐intel. ko 7

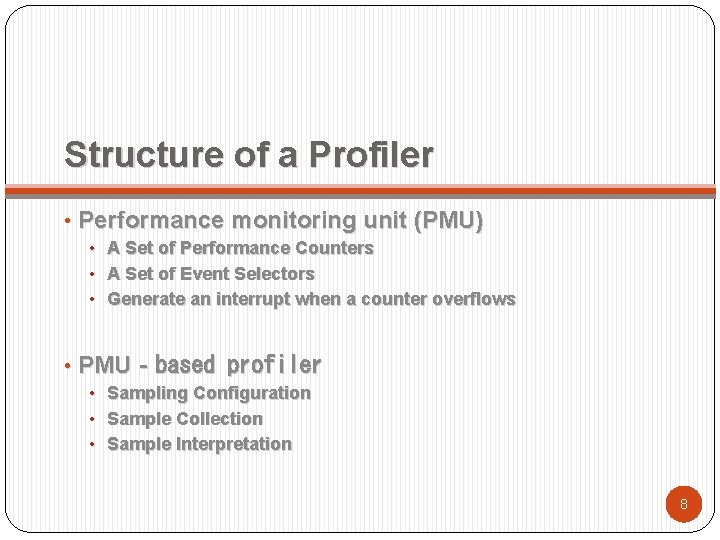
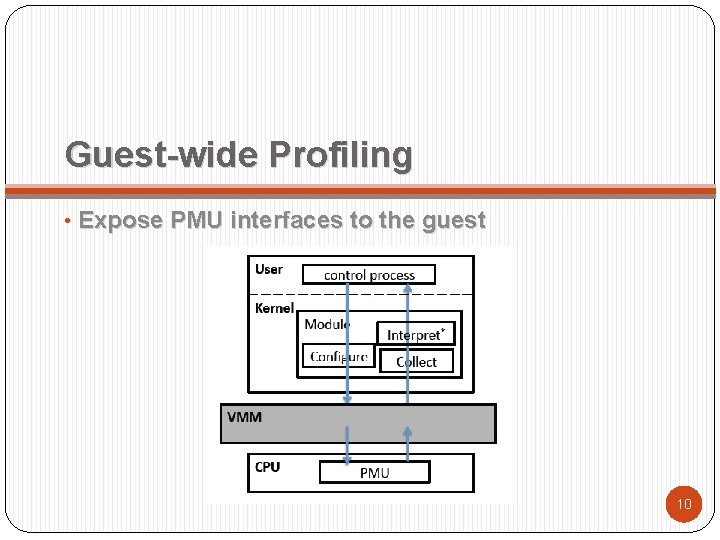
Structure of a Profiler • Performance monitoring unit (PMU) • A Set of Performance Counters • A Set of Event Selectors • Generate an interrupt when a counter overflows • PMU‐based profiler • Sampling Configuration • Sample Collection • Sample Interpretation 8

Profiling Techniques in Virtualized Environment • Guest-wide Profiling • System-wide Profiling 9

Guest-wide Profiling • Expose PMU interfaces to the guest 10

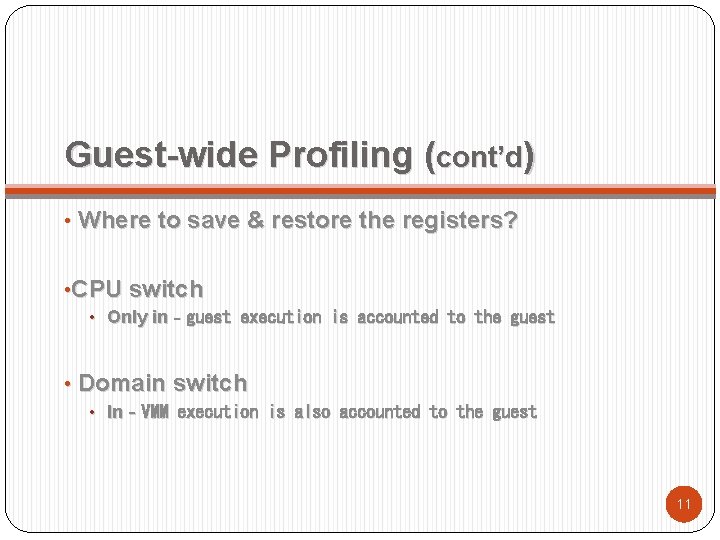
Guest-wide Profiling (cont’d) • Where to save & restore the registers? • CPU switch • Only in‐guest execution is accounted to the guest • Domain switch • In‐VMM execution is also accounted to the guest 11

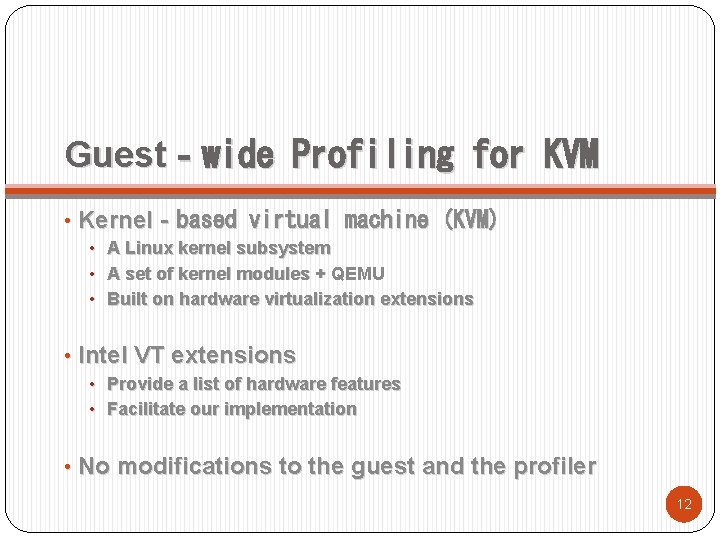
Guest‐wide Profiling for KVM • Kernel‐based virtual machine (KVM) • A Linux kernel subsystem • A set of kernel modules + QEMU • Built on hardware virtualization extensions • Intel VT extensions • Provide a list of hardware features • Facilitate our implementation • No modifications to the guest and the profiler 12

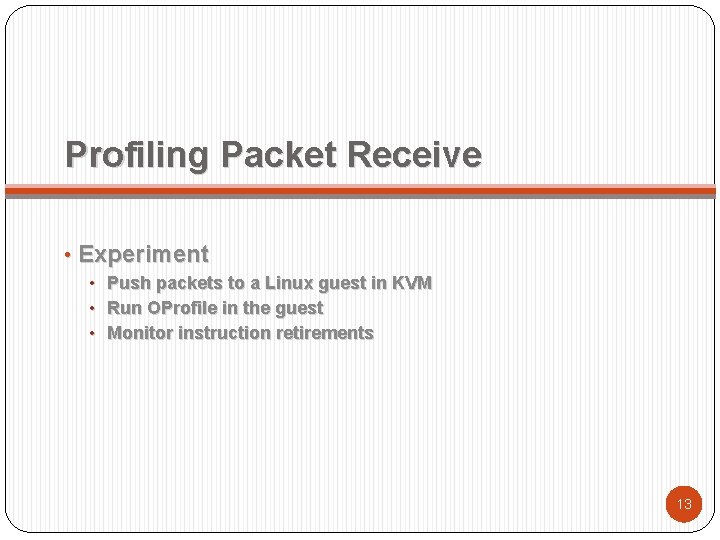
Profiling Packet Receive • Experiment • Push packets to a Linux guest in KVM • Run OProfile in the guest • Monitor instruction retirements 13

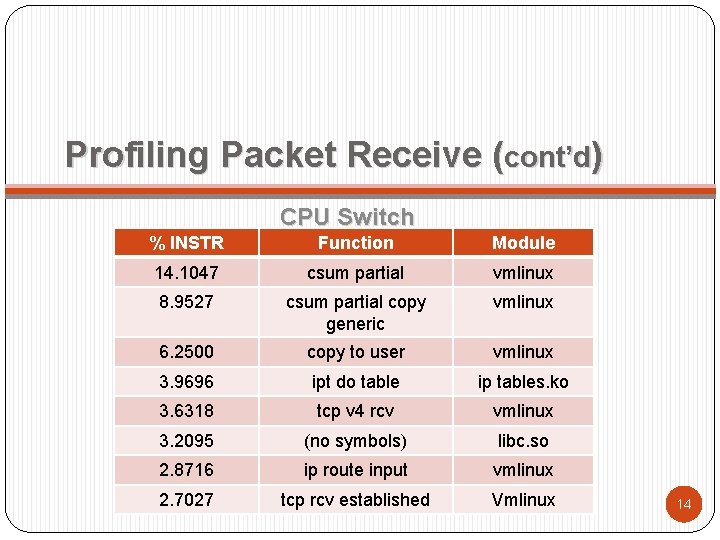
Profiling Packet Receive (cont’d) CPU Switch % INSTR Function Module 14. 1047 csum partial vmlinux 8. 9527 csum partial copy generic vmlinux 6. 2500 copy to user vmlinux 3. 9696 ipt do table ip tables. ko 3. 6318 tcp v 4 rcv vmlinux 3. 2095 (no symbols) libc. so 2. 8716 ip route input vmlinux 2. 70271184 tcp rcv established counter overflows Vmlinux 14

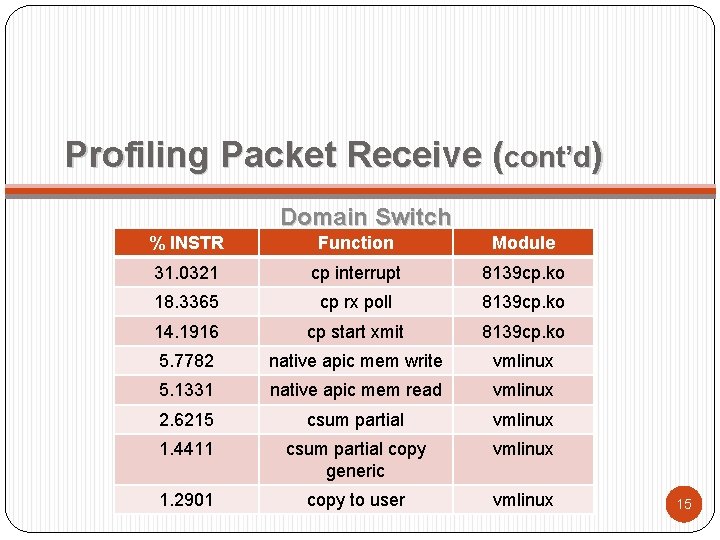
Profiling Packet Receive (cont’d) Domain Switch % INSTR Function Module 31. 0321 cp interrupt 8139 cp. ko 18. 3365 cp rx poll 8139 cp. ko 14. 1916 cp start xmit 8139 cp. ko 5. 7782 native apic mem write vmlinux 5. 1331 native apic mem read vmlinux 2. 6215 csum partial vmlinux 1. 4411 csum partial copy generic vmlinux 1. 29017286 copy tooverflows user counter vmlinux 15

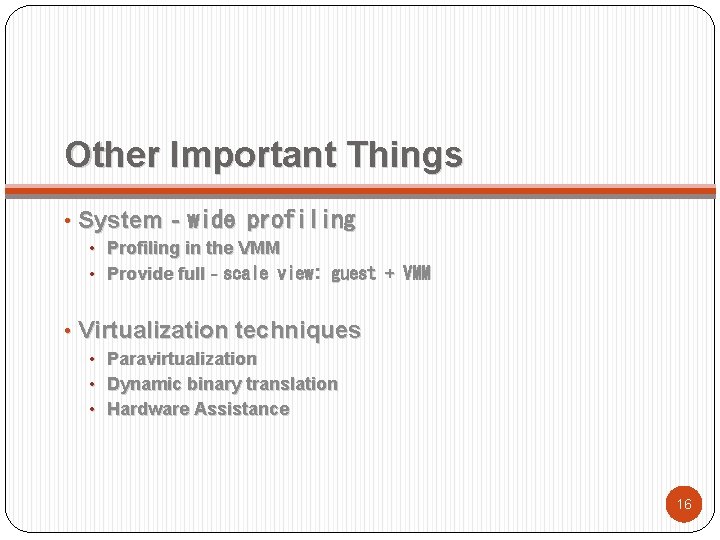
Other Important Things • System‐wide profiling • Profiling in the VMM • Provide full‐scale view: guest + VMM • Virtualization techniques • Paravirtualization • Dynamic binary translation • Hardware Assistance 16

Conclusions • Profilers do not work well with virtual machines • We implement guest‐wide profiling in a VMM based on hardware assistance • Profiling helps understand the real cost of I/O operation in a guest 17
![References 1 Performance Counters for Linux 2010 http lwn netArticles310176 2 G Banga P References [1] Performance Counters for Linux. 2010. http: //lwn. net/Articles/310176/. [2] G. Banga, P.](https://slidetodoc.com/presentation_image_h2/bb24e9212d0d94c235cc79f388b611e4/image-18.jpg)
References [1] Performance Counters for Linux. 2010. http: //lwn. net/Articles/310176/. [2] G. Banga, P. Druschel, and J. C. Mogul. Resource containers: A new facility for resource management in server systems. Operating Systems Review, 33: 45– 58, 1998. [3] P. Barham, B. Dragovic, K. Fraser, S. Hand, T. Harris, A. Ho, R. Neugebauer, I. Pratt, and A. Warfield. Xen the art of virtualization. In Proceedings of the nineteenth ACM symposium on 18 Operating systems principles, page 177. ACM, 2003
![Referencescontd 4 F Bellard QEMU a fast and portable dynamic translator In Proceedings of References(cont’d) [4] F. Bellard. QEMU, a fast and portable dynamic translator. In Proceedings of](https://slidetodoc.com/presentation_image_h2/bb24e9212d0d94c235cc79f388b611e4/image-19.jpg)
References(cont’d) [4] F. Bellard. QEMU, a fast and portable dynamic translator. In Proceedings of the USENIX 2005 Annual Technical Conference, FREENIX Track, pages 41– 46, 2005 [5] A. Kivity, Y. Kamay, D. Laor, U. Lublin, and A. Liguori. kvm: the Linux virtual machine monitor. In Linux Symposium, 2007. [6] A. Menon, J. R. Santos, Y. Turner, G. J. Janakiraman, and W. Zwaenepoel. Diagnosing performance overheads in the Xen virtual machine environment. In VEE, volume 5, pages 13– 23 19