
Drawing Causal Inference from Big Data Babak Salimi

Drawing Causal Inference from Big Data Babak Salimi*, Dan Suciu*, Johannes Gehrke+ *University of Washington +Microsoft 1
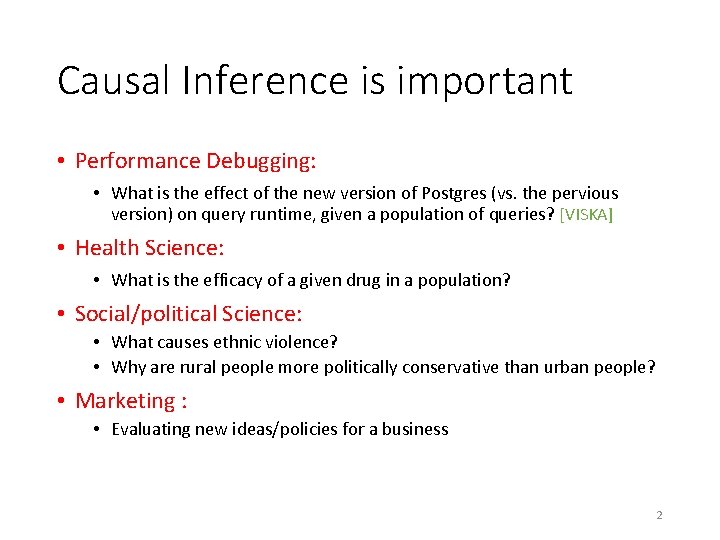
Causal Inference is important • Performance Debugging: • What is the effect of the new version of Postgres (vs. the pervious version) on query runtime, given a population of queries? [VISKA] • Health Science: • What is the efficacy of a given drug in a population? • Social/political Science: • What causes ethnic violence? • Why are rural people more politically conservative than urban people? • Marketing : • Evaluating new ideas/policies for a business 2
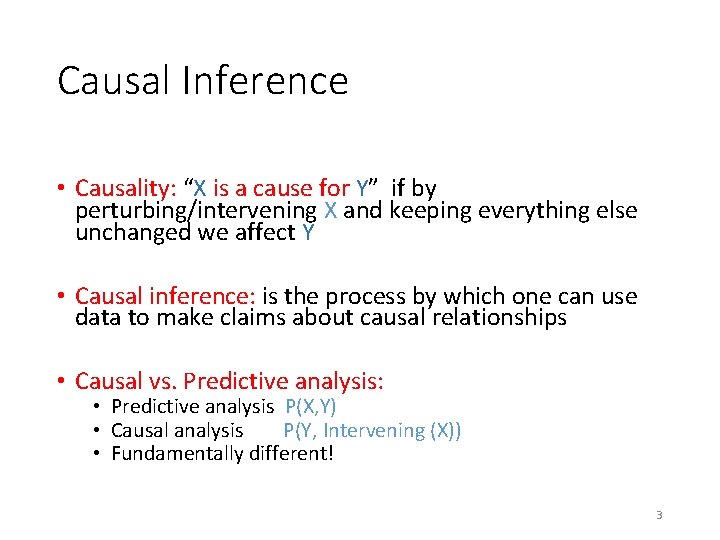
Causal Inference • Causality: “X is a cause for Y” if by perturbing/intervening X and keeping everything else unchanged we affect Y • Causal inference: is the process by which one can use data to make claims about causal relationships • Causal vs. Predictive analysis: • Predictive analysis P(X, Y) • Causal analysis P(Y, Intervening (X)) • Fundamentally different! 3
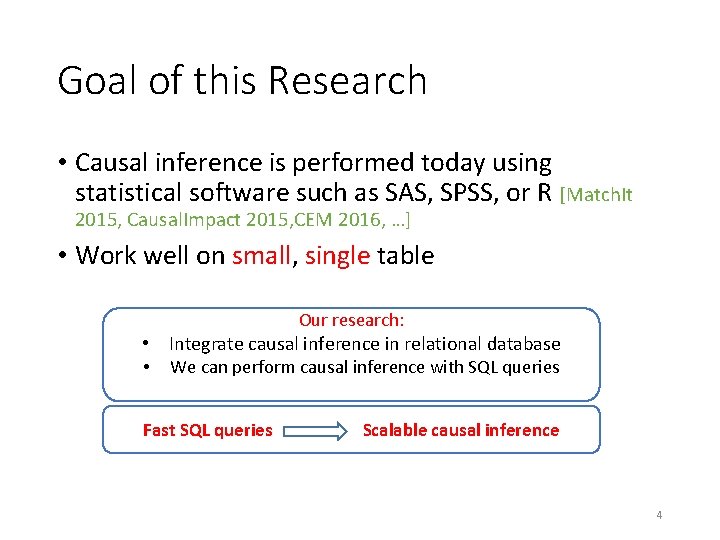
Goal of this Research • Causal inference is performed today using statistical software such as SAS, SPSS, or R [Match. It 2015, Causal. Impact 2015, CEM 2016, …] • Work well on small, single table Our research: • Integrate causal inference in relational database • We can perform causal inference with SQL queries Fast SQL queries Scalable causal inference 4
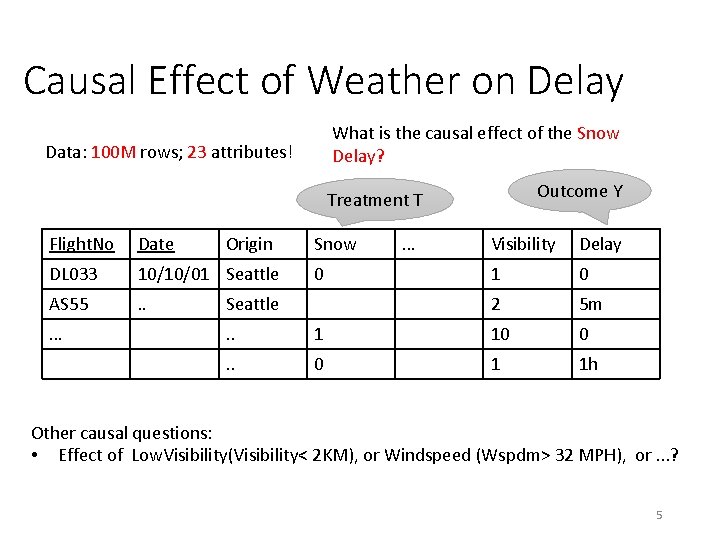
Causal Effect of Weather on Delay What is the causal effect of the Snow Delay? Data: 100 M rows; 23 attributes! Outcome Y Treatment T Flight. No Date DL 033 10/10/01 Seattle AS 55 . . … Origin Snow 0 Seattle … Visibility Delay 1 0 2 5 m . . 1 10 0 . . 0 1 1 h Other causal questions: • Effect of Low. Visibility(Visibility< 2 KM), or Windspeed (Wspdm> 32 MPH), or. . . ? 5
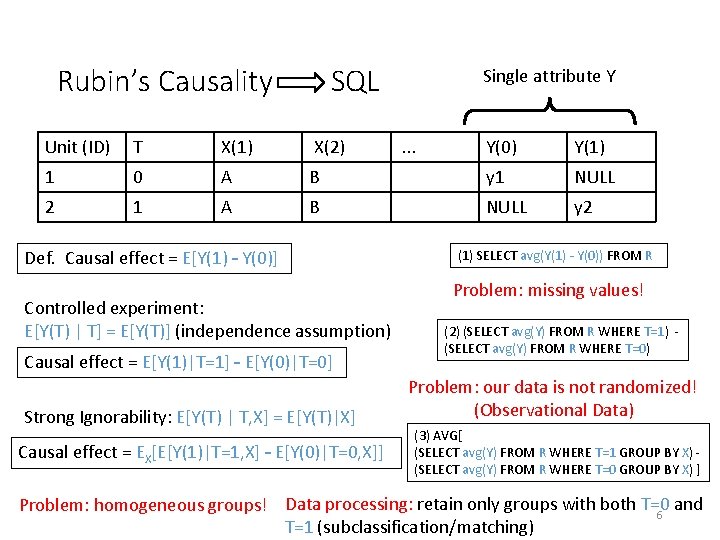
Rubin’s Causality SQL Unit (ID) T X(1) X(2) 1 0 A 2 1 A Single attribute Y Y(0) Y(1) B y 1 NULL B NULL y 2 Def. Causal effect = E[Y(1) – Y(0)] Controlled experiment: E[Y(T) | T] = E[Y(T)] (independence assumption) Causal effect = E[Y(1)|T=1] – E[Y(0)|T=0] Strong Ignorability: E[Y(T) | T, X] = E[Y(T)|X] Causal effect = EX[E[Y(1)|T=1, X] – E[Y(0)|T=0, X]] . . . (1) SELECT avg(Y(1) – Y(0)) FROM R Problem: missing values! (2) (SELECT avg(Y) FROM R WHERE T=1) (SELECT avg(Y) FROM R WHERE T=0) Problem: our data is not randomized! (Observational Data) (3) AVG[ (SELECT avg(Y) FROM R WHERE T=1 GROUP BY X) (SELECT avg(Y) FROM R WHERE T=0 GROUP BY X) ] Problem: homogeneous groups! Data processing: retain only groups with both T=0 and 6 T=1 (subclassification/matching)
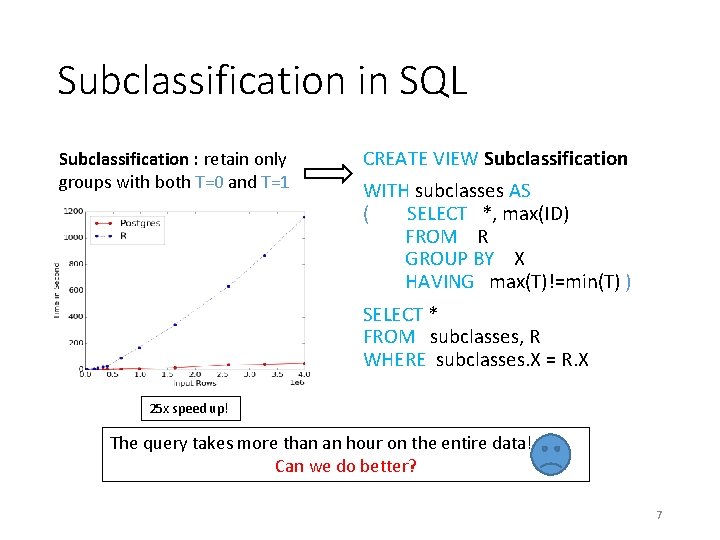
Subclassification in SQL Subclassification : retain only groups with both T=0 and T=1 CREATE VIEW Subclassification WITH subclasses AS ( SELECT *, max(ID) FROM R GROUP BY X HAVING max(T)!=min(T) ) SELECT * FROM subclasses, R WHERE subclasses. X = R. X 25 x speed up! The query takes more than an hour on the entire data! Can we do better? 7
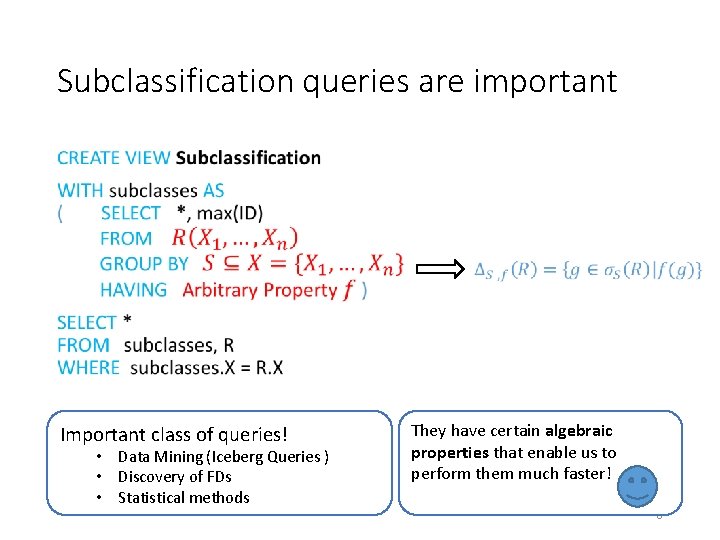
Subclassification queries are important • Important class of queries! • Data Mining (Iceberg Queries ) • Discovery of FDs • Statistical methods They have certain algebraic properties that enable us to perform them much faster! 8
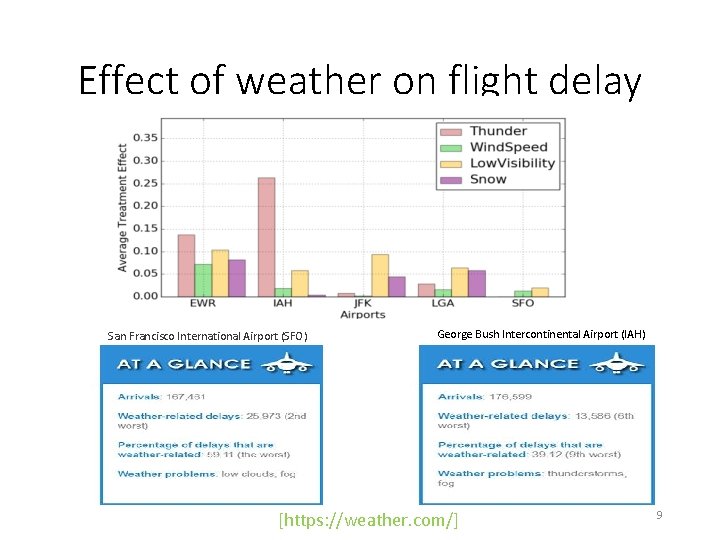
Effect of weather on flight delay San Francisco International Airport (SFO) George Bush Intercontinental Airport (IAH) [https: //weather. com/] 9
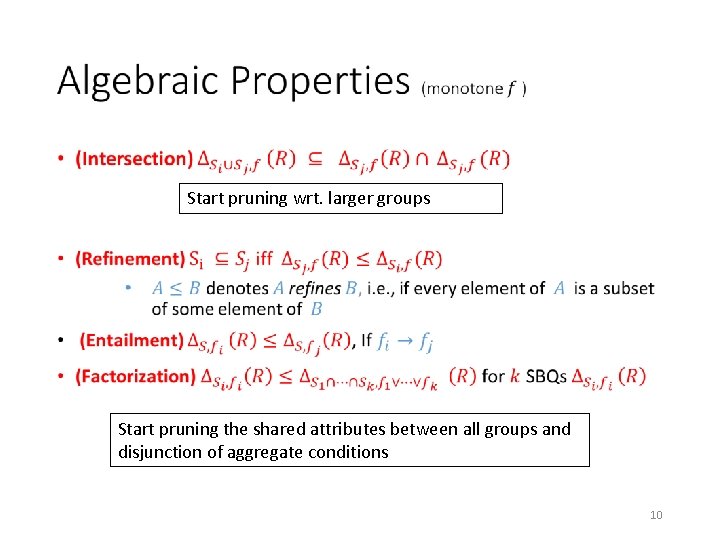
• Start pruning wrt. larger groups Start pruning the shared attributes between all groups and disjunction of aggregate conditions 10
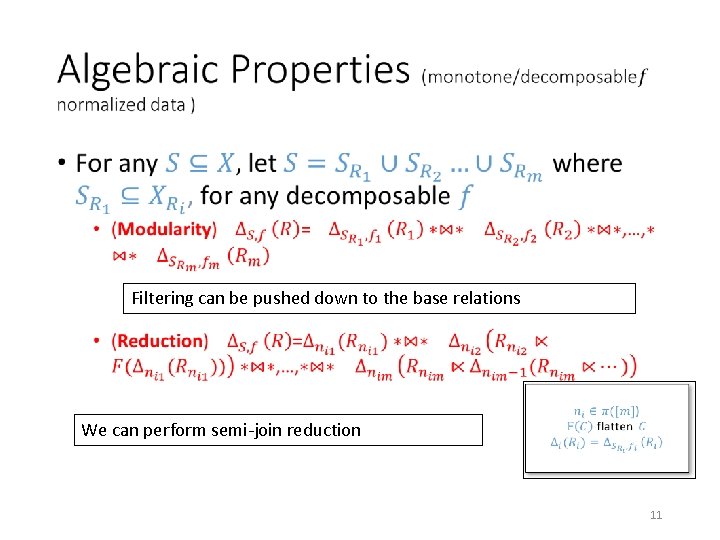
• Filtering can be pushed down to the base relations We can perform semi-join reduction 11
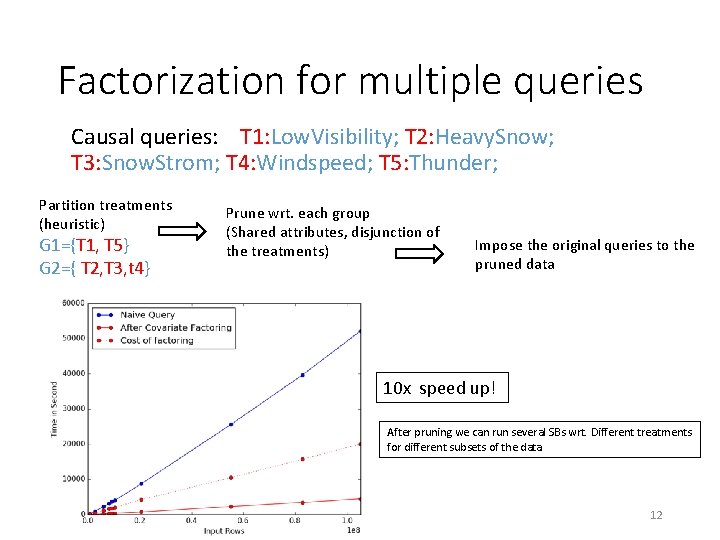
Factorization for multiple queries Causal queries: T 1: Low. Visibility; T 2: Heavy. Snow; T 3: Snow. Strom; T 4: Windspeed; T 5: Thunder; Partition treatments (heuristic) G 1={T 1, T 5} G 2={ T 2, T 3, t 4} Prune wrt. each group (Shared attributes, disjunction of the treatments) Impose the original queries to the pruned data 10 x speed up! After pruning we can run several SBs wrt. Different treatments for different subsets of the data 12
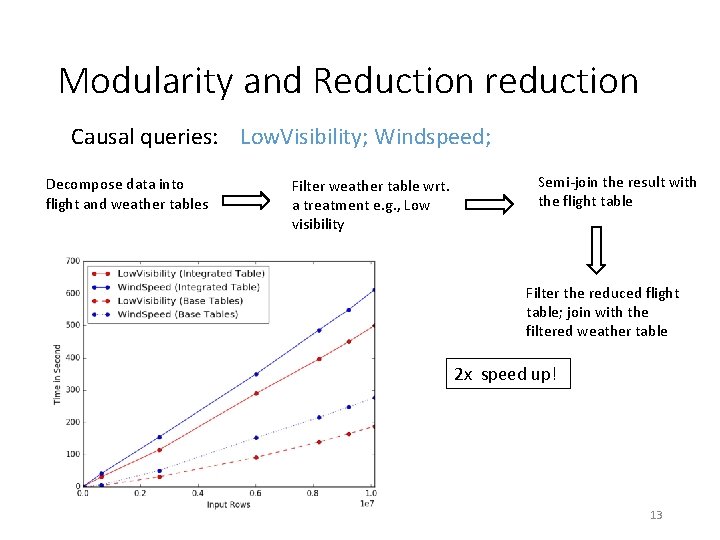
Modularity and Reduction reduction Causal queries: Low. Visibility; Windspeed; Decompose data into flight and weather tables Filter weather table wrt. a treatment e. g. , Low visibility Semi-join the result with the flight table Filter the reduced flight table; join with the filtered weather table 2 x speed up! 13

END 14
- Slides: 14