Peaks DNAse Iseq CHIPseq SIGNAL PROCESSING FOR NEXTGEN



- Slides: 41
Peaks DNAse I-seq CHIP-seq SIGNAL PROCESSING FOR NEXT-GEN SEQUENCING DATA Gene models RNA-seq RIP/CLIP-seq Transcripts Binding sites FAIRE-seq 1
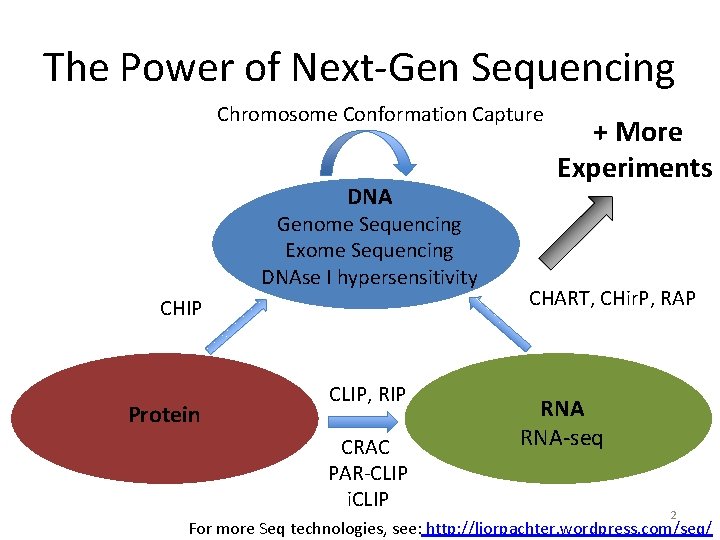
The Power of Next-Gen Sequencing Chromosome Conformation Capture DNA Genome Sequencing Exome Sequencing DNAse I hypersensitivity CHIP Protein CLIP, RIP CRAC PAR-CLIP i. CLIP + More Experiments CHART, CHir. P, RAP RNA-seq 2 For more Seq technologies, see: http: //liorpachter. wordpress. com/seq/
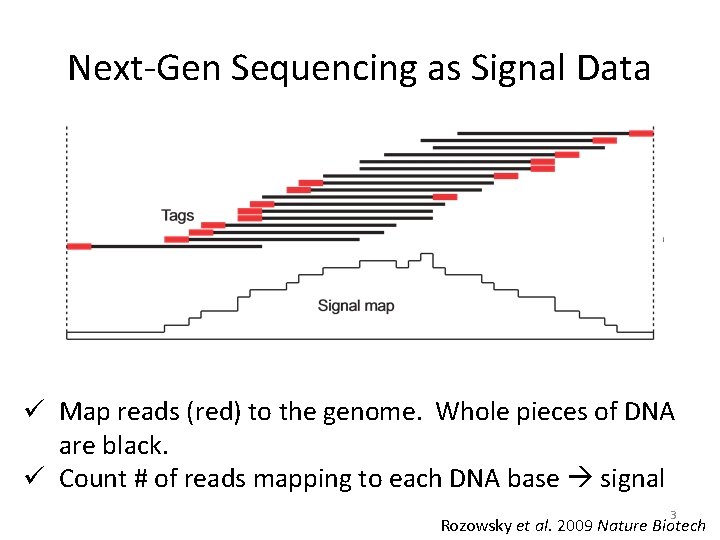
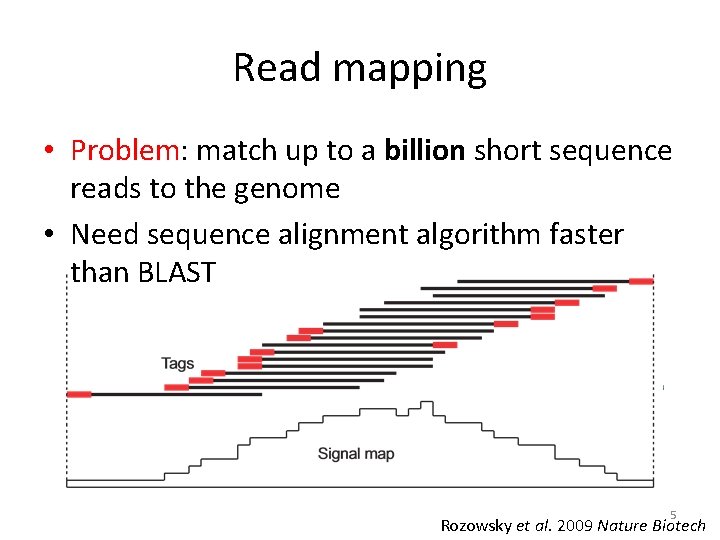
Next-Gen Sequencing as Signal Data ü Map reads (red) to the genome. Whole pieces of DNA are black. ü Count # of reads mapping to each DNA base signal 3 Rozowsky et al. 2009 Nature Biotech
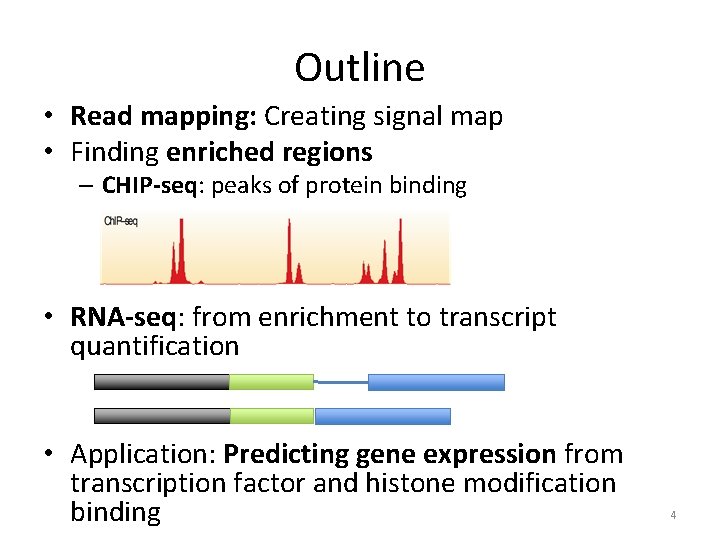
Outline • Read mapping: Creating signal map • Finding enriched regions – CHIP-seq: peaks of protein binding • RNA-seq: from enrichment to transcript quantification • Application: Predicting gene expression from transcription factor and histone modification binding 4
Read mapping • Problem: match up to a billion short sequence reads to the genome • Need sequence alignment algorithm faster than BLAST 5 Rozowsky et al. 2009 Nature Biotech
Read mapping (sequence alignment) • Dynamic programming – Optimal, but SLOW • BLAST – Searches primarily for close matches, still too slow for high throughput sequence read mapping • Read mapping – Only want very close matches, must be super fast 6
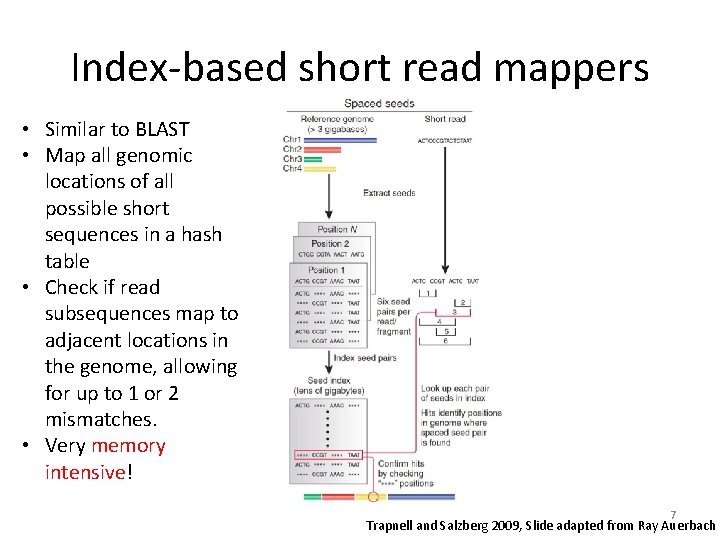
Index-based short read mappers • Similar to BLAST • Map all genomic locations of all possible short sequences in a hash table • Check if read subsequences map to adjacent locations in the genome, allowing for up to 1 or 2 mismatches. • Very memory intensive! 7 Trapnell and Salzberg 2009, Slide adapted from Ray Auerbach
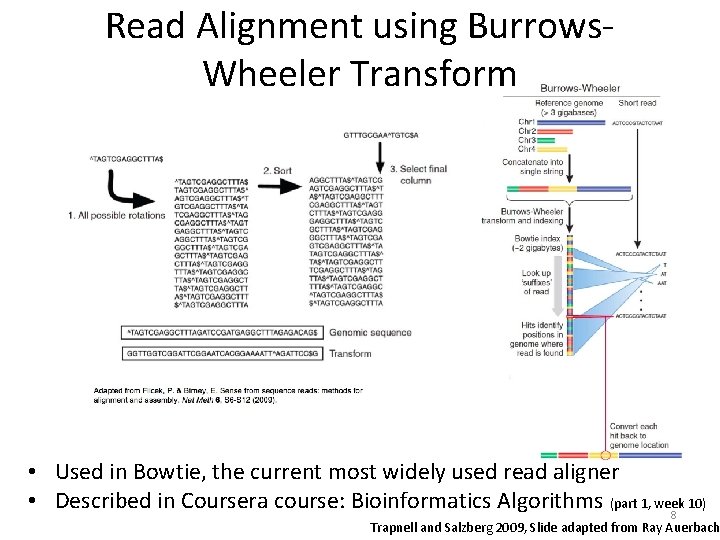
Read Alignment using Burrows. Wheeler Transform • Used in Bowtie, the current most widely used read aligner • Described in Coursera course: Bioinformatics Algorithms (part 1, week 10) 8 Trapnell and Salzberg 2009, Slide adapted from Ray Auerbach
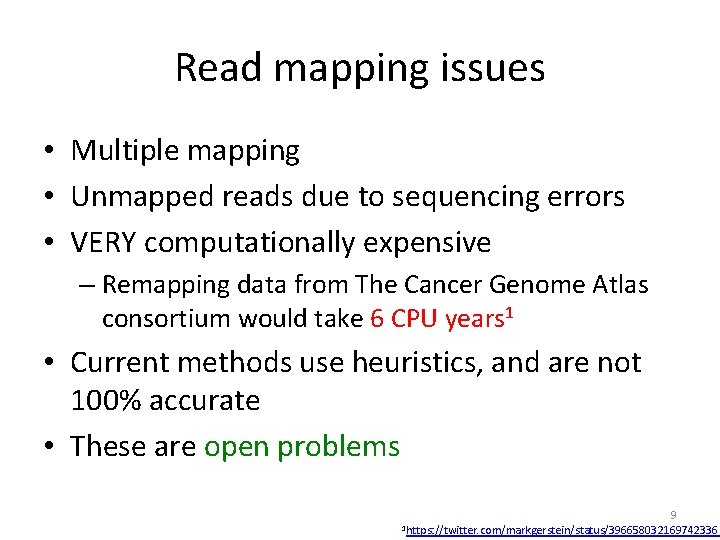
Read mapping issues • Multiple mapping • Unmapped reads due to sequencing errors • VERY computationally expensive – Remapping data from The Cancer Genome Atlas consortium would take 6 CPU years 1 • Current methods use heuristics, and are not 100% accurate • These are open problems 9 1 https: //twitter. com/markgerstein/status/396658032169742336
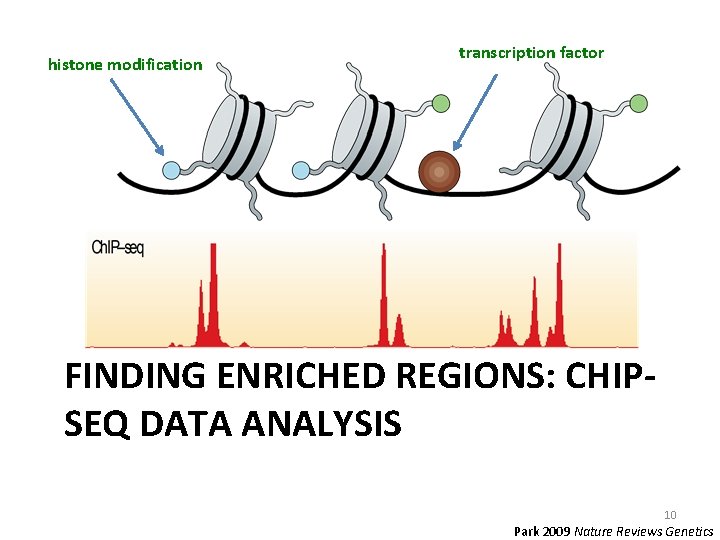
histone modification transcription factor FINDING ENRICHED REGIONS: CHIPSEQ DATA ANALYSIS 10 Park 2009 Nature Reviews Genetics
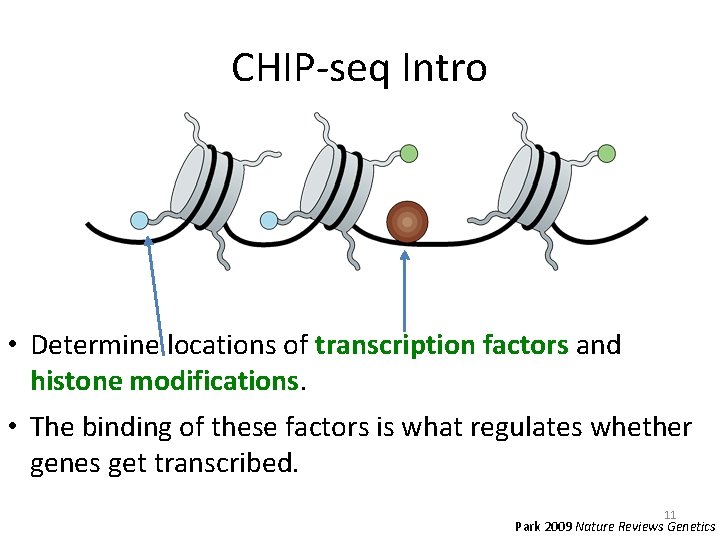
CHIP-seq Intro • Determine locations of transcription factors and histone modifications. • The binding of these factors is what regulates whether genes get transcribed. 11 Park 2009 Nature Reviews Genetics
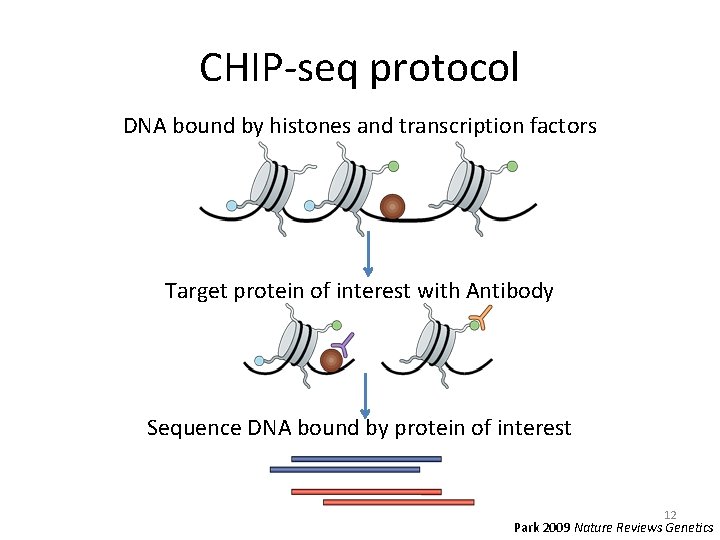
CHIP-seq protocol DNA bound by histones and transcription factors Target protein of interest with Antibody Sequence DNA bound by protein of interest 12 Park 2009 Nature Reviews Genetics
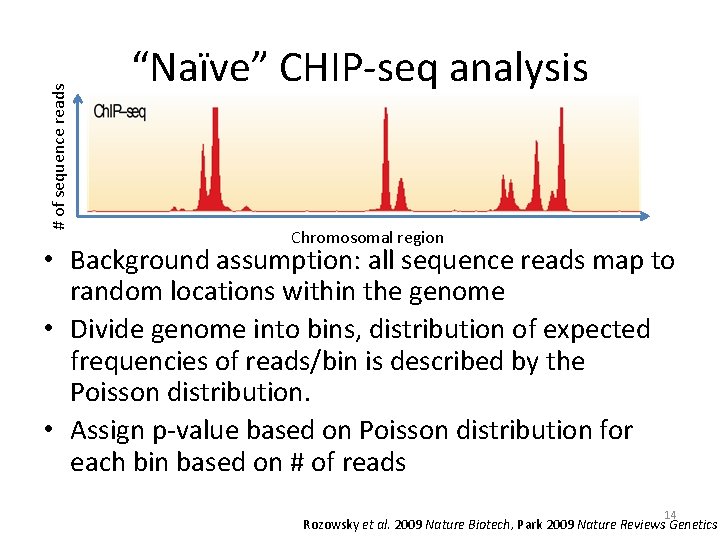
# of sequence reads CHIP-seq Data Chromosomal region Basic interpretation: Signal map to represents binding profile of protein to DNA How do we identify binding sites from CHIP-seq signal “peaks”? 13 Park 2009 Nature Reviews Genetics
# of sequence reads “Naïve” CHIP-seq analysis Chromosomal region • Background assumption: all sequence reads map to random locations within the genome • Divide genome into bins, distribution of expected frequencies of reads/bin is described by the Poisson distribution. • Assign p-value based on Poisson distribution for each bin based on # of reads 14 Rozowsky et al. 2009 Nature Biotech, Park 2009 Nature Reviews Genetics
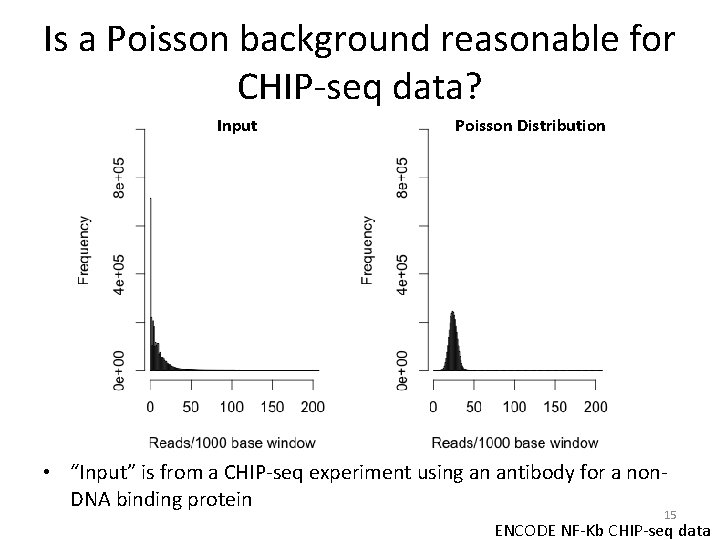
Is a Poisson background reasonable for CHIP-seq data? Input Poisson Distribution • “Input” is from a CHIP-seq experiment using an antibody for a non. DNA binding protein 15 ENCODE NF-Kb CHIP-seq data
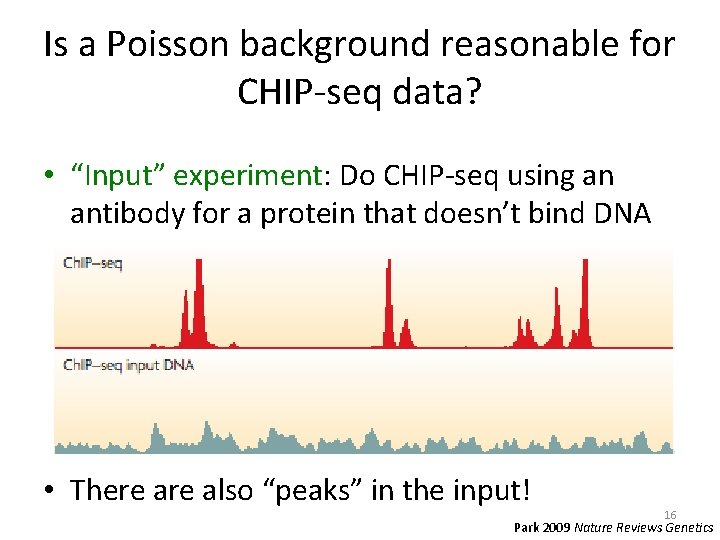
Is a Poisson background reasonable for CHIP-seq data? • “Input” experiment: Do CHIP-seq using an antibody for a protein that doesn’t bind DNA • There also “peaks” in the input! 16 Park 2009 Nature Reviews Genetics
Peakseq Rozowsky et al. 2009 Nature Biotech Gerstein Lab 17
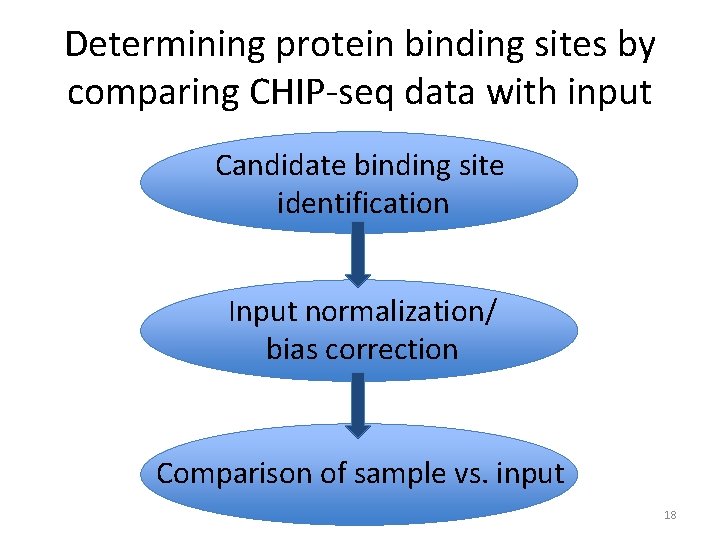
Determining protein binding sites by comparing CHIP-seq data with input Candidate binding site identification Input normalization/ bias correction Comparison of sample vs. input 18
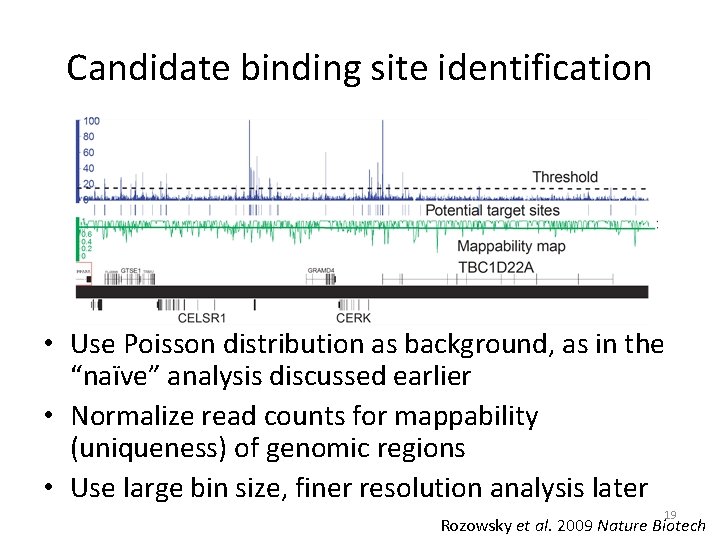
Candidate binding site identification • Use Poisson distribution as background, as in the “naïve” analysis discussed earlier • Normalize read counts for mappability (uniqueness) of genomic regions • Use large bin size, finer resolution analysis later 19 Rozowsky et al. 2009 Nature Biotech
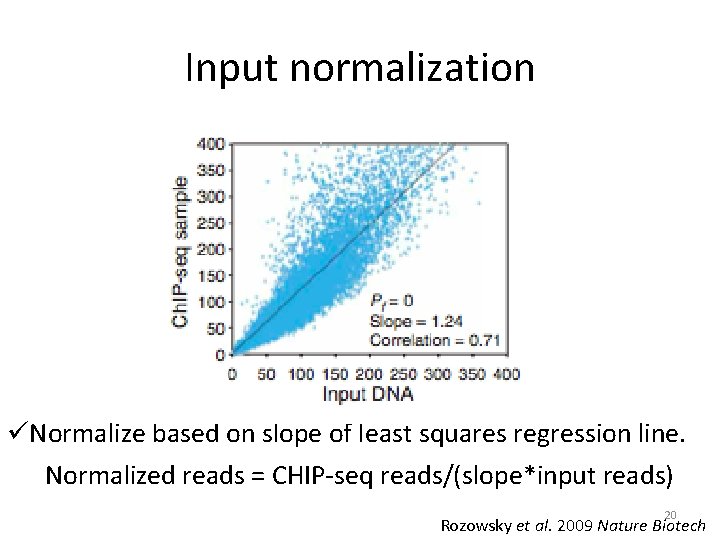
Input normalization üNormalize based on slope of least squares regression line. Normalized reads = CHIP-seq reads/(slope*input reads) 20 Rozowsky et al. 2009 Nature Biotech
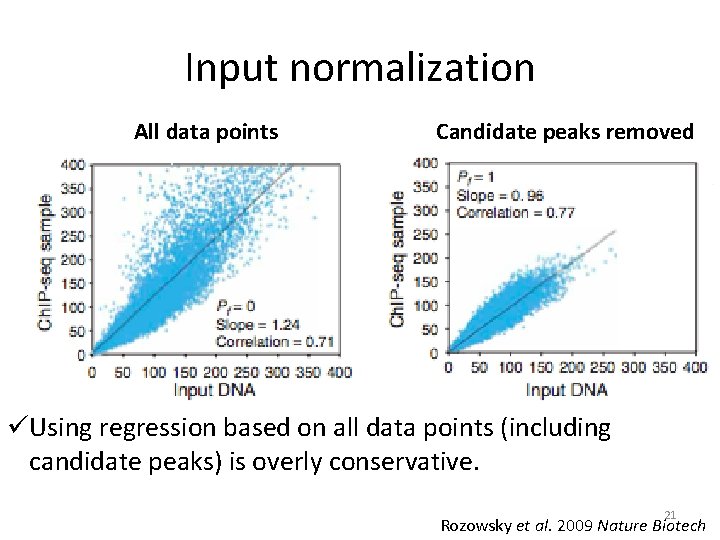
Input normalization All data points Candidate peaks removed üUsing regression based on all data points (including candidate peaks) is overly conservative. 21 Rozowsky et al. 2009 Nature Biotech
Calling peaks vs. input • Binomial distribution – Each genomic region is like a coin – The combined number of reads is the # of times that the coin is flipped – Look for regions that are “weighted” toward sample, not input 22 ENCODE NF-Kb CHIP-seq data
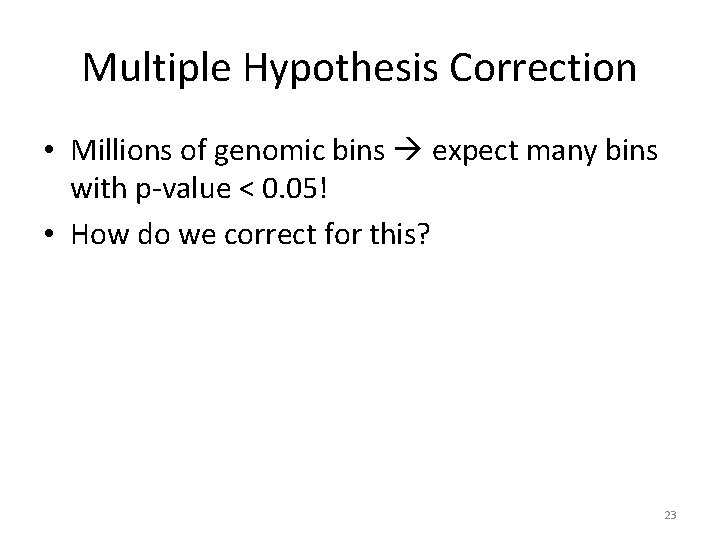
Multiple Hypothesis Correction • Millions of genomic bins expect many bins with p-value < 0. 05! • How do we correct for this? 23
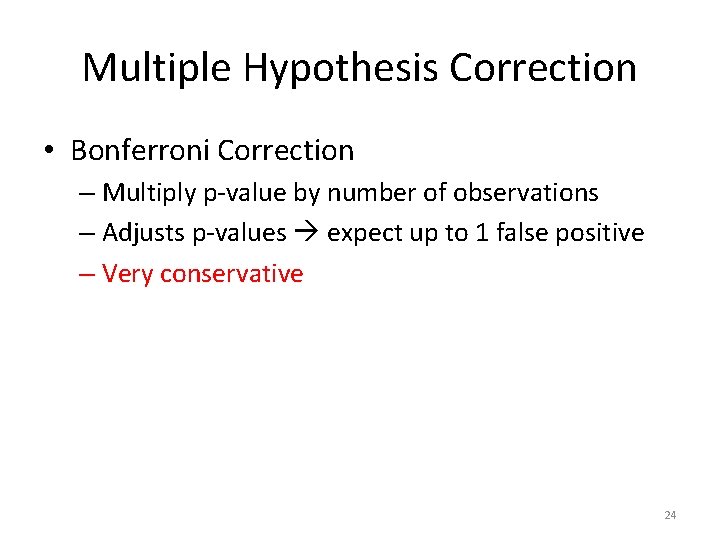
Multiple Hypothesis Correction • Bonferroni Correction – Multiply p-value by number of observations – Adjusts p-values expect up to 1 false positive – Very conservative 24
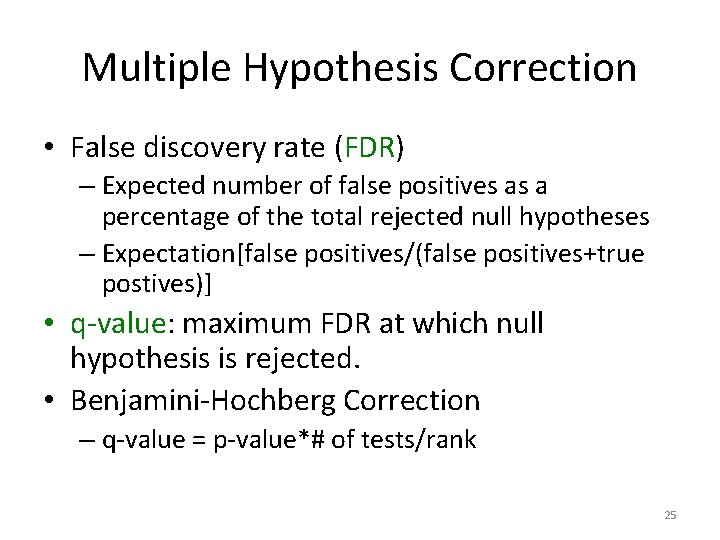
Multiple Hypothesis Correction • False discovery rate (FDR) – Expected number of false positives as a percentage of the total rejected null hypotheses – Expectation[false positives/(false positives+true postives)] • q-value: maximum FDR at which null hypothesis is rejected. • Benjamini-Hochberg Correction – q-value = p-value*# of tests/rank 25
Is Peak. Seq an optimal algorithm? 26
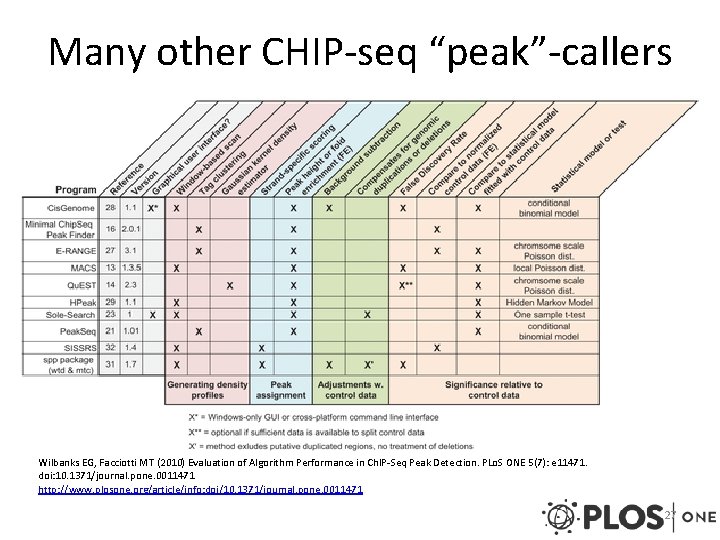
Many other CHIP-seq “peak”-callers Wilbanks EG, Facciotti MT (2010) Evaluation of Algorithm Performance in Ch. IP-Seq Peak Detection. PLo. S ONE 5(7): e 11471. doi: 10. 1371/journal. pone. 0011471 http: //www. plosone. org/article/info: doi/10. 1371/journal. pone. 0011471 27
CHIP-seq summary • Method to determine DNA binding sites of transcription factors or locations of histone modifications • Must normalize sequence reads to experimental input • Search for signal enrichment to find peaks – Peakseq: binomial test + Benjamini-Hochberg correction – Many other methods 28
RNA-SEQ: GOING BEYOND ENRICHMENT 29
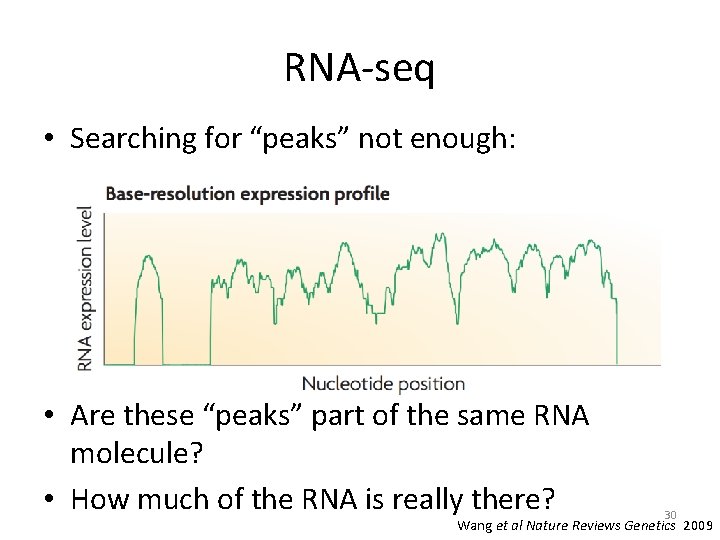
RNA-seq • Searching for “peaks” not enough: • Are these “peaks” part of the same RNA molecule? • How much of the RNA is really there? 30 Wang et al Nature Reviews Genetics 2009
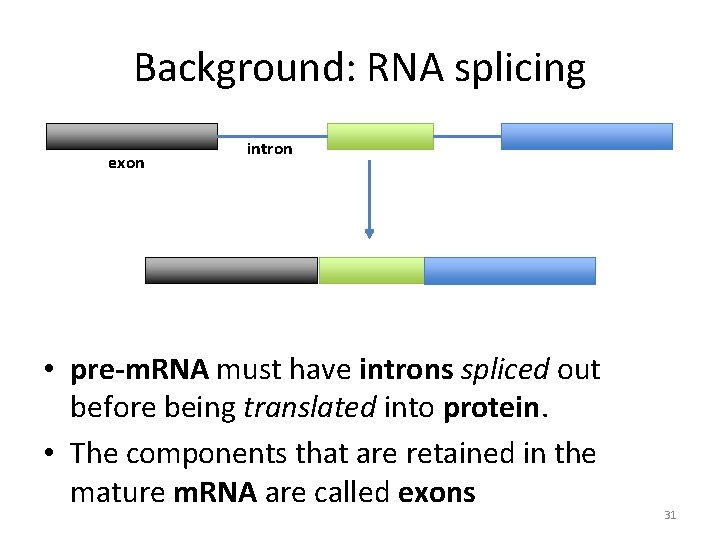
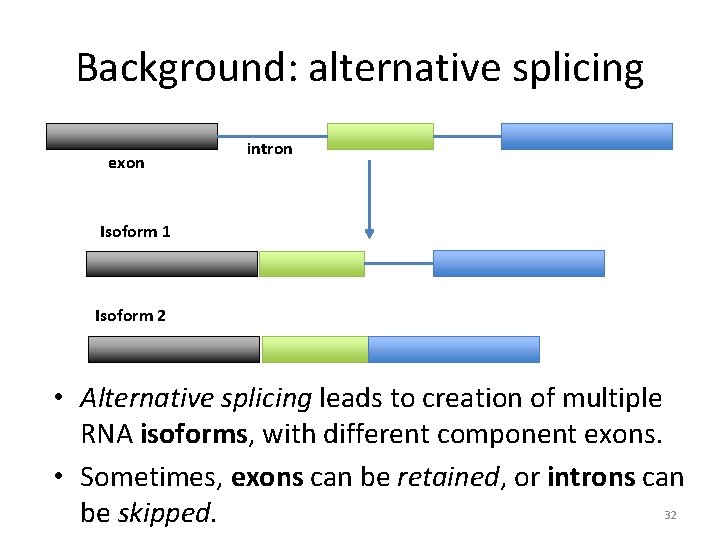
Background: RNA splicing exon intron • pre-m. RNA must have introns spliced out before being translated into protein. • The components that are retained in the mature m. RNA are called exons 31
Background: alternative splicing exon intron Isoform 1 Isoform 2 • Alternative splicing leads to creation of multiple RNA isoforms, with different component exons. • Sometimes, exons can be retained, or introns can be skipped. 32
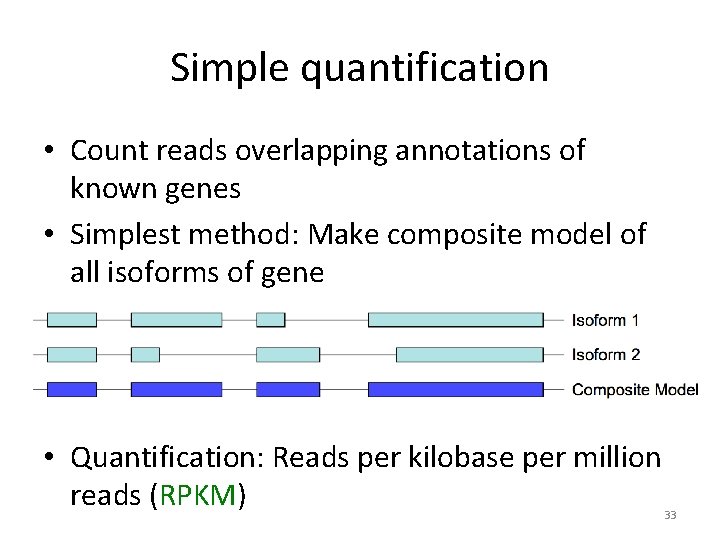
Simple quantification • Count reads overlapping annotations of known genes • Simplest method: Make composite model of all isoforms of gene • Quantification: Reads per kilobase per million reads (RPKM) 33
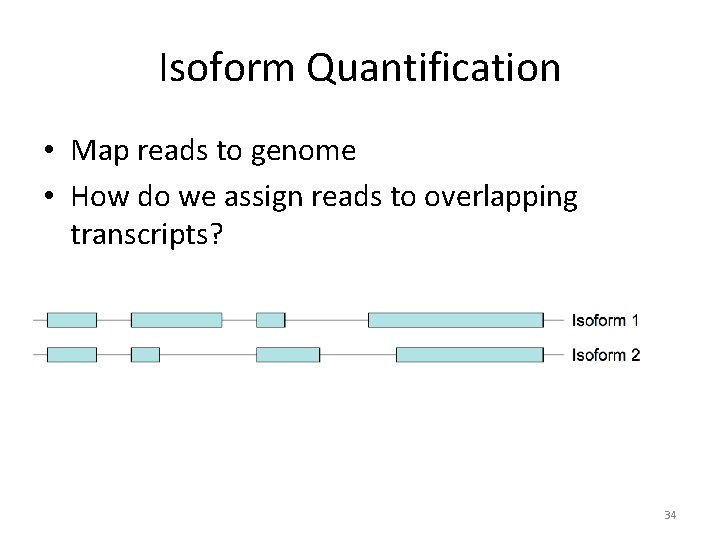
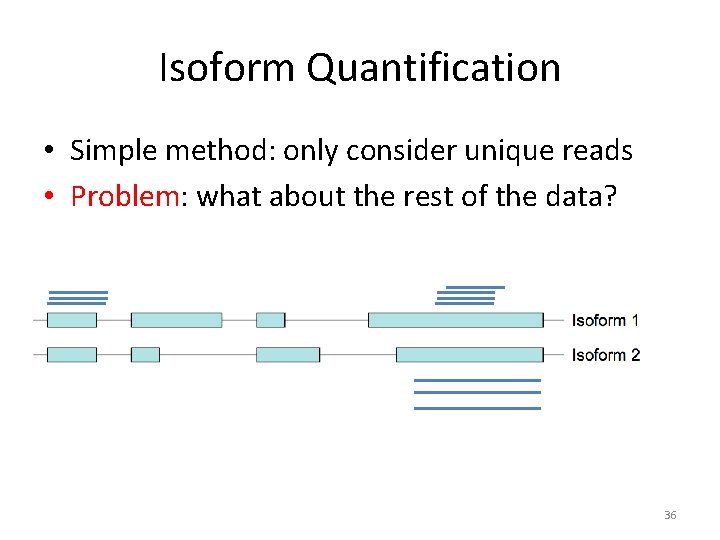
Isoform Quantification • Map reads to genome • How do we assign reads to overlapping transcripts? 34
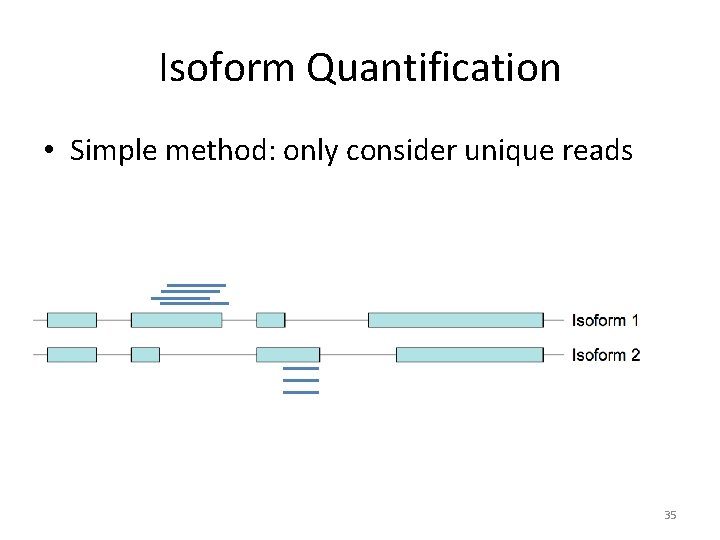
Isoform Quantification • Simple method: only consider unique reads 35
Isoform Quantification • Simple method: only consider unique reads • Problem: what about the rest of the data? 36
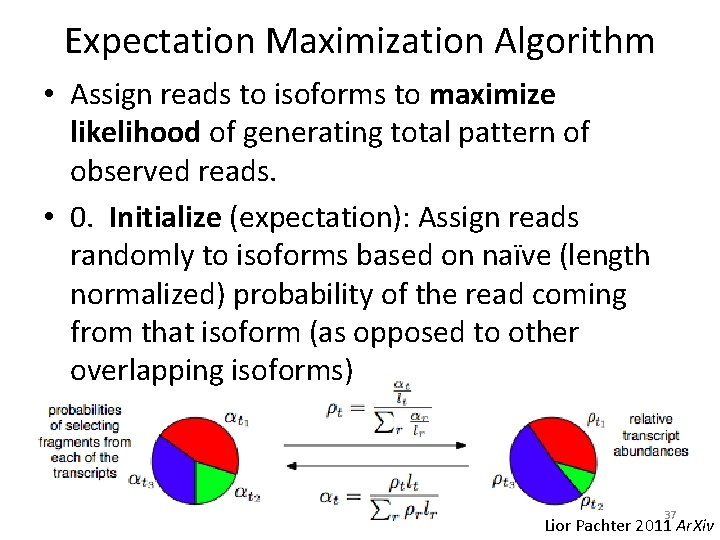
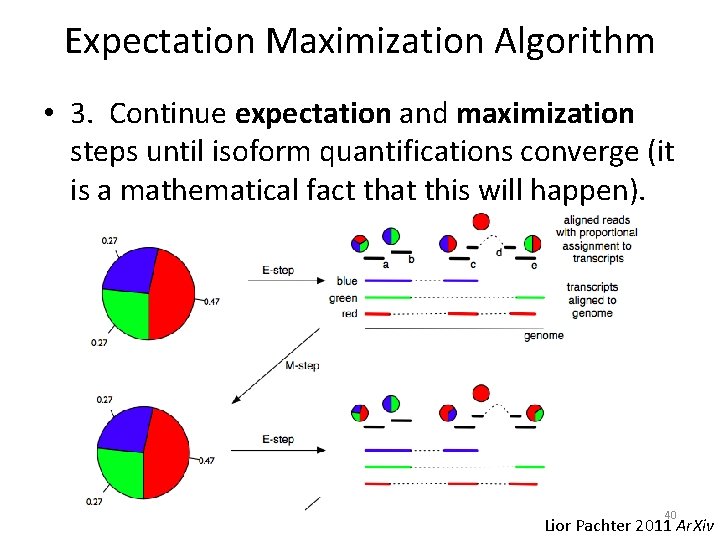
Expectation Maximization Algorithm • Assign reads to isoforms to maximize likelihood of generating total pattern of observed reads. • 0. Initialize (expectation): Assign reads randomly to isoforms based on naïve (length normalized) probability of the read coming from that isoform (as opposed to other overlapping isoforms) 37 Lior Pachter 2011 Ar. Xiv
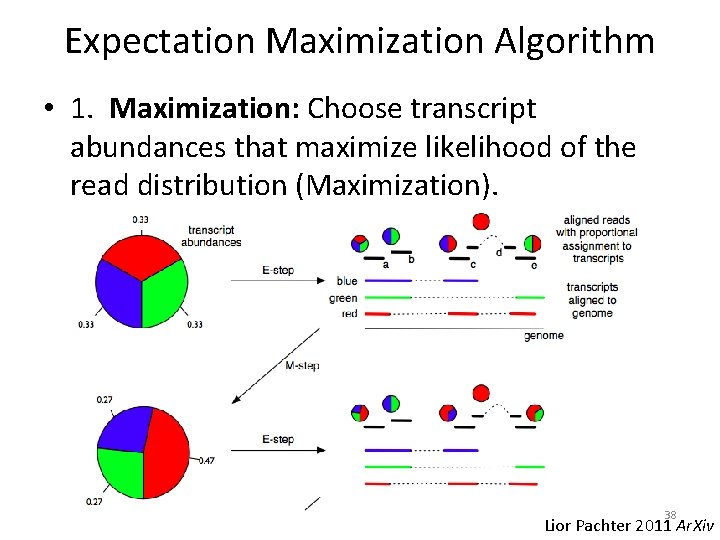
Expectation Maximization Algorithm • 1. Maximization: Choose transcript abundances that maximize likelihood of the read distribution (Maximization). 38 Lior Pachter 2011 Ar. Xiv
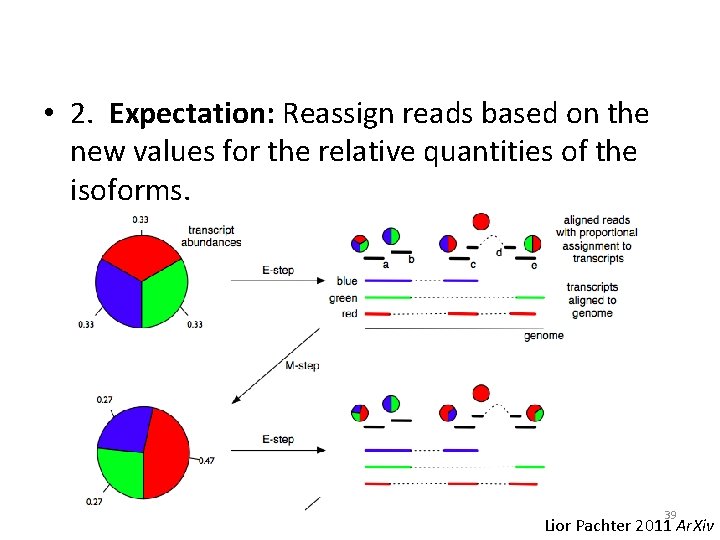
• 2. Expectation: Reassign reads based on the new values for the relative quantities of the isoforms. 39 Lior Pachter 2011 Ar. Xiv
Expectation Maximization Algorithm • 3. Continue expectation and maximization steps until isoform quantifications converge (it is a mathematical fact that this will happen). 40 Lior Pachter 2011 Ar. Xiv
RNA-Seq conclusions • RNA-Seq is a powerful tool to identify new transcribed regions of the genome and compare the RNA complements of different tissues. • Quantification harder than CHIP-seq because of RNA splicing • Expectation maximization algorithm can be useful for quantifying overlapping transcripts 41