Part 1 Geothermal Power Why Growing demand for


- Slides: 45
Part 1 Geothermal Power
Why? Growing demand for energy Concern about CO 2 from fossil-fuel burning Recent Report, The Future of Geothermal Energy, gives favorable assessment
Indian Point Power Plants 1 and 2, big energy producers in the NY City area
Electric Power Primer Typical Big Power Plant generates 1 GW One billion watts … 109 J/s of energy In a year it generates 109 J/s x 3. 1 x 10⁷ s/year = 3. 1 x 10¹⁶ J/year A nice round number is 1018 J That’s the amount of power a 1 GW plant Generates in its nominal 30 -year lifetime
US Electrical Power Production Capacity 906 GW in 2006 rate of increase 1% per year about 1000 big power plants need 10 new ones each year
An aside … controversial Cape Wind project offshore Cape Cod would generated 0. 4 GW by 120 turbines Offsets growth of New England power demand for about a year or two …
Geothermal lumped into “Other Renewable” … not much!
Where is the Heat? Typical Geothermal Gradient: typical region: 20 K/km volcanic region: 100 K/km Power production needs temperatures well above 100 deg-C So drilling needed to access heat
3. 5 km – easy to drill, but not very hot What’s that hot spot?
Yellowstone Caldera Biggest Volcano in US here I am standing by Old Faithful above 10, 000 cubic km of magma
6. 5 km – expensive but routine, areas of western US are hot
10 km – very hot, but pushing limits of technology
Heat in Rock: Q = r Cp V DT Heat = density * heat capacity * Volume * change in Temperature Density = 2500 kg/m 3 Heat Capacity = 1000 J/kg. K Volume = 1 cubic km = 109 m 3 DT = 100 K So Q = 2. 5 x 10¹⁷ J A 1 GW power plant generates 3. 1 x 10¹⁶ J/year, so this is about tens years of a 1 GW power plant
Remember 1018 J is roughly the amount of energy produced by a power plant in its nominal 30 year lifetime, so these estimates indicate a huge supply of heat energy
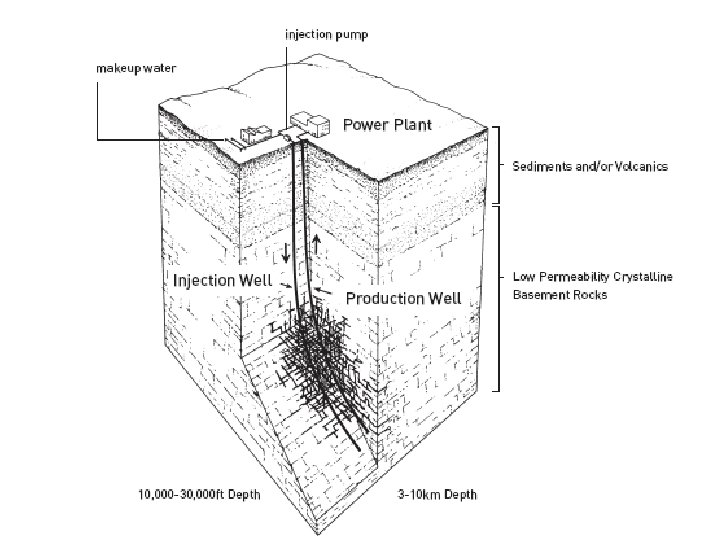
How to access heat? Drill 2 holes, one to inject cold water, another to extract hot water Circulate fluid Use hot water to generate steam that turns turbine of more-or-less standard design
Issues Drill 2 holes … expense of drilling Circulate fluid … low permeability of rock Generate steam … dissolved minerals in water
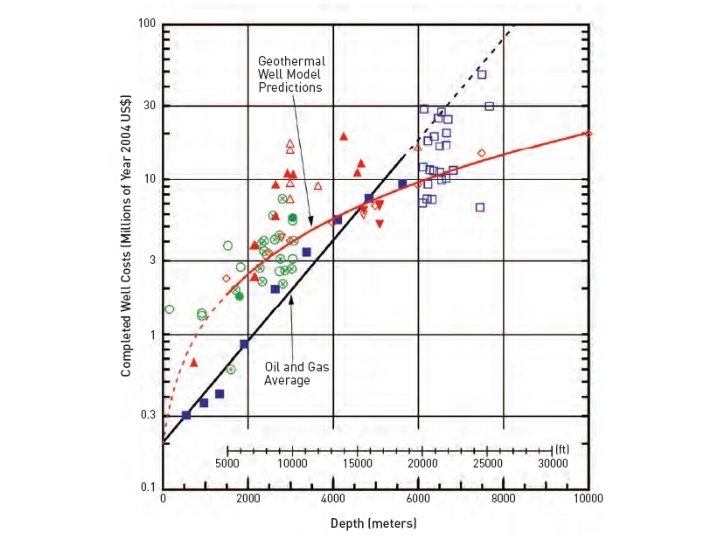
Money Counts! Any sort of mining or extraction is an Economic Activity that competes by price against alternatives If the economics are not right It will not be done even if it is in theoretically possible to do
Solution to low permeabiliy Artificially increase permeability by creating fractures “Hydrofracture” … pressurize well until you crack the surrounding rock, routinely used in oil extraction, at least for small volumes of rock
60 MW Krafla power plant, Iceland: heat from 33 wells drilled into volcano Tiny by US standards Lots of wells
Power plant Magma chamber
Part 2 Fresh Water Possibly the most Limiting Resource
How much water do you use in a day?
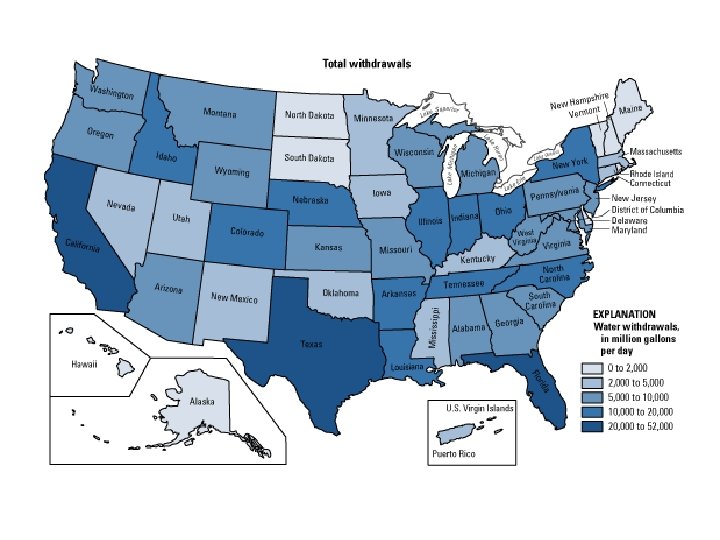
US Water Usage, % Public Supply Domestic Supply 11 1 Irrigation Livestock & Aquaculture Industrial Mining 34 2 5 1 Thermoelectric Power 48
US Water Usage, billion gallons / day Public Supply Domestic Supply 27. 3 0. 6 Irrigation Livestock & Aquaculture Industrial Mining 80 3. 4 14. 9 1. 2 Thermoelectric Power 135 Total 262
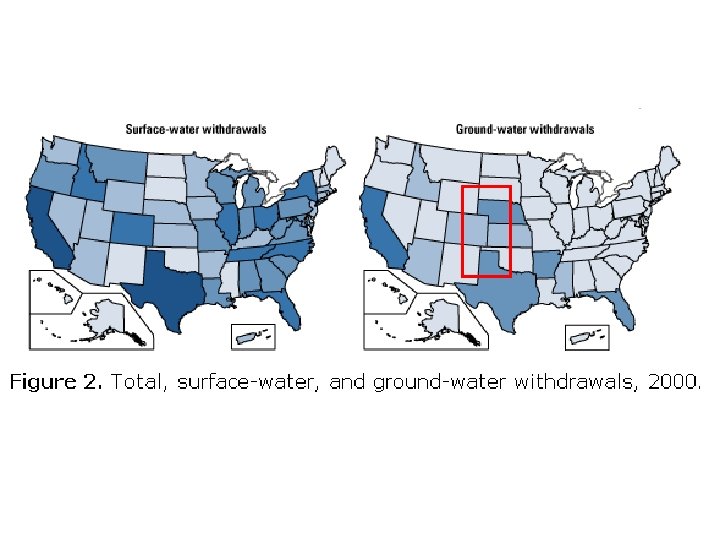
Ogallala Aquifer
US Water Usage, billion gallons / day Public Supply Domestic Supply 27. 3 0. 6 Irrigation Livestock & Aquaculture Industrial Mining 80 3. 4 14. 9 1. 2 Thermoelectric Power 135 Total 262
Total 262 billion gallons/day 362 cubic kilometers per year H 20 7 km
Public & Domestic Supply 27. 9 billion gallons/day 266 gallons person per day drinking cooking & washing dishes washing clothes flushing toilet
Cooling water for power plants 135 billion gallons/day 450 gallons person per day 40 k. Wh average daily electrical consumption person in US So 0. 08 k. Wh per gallon a gallon lights the bulb for an hour
Irrigation 80 billion gallons/day 266 gallons person per day 2750 calories average daily food consumption person in US So 10. 3 calories per gallon 2. 7 calories per liter a gallon gets you a chip
Wheat: 3500 calories/kg Wheat: 4. 6 calories/liter About 750 liters of water to grow a kilogram
Rice: 3700 calories/kg Rice: 2. 4 calories/liter About 1550 liters of water to grow a kilogram
How much irrigation water does the world need? 2000 calories/day minimum At 3 cal/liter 670 liters/day 6 billion people 365 days/year = 1. 46 1015 liters/year = 14700 cubic kilometers per year So how much is available ?
The Hydrologic Cycle 108, 000 km 3/year precipitated on land 46, 000 km 3/year transported on shore 62, 000 km 3/year evaporated from continental reservoirs 46, 000 km 3/year runoff to oceans
Need 14, 700 km 3 Available 46, 000 km 3 So superficially about three times as much water is available than is needed. But consider …
Some runoff is in uninhabited regions Runoff is uneven during the year and may be lost to sea before it can be used The rest of the biosphere uses water, too Human populations are growing
Runoff is uneven during the year and may be lost to sea before it can be used Solution – Reservoirs (“Impoundments”) created by damming rivers
Global impoundments of water 8400 km 3 Not much growth in last decade, except in Asia. Australia
Regional distribution of large dams
Dams in the US. Note that the red symbols indicate high hazard potential. Dam maintenance has not been a high priority for many municipalities and other dam owners.