Packaging Corporation of America Goldman Sachs 12 th
- Slides: 28
Packaging Corporation of America Goldman Sachs 12 th Annual Cyclicals and Specialty Materials Forum May 19, 2004 Paul T. Stecko Chairman and CEO 1
Packaging Corporation of America Certain statements in this presentation are forward-looking statements. Forward-looking statements include statements about our future financial condition, our industry and our business strategy. Statements that contain words such as “anticipate”, “believe”, “expect”, “intend”, “estimate”, “hope” or similar expressions, are forward-looking statements. These forward-looking statements are based on the current expectations of PCA. Because forward-looking statements involve inherent risks and uncertainties, the plans, actions and actual results of PCA could differ materially. Among the factors that could cause plans, actions and results to differ materially from PCA’s current expectations are those identified under the caption “Risk Factors” in PCA’s Form 10 K filed with the Securities and Exchange Commission and available at the SEC’s website at “www. sec. gov”. 2
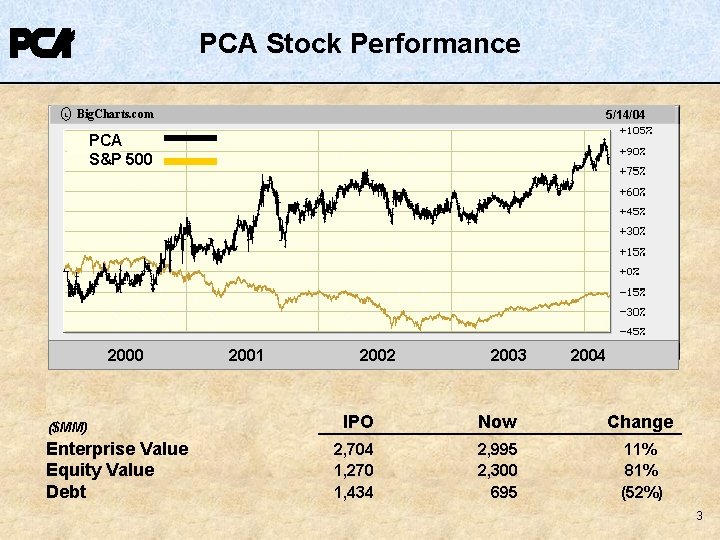
PCA Stock Performance L Big. Charts. com 5/14/04 PCA S&P 500 2000 ($MM) Enterprise Value Equity Value Debt 2001 2002 2003 2004 IPO Now Change 2, 704 1, 270 1, 434 2, 995 2, 300 695 11% 81% (52%) 3
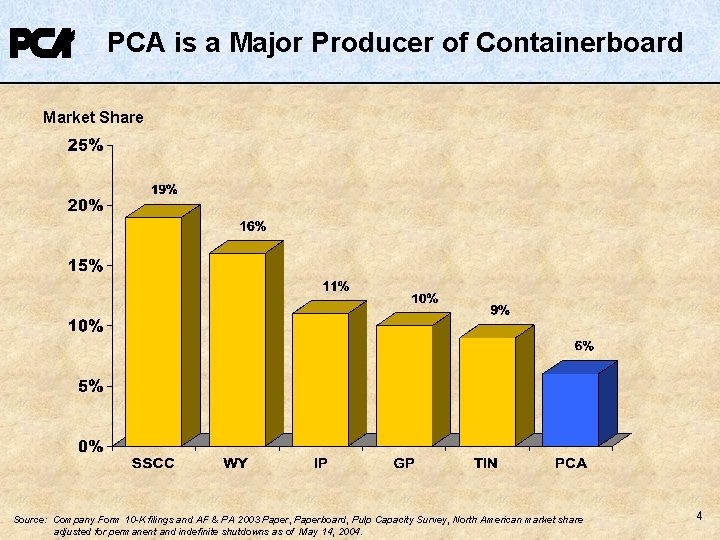
PCA is a Major Producer of Containerboard Market Share Source: Company Form 10 -K filings and AF & PA 2003 Paper, Paperboard, Pulp Capacity Survey, North American market share adjusted for permanent and indefinite shutdowns as of May 14, 2004. 4
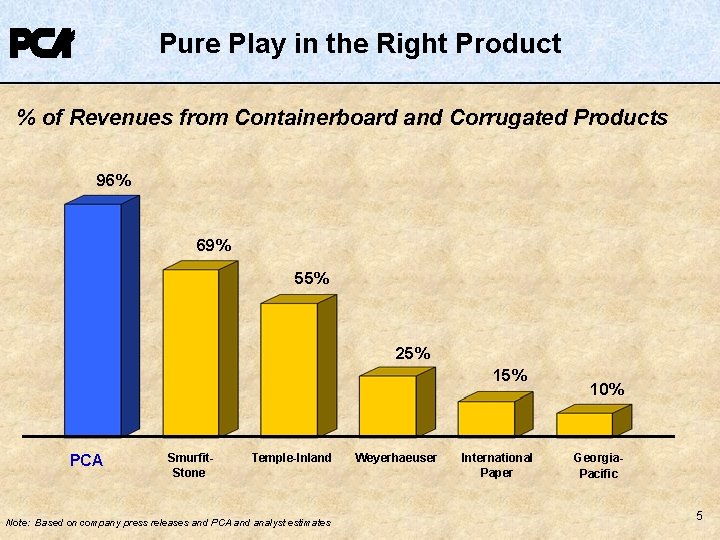
Pure Play in the Right Product % of Revenues from Containerboard and Corrugated Products 96% 69% 55% 25% 15% PCA Smurfit. Stone Temple-Inland Note: Based on company press releases and PCA and analyst estimates Weyerhaeuser International Paper 10% Georgia. Pacific 5
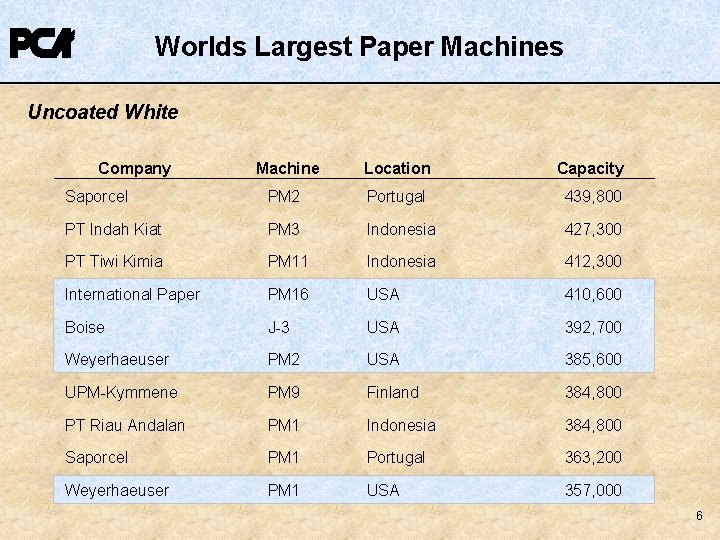
Worlds Largest Paper Machines Uncoated White Company Machine Location Capacity Saporcel PM 2 Portugal 439, 800 PT Indah Kiat PM 3 Indonesia 427, 300 PT Tiwi Kimia PM 11 Indonesia 412, 300 International Paper PM 16 USA 410, 600 Boise J-3 USA 392, 700 Weyerhaeuser PM 2 USA 385, 600 UPM-Kymmene PM 9 Finland 384, 800 PT Riau Andalan PM 1 Indonesia 384, 800 Saporcel PM 1 Portugal 363, 200 Weyerhaeuser PM 1 USA 357, 000 6
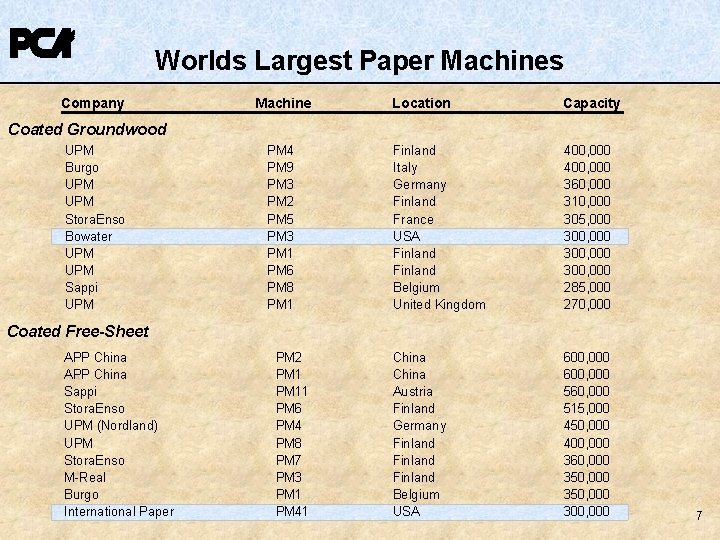
Worlds Largest Paper Machines Company Machine Location Capacity Finland Italy Germany Finland France USA Finland Belgium United Kingdom 400, 000 360, 000 310, 000 305, 000 300, 000 285, 000 270, 000 China Austria Finland Germany Finland Belgium USA 600, 000 560, 000 515, 000 450, 000 400, 000 360, 000 350, 000 300, 000 Coated Groundwood UPM Burgo UPM Stora. Enso Bowater UPM Sappi UPM PM 4 PM 9 PM 3 PM 2 PM 5 PM 3 PM 1 PM 6 PM 8 PM 1 Coated Free-Sheet APP China Sappi Stora. Enso UPM (Nordland) UPM Stora. Enso M-Real Burgo International Paper PM 2 PM 11 PM 6 PM 4 PM 8 PM 7 PM 3 PM 1 PM 41 7
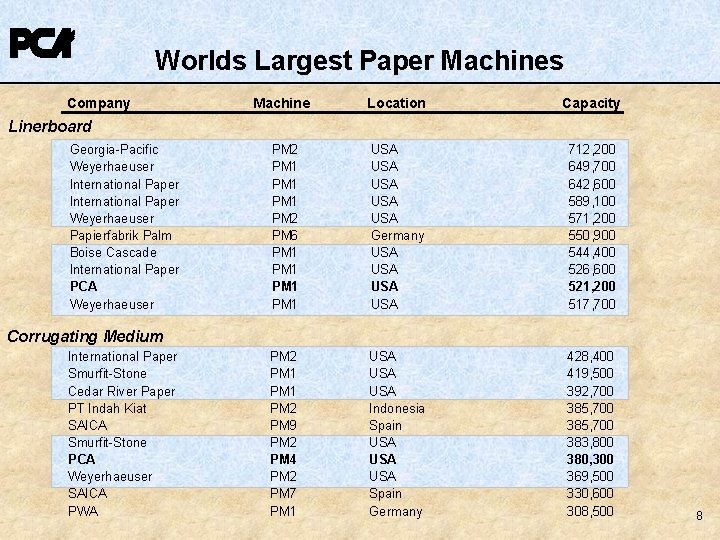
Worlds Largest Paper Machines Company Machine Location Capacity PM 2 PM 1 PM 2 PM 6 PM 1 USA USA USA Germany USA USA 712, 200 649, 700 642, 600 589, 100 571, 200 550, 900 544, 400 526, 600 521, 200 517, 700 PM 2 PM 1 PM 2 PM 9 PM 2 PM 4 PM 2 PM 7 PM 1 USA USA Indonesia Spain USA USA Spain Germany 428, 400 419, 500 392, 700 385, 700 383, 800 380, 300 369, 500 330, 600 308, 500 Linerboard Georgia-Pacific Weyerhaeuser International Paper Weyerhaeuser Papierfabrik Palm Boise Cascade International Paper PCA Weyerhaeuser Corrugating Medium International Paper Smurfit-Stone Cedar River Paper PT Indah Kiat SAICA Smurfit-Stone PCA Weyerhaeuser SAICA PWA 8
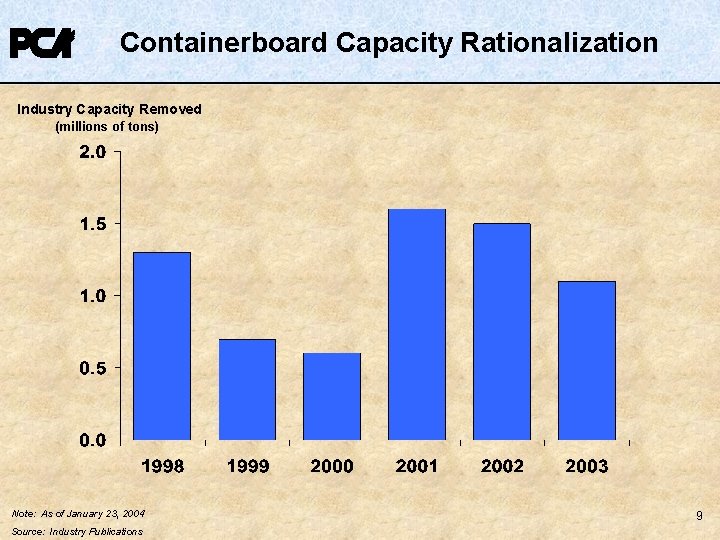
Containerboard Capacity Rationalization Industry Capacity Removed (millions of tons) Note: As of January 23, 2004 Source: Industry Publications 9
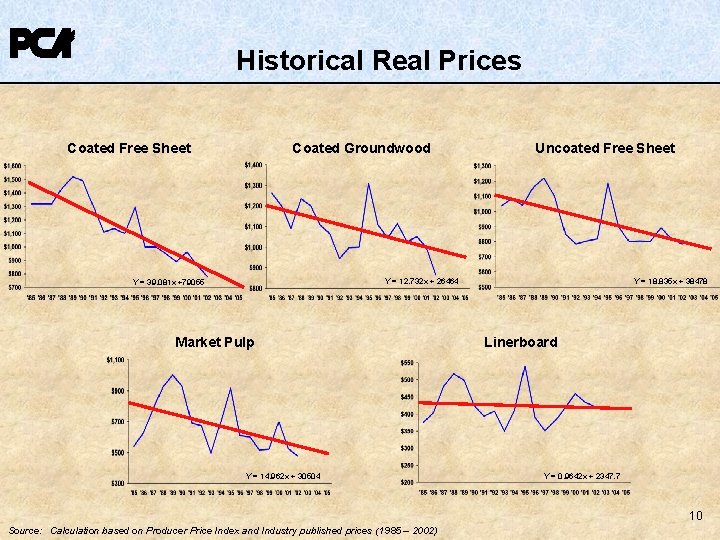
Historical Real Prices Coated Free Sheet Coated Groundwood Uncoated Free Sheet Y = 12. 732 x + 26464 Y = 39. 081 x +79055 Market Pulp Y = 14. 962 x + 30504 Y = 18. 835 x + 38478 Linerboard Y = 0. 9642 x + 2347. 7 10 Source: Calculation based on Producer Price Index and Industry published prices (1985 – 2002)
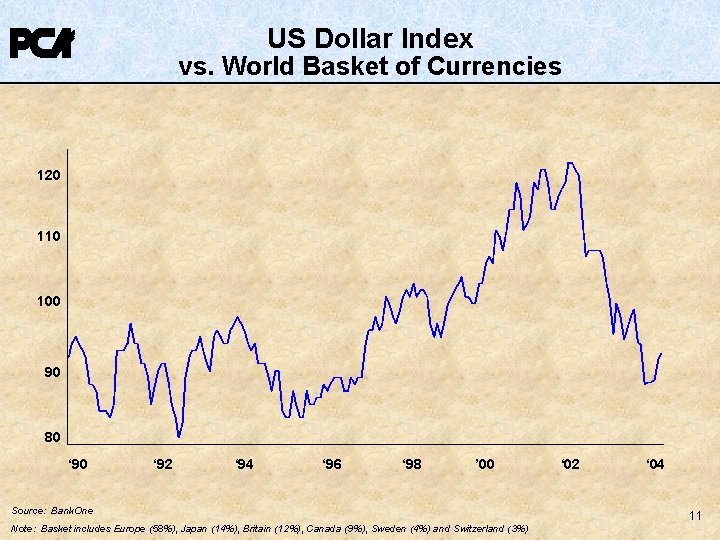
US Dollar Index vs. World Basket of Currencies 120 110 100 90 80 ‘ 92 ‘ 94 ‘ 96 ‘ 98 ’ 00 Source: Bank. One Note: Basket includes Europe (58%), Japan (14%), Britain (12%), Canada (9%), Sweden (4%) and Switzerland (3%) ‘ 02 ‘ 04 11
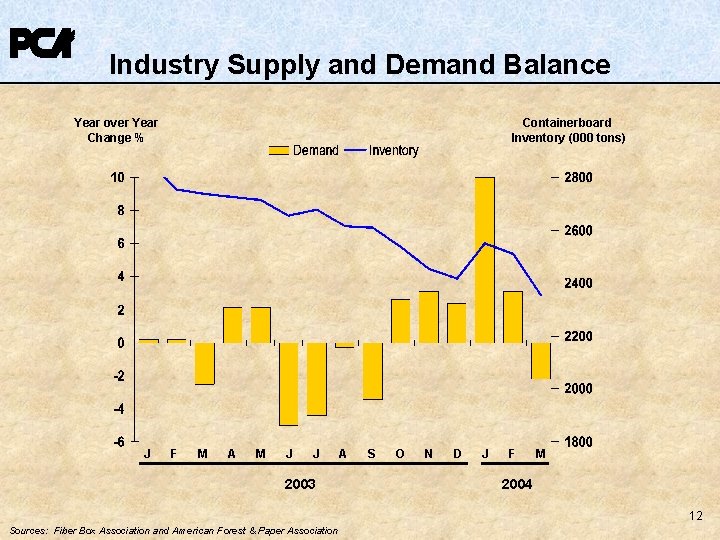
Industry Supply and Demand Balance Year over Year Change % J Containerboard Inventory (000 tons) F M A M J J 2003 A S O N D J F M 2004 12 Sources: Fiber Box Association and American Forest & Paper Association
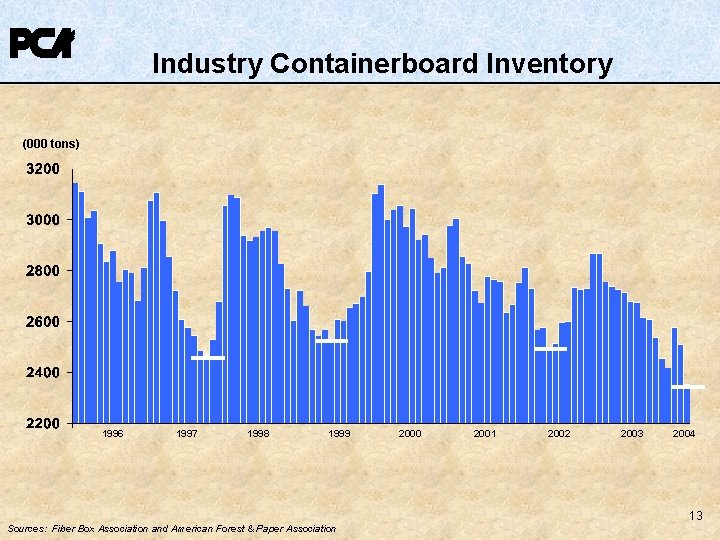
Industry Containerboard Inventory (000 tons) 1996 1997 1998 1999 2000 2001 2002 2003 2004 13 Sources: Fiber Box Association and American Forest & Paper Association
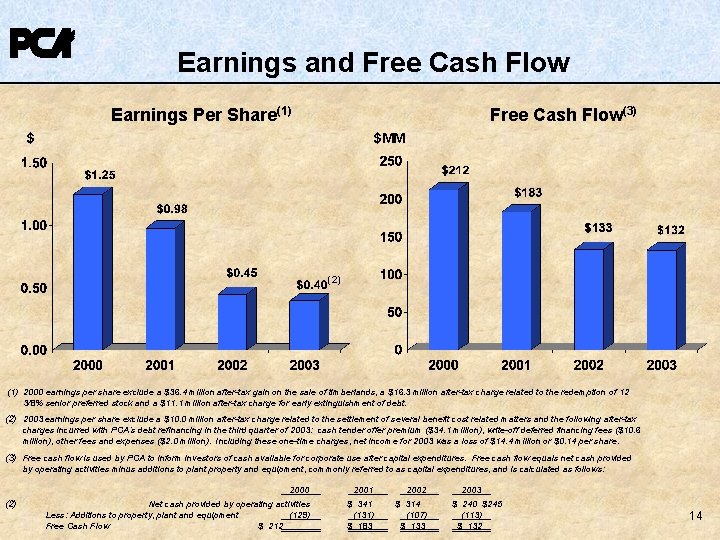
Earnings and Free Cash Flow Earnings Per Share(1) Free Cash Flow(3) $ $MM (2) (1) 2000 earnings per share exclude a $36. 4 million after-tax gain on the sale of timberlands, a $16. 3 million after-tax charge related to the redemption of 12 3/8% senior preferred stock and a $11. 1 million after-tax charge for early extinguishment of debt. (2) 2003 earnings per share exclude a $10. 0 million after-tax charge related to the settlement of several benefit cost related matters and the following after-tax charges incurred with PCA’s debt refinancing in the third quarter of 2003: cash tender offer premium ($34. 1 million), write-off deferred financing fees ($10. 6 million), other fees and expenses ($2. 0 million). Including these one-time charges, net income for 2003 was a loss of $14. 4 million or $0. 14 per share. (3) Free cash flow is used by PCA to inform investors of cash available for corporate use after capital expenditures. Free cash flow equals net cash provided by operating activities minus additions to plant property and equipment, commonly referred to as capital expenditures, and is calculated as follows: (2) 2000 Net cash provided by operating activities Less: Additions to property, plant and equipment (129) Free Cash Flow $ 212 2001 $ 341 (131) $ 183 2002 $ 314 (107) $ 133 2003 $ 240 $245 (113) $ 132 14
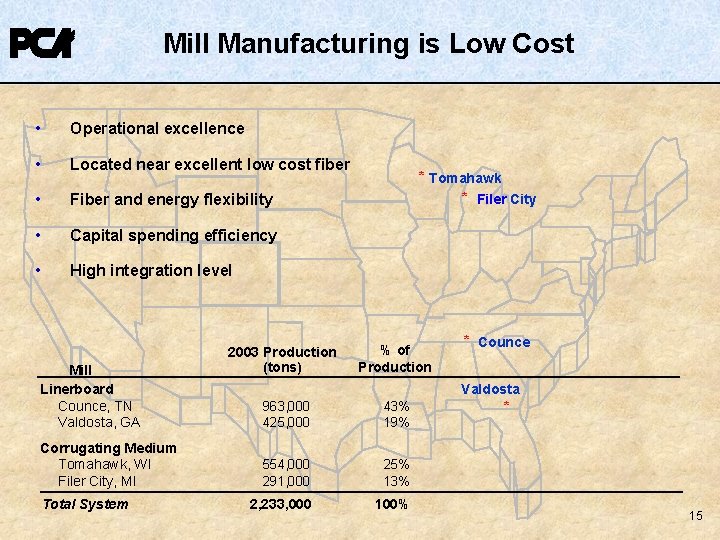
Mill Manufacturing is Low Cost • Operational excellence • Located near excellent low cost fiber • Fiber and energy flexibility • Capital spending efficiency • High integration level Mill Linerboard Counce, TN Valdosta, GA Corrugating Medium Tomahawk, WI Filer City, MI Total System 2003 Production (tons) * Tomahawk * Filer City % of Production * Counce Valdosta 963, 000 425, 000 43% 19% 554, 000 291, 000 25% 13% 2, 233, 000 100% * 15
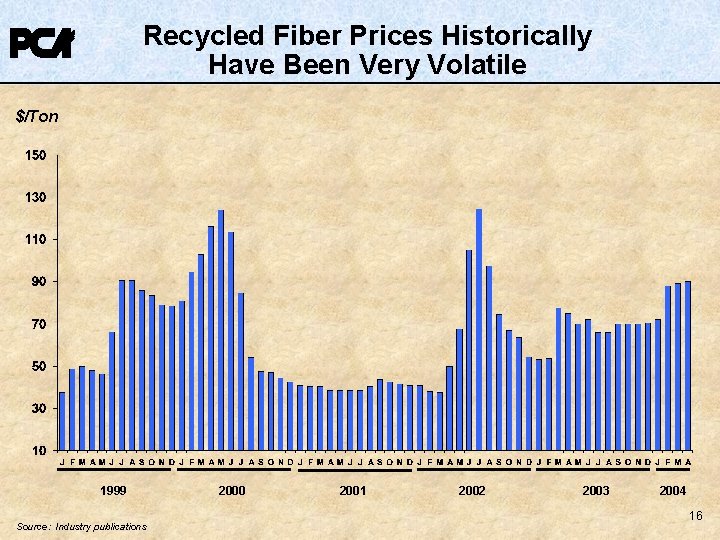
Recycled Fiber Prices Historically Have Been Very Volatile $/Ton 1999 Source: Industry publications 2000 2001 2002 2003 2004 16
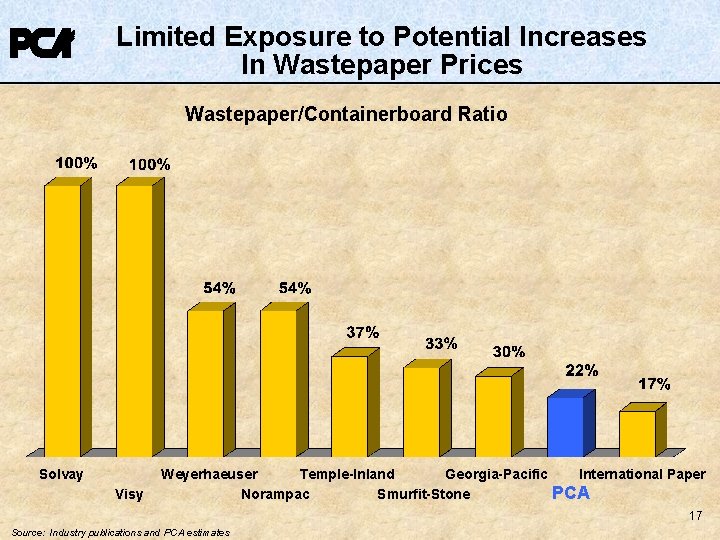
Limited Exposure to Potential Increases In Wastepaper Prices Wastepaper/Containerboard Ratio Solvay Visy Weyerhaeuser Temple-Inland Georgia-Pacific International Paper Norampac Smurfit-Stone PCA 17 Source: Industry publications and PCA estimates
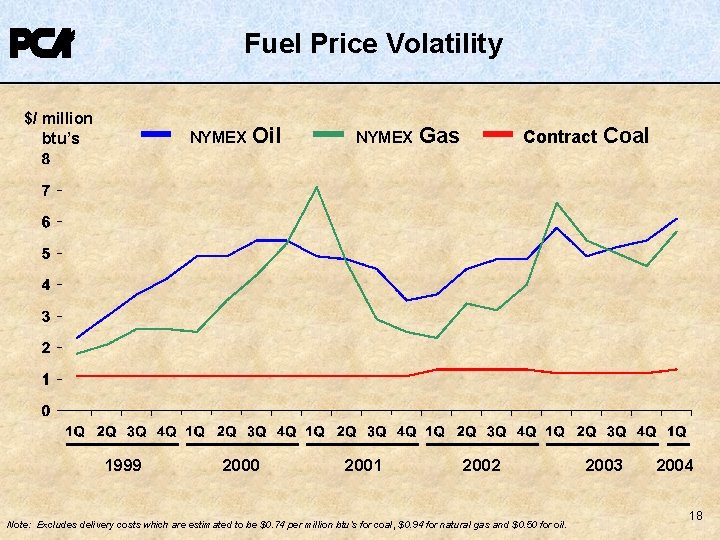
Fuel Price Volatility $/ million btu’s NYMEX 1999 Oil 2000 NYMEX 2001 Gas Contract 2002 Note: Excludes delivery costs which are estimated to be $0. 74 per million btu’s for coal, $0. 94 for natural gas and $0. 50 for oil. Coal 2003 2004 18
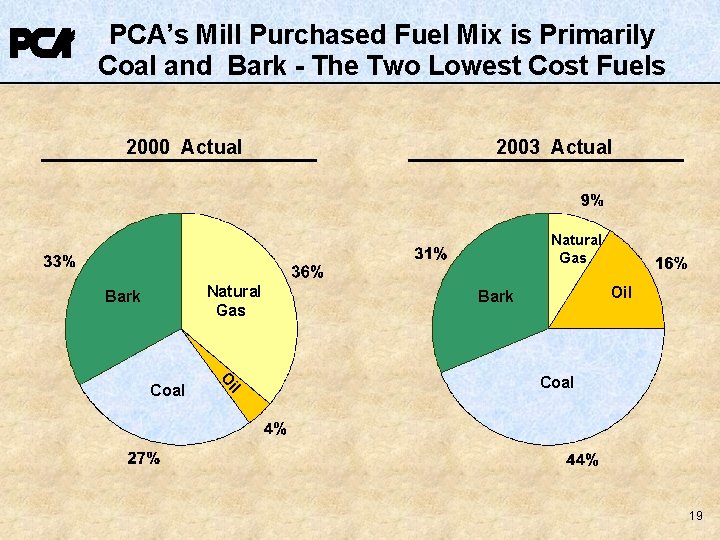
PCA’s Mill Purchased Fuel Mix is Primarily Coal and Bark - The Two Lowest Cost Fuels 2000 Actual 2003 Actual Natural Gas Bark il O Coal Oil Bark Coal 19
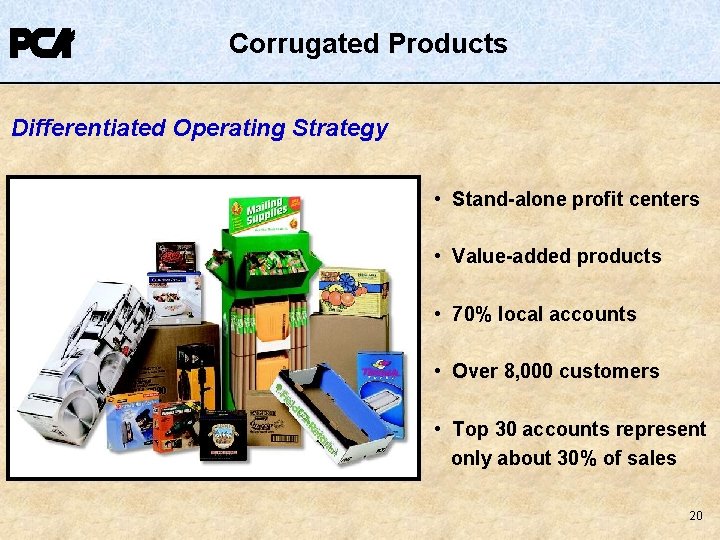
Corrugated Products Differentiated Operating Strategy • Stand-alone profit centers • Value-added products • 70% local accounts • Over 8, 000 customers • Top 30 accounts represent only about 30% of sales 20
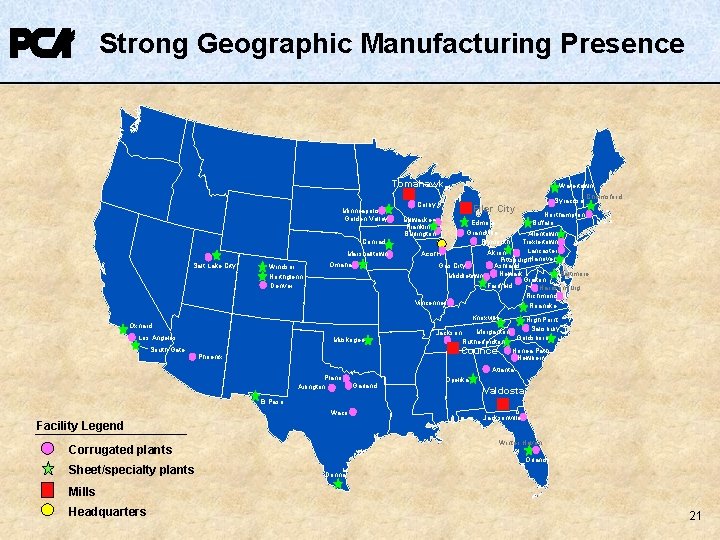
Strong Geographic Manufacturing Presence Tomahawk Minneapolis Golden Valley Conrad Salt Lake City Marshalltown Omaha Windsor Northglenn Denver Watertown Colby Syracuse Chelmsford Filer City Northampton Buffalo Allentown Trexlertown Lancaster Akron Acorn Pittsburgh. Hanover Gas City Ashland Newark Baltimore Middletown Grafton Fairfield Harrisonburg Richmond Vincennes Roanoke Milwaukee Franklin Burlington Edmore Grandville Plymouth Knoxville Oxnard Los Angeles South Gate Muskogee Phoenix High Point Salisbury Morganton Goldsboro Rutherfordton Counce Honea Path Newberry Jackson Atlanta Plano Arlington Garland Opelika Valdosta El Paso Waco Facility Legend Winter Haven Corrugated plants Sheet/specialty plants Jacksonville Orlando Donna Mills Headquarters 21
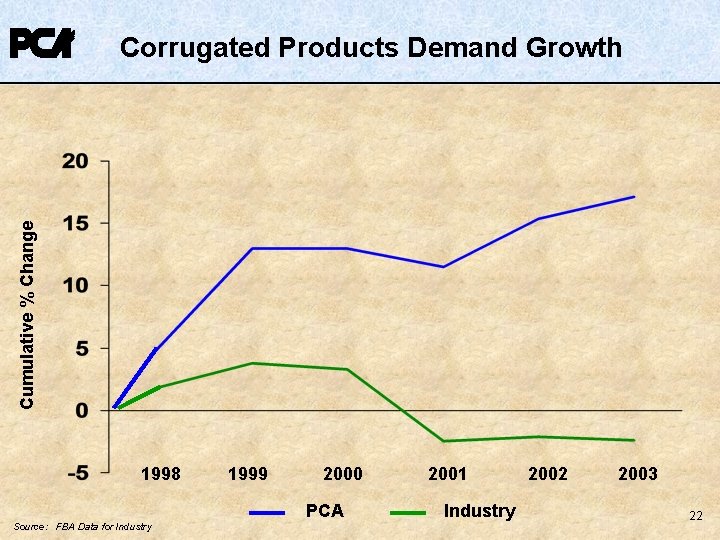
Cumulative % Change Corrugated Products Demand Growth 1998 Source: FBA Data for Industry 1999 2000 PCA 2001 Industry 2002 2003 22
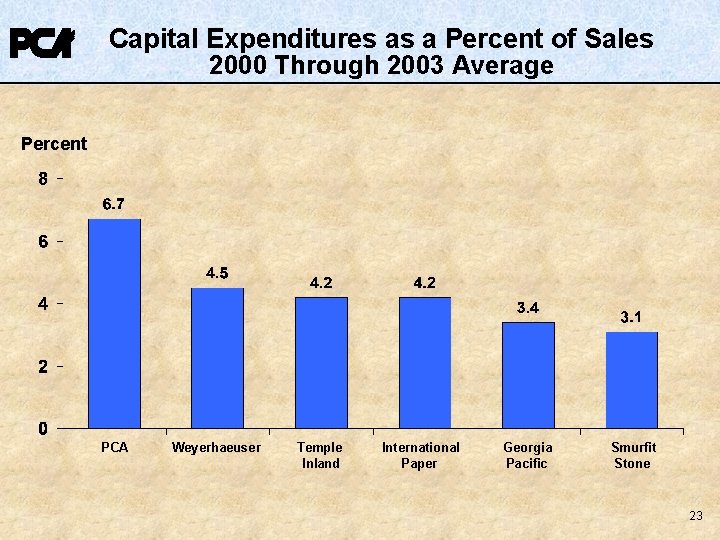
Capital Expenditures as a Percent of Sales 2000 Through 2003 Average Percent PCA Weyerhaeuser Temple Inland International Paper Georgia Pacific Smurfit Stone 23
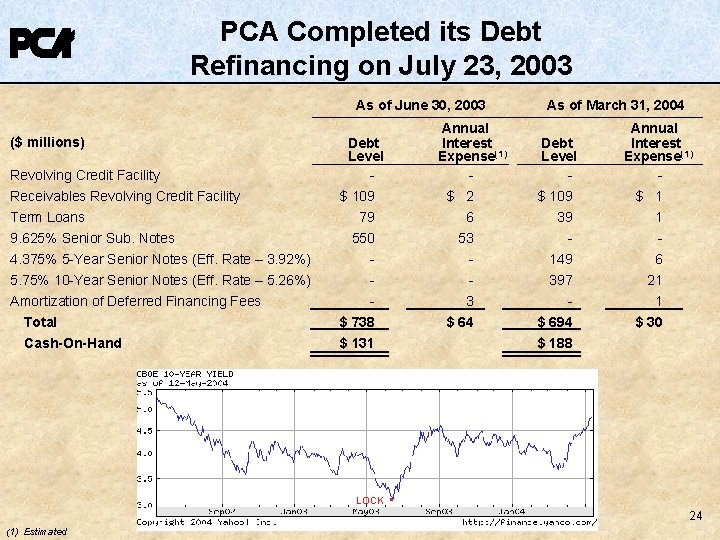
PCA Completed its Debt Refinancing on July 23, 2003 As of June 30, 2003 ($ millions) Revolving Credit Facility Receivables Revolving Credit Facility Term Loans Annual Interest Expense(1) - Debt Level - As of March 31, 2004 Debt Level - Annual Interest Expense(1) - $ 109 79 $ 2 6 $ 109 39 $ 1 1 550 - 53 3 149 397 - 6 21 1 Total $ 738 $ 64 $ 694 $ 30 Cash-On-Hand $ 131 9. 625% Senior Sub. Notes 4. 375% 5 -Year Senior Notes (Eff. Rate – 3. 92%) 5. 75% 10 -Year Senior Notes (Eff. Rate – 5. 26%) Amortization of Deferred Financing Fees LOCK $ 188 • 24 (1) Estimated
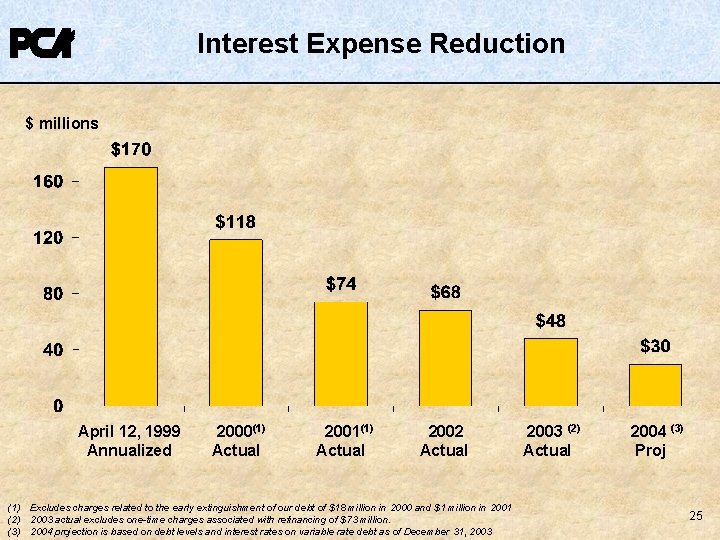
Interest Expense Reduction $ millions April 12, 1999 Annualized 2000(1) Actual 2001(1) Actual 2002 Actual (1) Excludes charges related to the early extinguishment of our debt of $18 million in 2000 and $1 million in 2001 (2) 2003 actual excludes one-time charges associated with refinancing of $73 million. (3) 2004 projection is based on debt levels and interest rates on variable rate debt as of December 31, 2003 (2) Actual 2004 (3) Proj 25
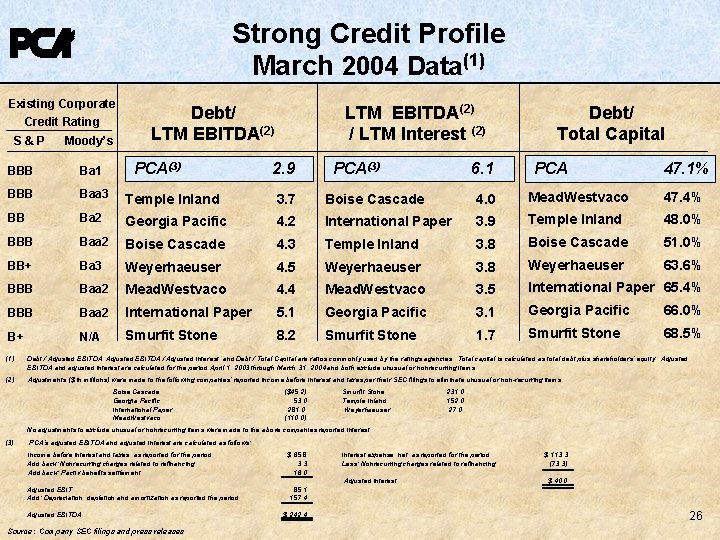
Strong Credit Profile March 2004 Data(1) Existing Corporate Credit Rating S&P Moody’s Debt/ LTM EBITDA(2) PCA(3) LTM EBITDA (2) / LTM Interest (2) 2. 9 PCA(3) 6. 1 Debt/ Total Capital PCA 47. 1% BBB Ba 1 BBB Baa 3 Temple Inland 3. 7 Boise Cascade 4. 0 Mead. Westvaco 47. 4% BB Ba 2 Georgia Pacific 4. 2 International Paper 3. 9 Temple Inland 48. 0% BBB Baa 2 Boise Cascade 4. 3 Temple Inland 3. 8 Boise Cascade 51. 0% BB+ Ba 3 Weyerhaeuser 4. 5 Weyerhaeuser 3. 8 Weyerhaeuser 63. 6% BBB Baa 2 Mead. Westvaco 4. 4 Mead. Westvaco 3. 5 International Paper 65. 4% BBB Baa 2 International Paper 5. 1 Georgia Pacific 3. 1 Georgia Pacific 66. 0% B+ N/A Smurfit Stone 8. 2 Smurfit Stone 1. 7 Smurfit Stone 68. 5% (1) Debt / Adjusted EBITDA, Adjusted EBITDA / Adjusted Interest, and Debt / Total Capital are ratios commonly used by the ratings agencies. Total capital is calculated as total debt plus shareholders’ equity. Adjusted EBITDA and adjusted interest are calculated for the period April 1, 2003 through March 31, 2004 and both exclude unusual or nonrecurring items. (2) Adjustments ($ in millions) were made to the following companies’ reported income before interest and taxes per their SEC filings to eliminate unusual or non-recurring items. Boise Cascade Georgia Pacific International Paper Mead. Westvaco ($45. 2) 53. 0 281. 0 (110. 0) Smurfit Stone Temple Inland Weyerhaeuser 231. 0 152. 0 27. 0 No adjustments to exclude unusual or nonrecurring items were made to the above companies reported interest. (3) PCA’s adjusted EBITDA and adjusted interest are calculated as follows: Income before interest and taxes, as reported for the period Add back: Nonrecurring charges related to refinancing Add back: Pactiv benefits settlement $ 65. 8 3. 3 16. 0 Adjusted EBIT Add: Depreciation, depletion and amortization as reported the period 85. 1 157. 4 Interest expense, net, as reported for the period Less: Nonrecurring charges related to refinancing Adjusted interest Adjusted EBITDA Source: Company SEC filings and press releases $ 242. 4 $ 113. 3 (73. 3) $ 40. 0 26
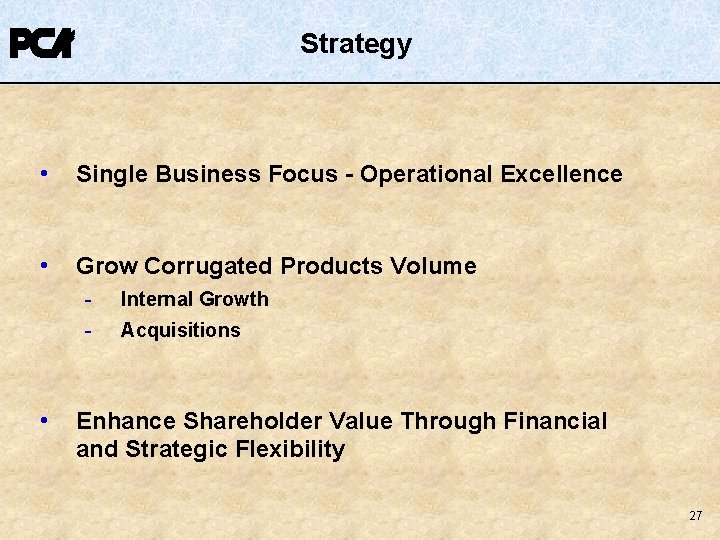
Strategy • Single Business Focus - Operational Excellence • Grow Corrugated Products Volume • - Internal Growth - Acquisitions Enhance Shareholder Value Through Financial and Strategic Flexibility 27
28