
Presentation to CIEBA Where Do We Go From
Presentation to CIEBA: Where Do We Go From Here? Michael A. Moran, CFA (212) 357 -3512 michael. moran@gs. com Goldman Sachs Asset Management July 15, 2014 THESE MATERIALS ARE PROVIDED SOLELY ON THE BASIS THAT THEY WILL NOT CONSTITUTE INVESTMENT ADVICE AND WILL NOT FORM A PRIMARY BASIS FOR ANY PERSON'S OR PLAN'S INVESTMENT DECISIONS, AND GOLDMAN SACHS IS NOT A FIDUCIARY WITH RESPECT TO ANY PERSON OR PLAN BY REASON OF PROVIDING THE MATERIAL OR CONTENT HEREIN. PLAN FIDUCIARIES SHOULD CONSIDER THEIR OWN CIRCUMSTANCES IN ASSESSING ANY POTENTIAL INVESTMENT COURSE OF ACTION. For CIEBA use only – not for further distribution. This material is provided for educational purposes only and should not be construed as investment advice or an offer or solicitation to buy or sell securities.
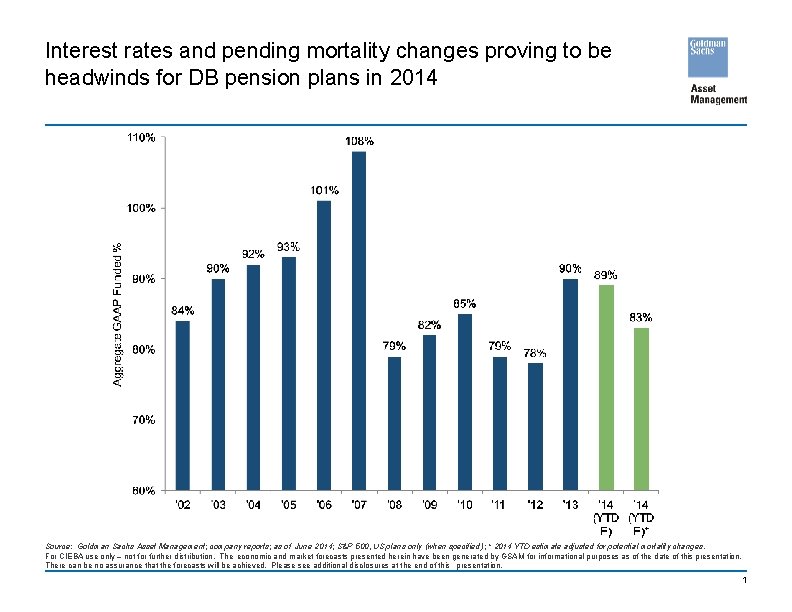
Interest rates and pending mortality changes proving to be headwinds for DB pension plans in 2014 Source: Goldman Sachs Asset Management; company reports; as of June 2014; S&P 500, US plans only (when specified ); * 2014 YTD estimate adjusted for potential mortality changes. For CIEBA use only – not for further distribution. The economic and market forecasts presented herein have been generated by GSAM for informational purposes as of the date of this presentation. There can be no assurance that the forecasts will be achieved. Please see additional disclosures at the end of this presentation. 1
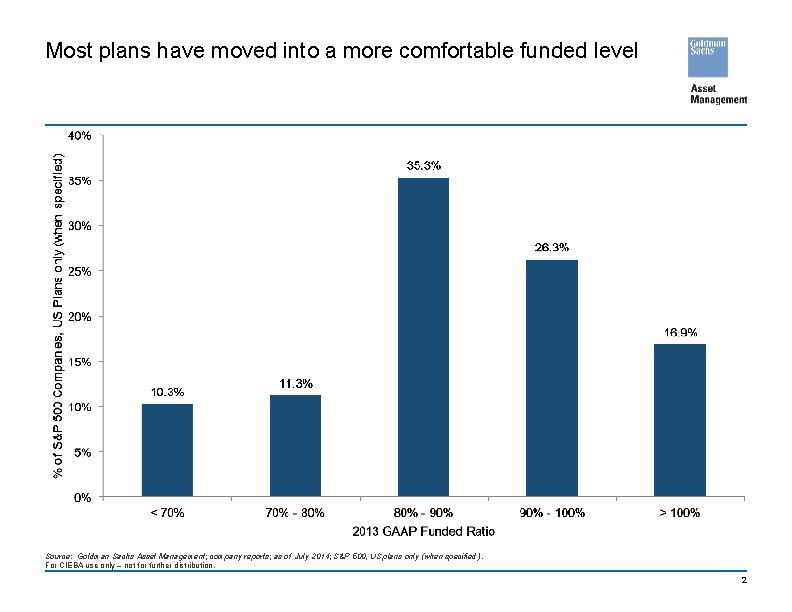
Most plans have moved into a more comfortable funded level Source: Goldman Sachs Asset Management; company reports; as of July 2014; S&P 500, US plans only (when specified ). For CIEBA use only – not for further distribution. 2
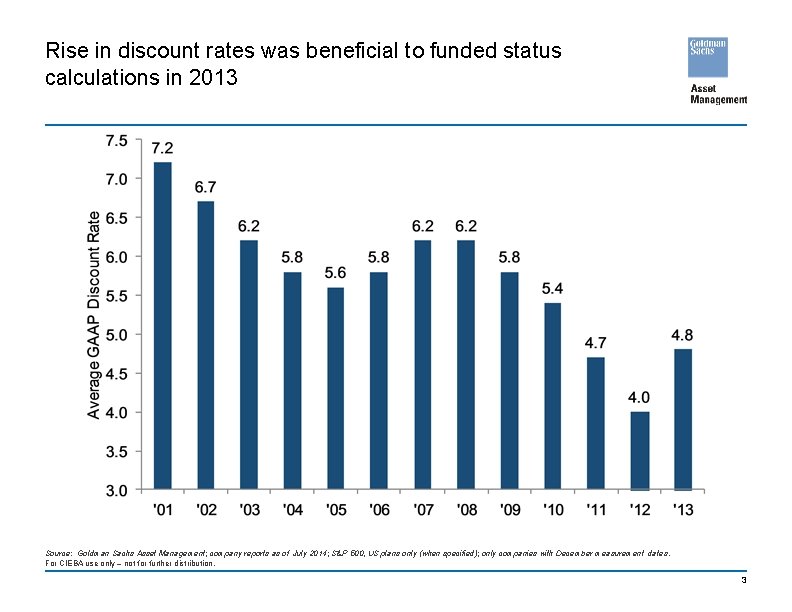
Rise in discount rates was beneficial to funded status calculations in 2013 Source: Goldman Sachs Asset Management; company reports as of July 2014; S&P 500, US plans only (when specified); only companies with December measurement dates. For CIEBA use only – not for further distribution. 3
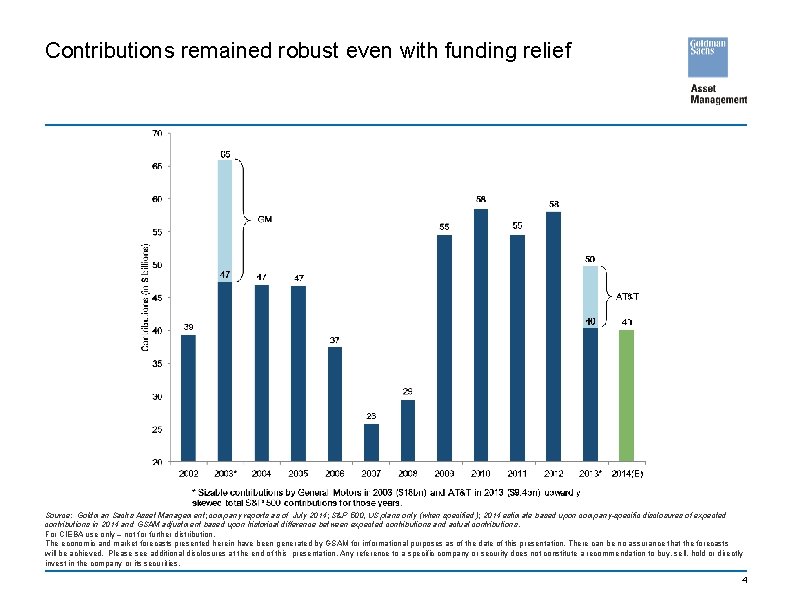
Contributions remained robust even with funding relief Source: Goldman Sachs Asset Management; company reports as of July 2014; S&P 500, US plans only (when specified ); 2014 estimate based upon company-specific disclosures of expected contributions in 2014 and GSAM adjustment based upon historical difference between expected contributions and actual contributions. For CIEBA use only – not for further distribution. The economic and market forecasts presented herein have been generated by GSAM for informational purposes as of the date of this presentation. There can be no assurance that the forecasts will be achieved. Please see additional disclosures at the end of this presentation. Any reference to a specific company or security does not constitute a recommendation to buy, sell, hold or directly invest in the company or its securities. 4
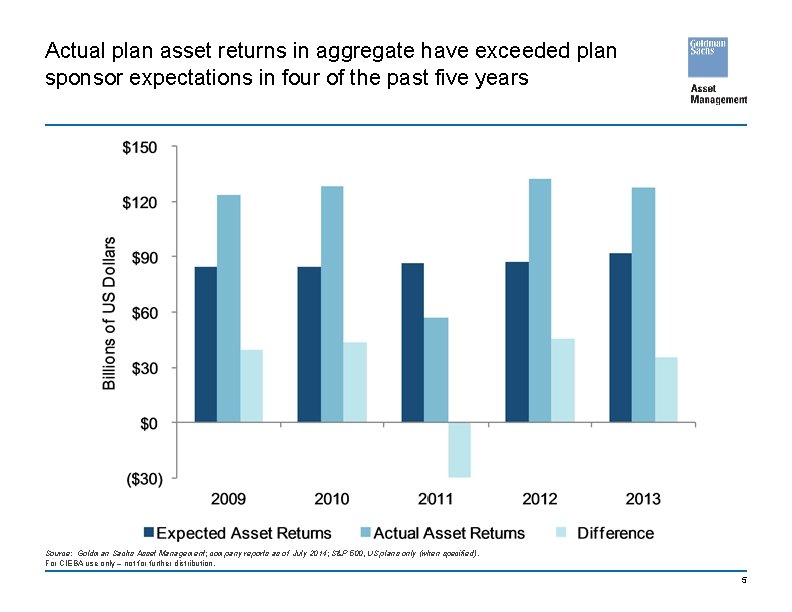
Actual plan asset returns in aggregate have exceeded plan sponsor expectations in four of the past five years Source: Goldman Sachs Asset Management; company reports as of July 2014; S&P 500, US plans only (when specified). For CIEBA use only – not for further distribution. 5
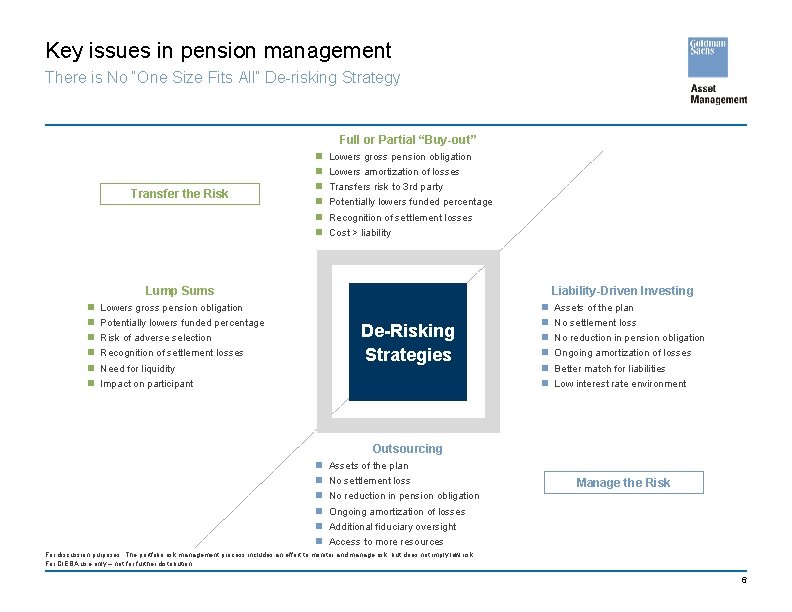
Key issues in pension management There is No “One Size Fits All” De-risking Strategy Full or Partial “Buy-out” Transfer the Risk n n n Lowers gross pension obligation Lowers amortization of losses Transfers risk to 3 rd party Potentially lowers funded percentage Recognition of settlement losses Cost > liability Lump Sums n n n Liability-Driven Investing Lowers gross pension obligation Potentially lowers funded percentage De-Risking Strategies Risk of adverse selection Recognition of settlement losses Need for liquidity Impact on participant n n n Assets of the plan No settlement loss No reduction in pension obligation Ongoing amortization of losses Better match for liabilities Low interest rate environment Outsourcing n n n Assets of the plan No settlement loss Manage the Risk No reduction in pension obligation Ongoing amortization of losses Additional fiduciary oversight Access to more resources For discussion purposes. The portfolio risk management process includes an effort to monitor and manage risk, but does not imply low risk. For CIEBA use only – not for further distribution. 6
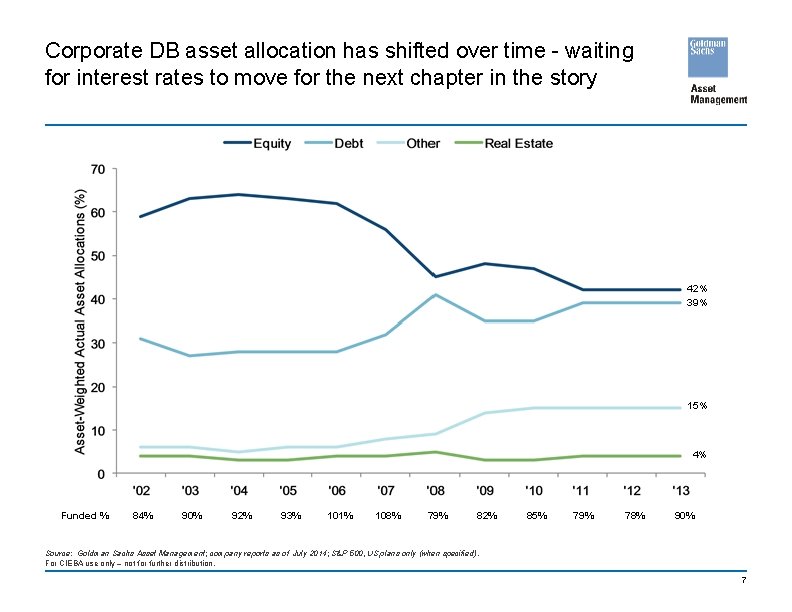
Corporate DB asset allocation has shifted over time - waiting for interest rates to move for the next chapter in the story 42% 39% 15% 4% Funded % 84% 90% 92% 93% 101% 108% 79% 82% 85% 79% 78% 90% Source: Goldman Sachs Asset Management; company reports as of July 2014; S&P 500, US plans only (when specified). For CIEBA use only – not for further distribution. 7
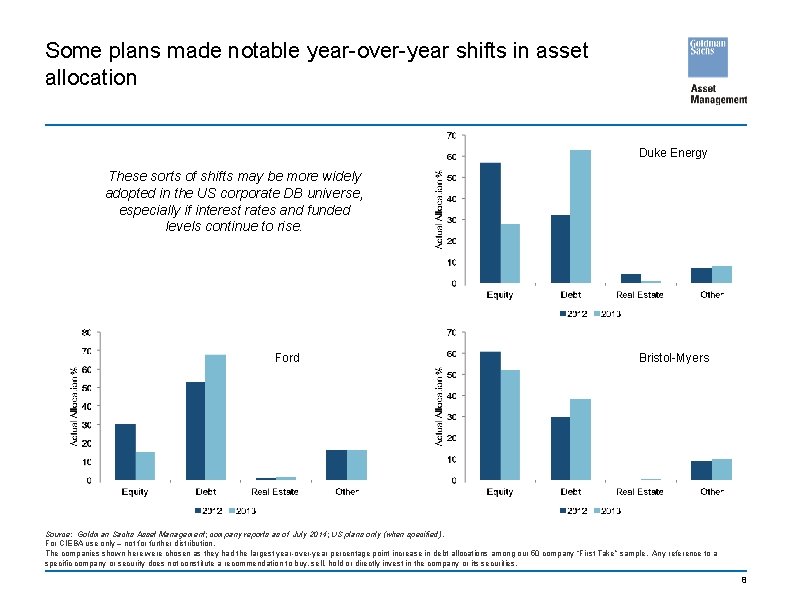
Some plans made notable year-over-year shifts in asset allocation Duke Energy These sorts of shifts may be more widely adopted in the US corporate DB universe, especially if interest rates and funded levels continue to rise. Ford Bristol-Myers Source: Goldman Sachs Asset Management; company reports as of July 2014; US plans only (when specified). For CIEBA use only – not for further distribution. The companies shown here were chosen as they had the largest year-over-year percentage point increase in debt allocations among our 50 company “First Take” sample. Any reference to a specific company or security does not constitute a recommendation to buy, sell, hold or directly invest in the company or its securities. 8
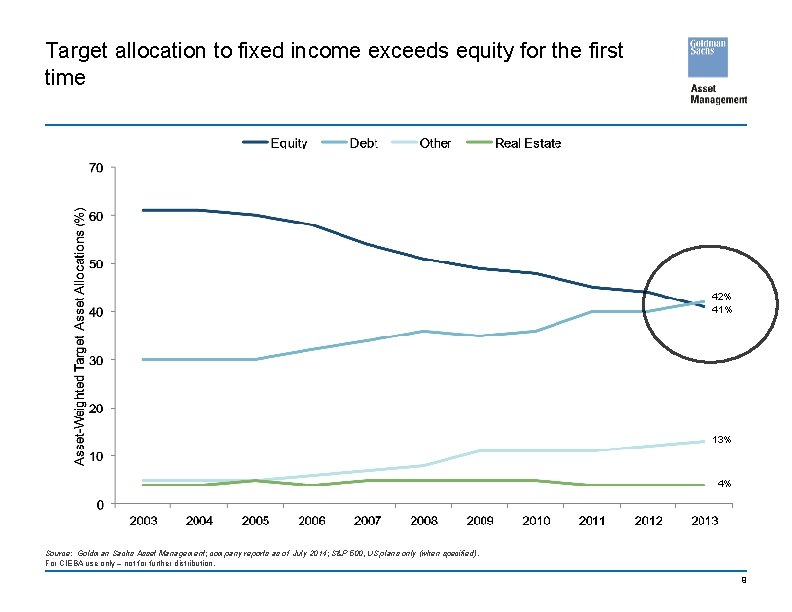
Target allocation to fixed income exceeds equity for the first time 42% 41% 13% 4% Source: Goldman Sachs Asset Management; company reports as of July 2014; S&P 500, US plans only (when specified). For CIEBA use only – not for further distribution. 9
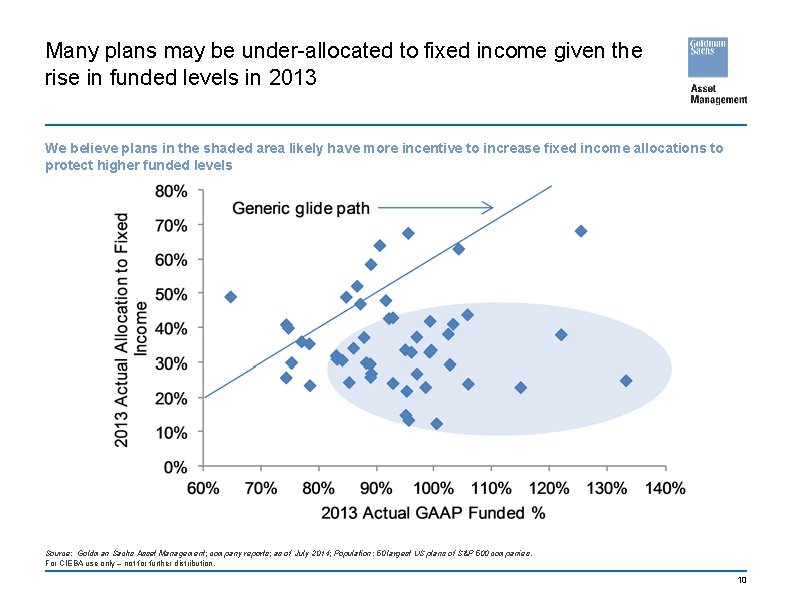
Many plans may be under-allocated to fixed income given the rise in funded levels in 2013 We believe plans in the shaded area likely have more incentive to increase fixed income allocations to protect higher funded levels Source: Goldman Sachs Asset Management; company reports; as of July 2014; Population: 50 largest US plans of S&P 500 companies. For CIEBA use only – not for further distribution. 10
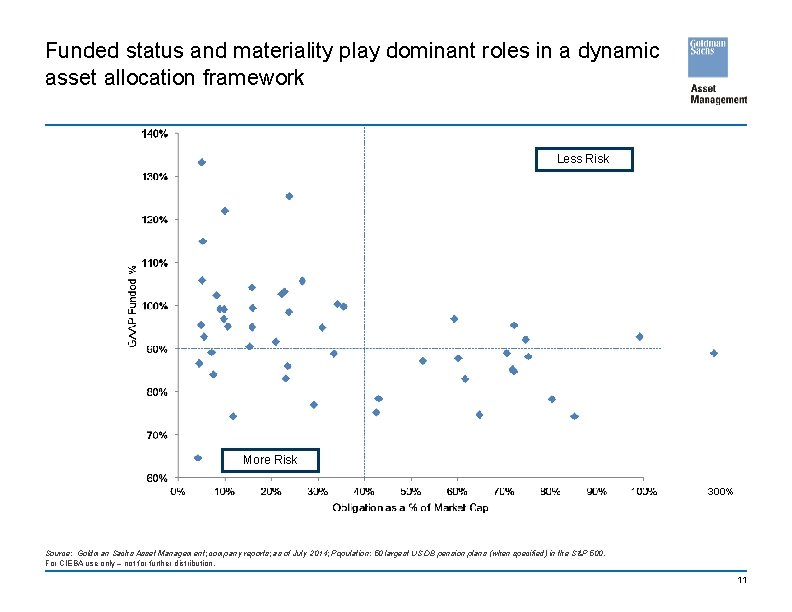
Funded status and materiality play dominant roles in a dynamic asset allocation framework Less Risk Low Potential to take more or less risk based on other factors in the framework May be inclined to take more risk Low More Risk May be inclined to take less risk Potential to take more or less risk based on other factors in the framework High 300% Source: Goldman Sachs Asset Management; company reports; as of July 2014; Population: 50 largest US DB pension plans (when specified) in the S&P 500. For CIEBA use only – not for further distribution. 11
Potentially significant demand for long duration fixed income by corporate DB plans over the next few years � Currently about $2. 9 trillion of assets in the US corporate DB universe � At the end of 2013 approximately 39% of these assets were invested in fixed income – That percentage has increased by over 1, 000 bps since 2006 � Potential demand from corporate DB plans – A similar 1, 000 bps increase in fixed income allocations over the next few years would equate to about $290 billion of demand for high quality long duration fixed income � Not all of the existing allocation to fixed income is in long duration – Reallocating 1, 000 bps of the existing allocation to long duration could add another roughly $290 bn of demand � New allocations and extension of duration of existing holdings could result in about $550 - $600 billion of demand for high quality, long duration fixed income from the corporate DB universe over the next few years Source: Goldman Sachs Asset Management; Federal Reserve Board; as of July 2014. For CIEBA use only – not for further distribution. 12
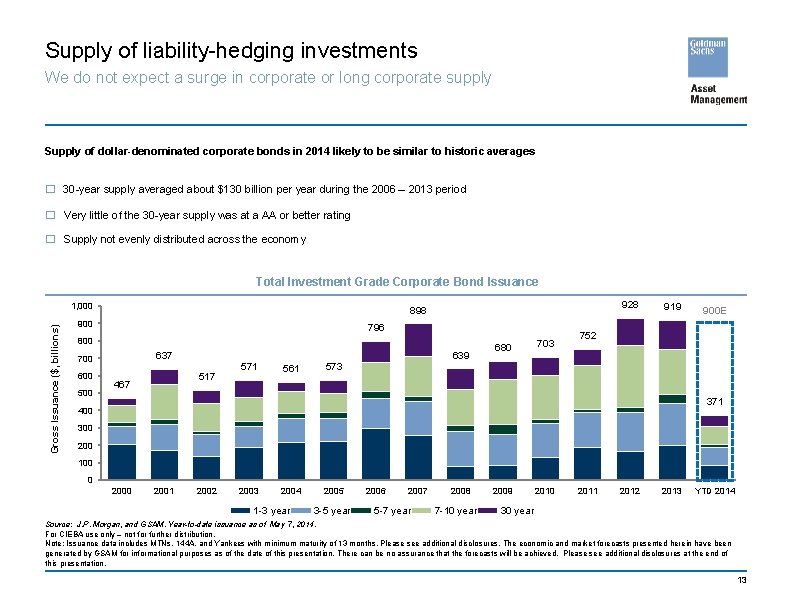
Supply of liability-hedging investments We do not expect a surge in corporate or long corporate supply Supply of dollar-denominated corporate bonds in 2014 likely to be similar to historic averages � 30 -year supply averaged about $130 billion per year during the 2006 – 2013 period � Very little of the 30 -year supply was at a AA or better rating � Supply not evenly distributed across the economy Total Investment Grade Corporate Bond Issuance Gross Issuance ($, billions) 1, 000 928 898 900 796 800 600 500 639 637 700 517 467 571 561 680 703 919 900 E 752 573 371 400 300 200 100 0 2001 2002 2003 2004 1 -3 year 2005 3 -5 year 2006 2007 5 -7 year 2008 7 -10 year 2009 2010 2011 2012 2013 YTD 2014 30 year Source: J. P. Morgan, and GSAM. Year-to-date issuance as of May 7, 2014. For CIEBA use only – not for further distribution. Note: Issuance data includes MTNs, 144 A, and Yankees with minimum maturity of 13 months. Please see additional disclosures. The economic and market forecasts presented herein have been generated by GSAM for informational purposes as of the date of this presentation. There can be no assurance that the forecasts will be achieved. Please see additional disclosures at the end of this presentation. 13
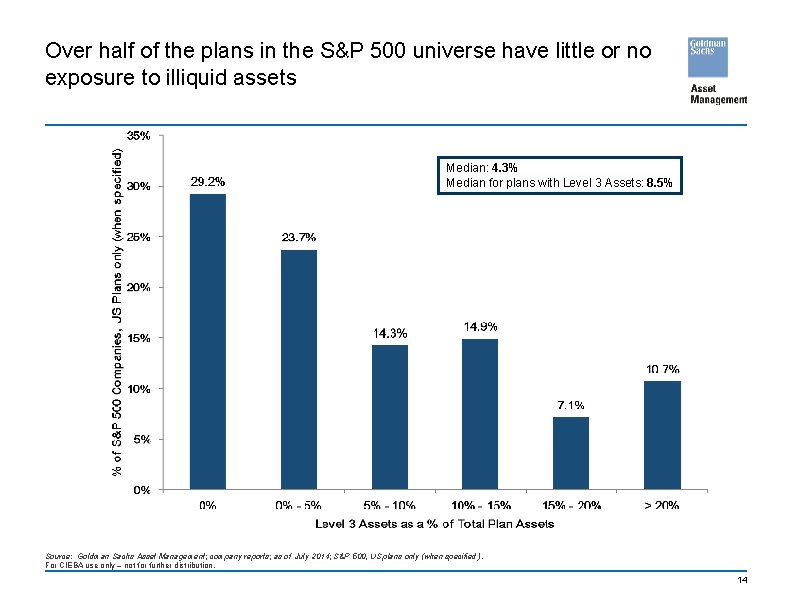
Over half of the plans in the S&P 500 universe have little or no exposure to illiquid assets Median: 4. 3% Median for plans with Level 3 Assets: 8. 5% Source: Goldman Sachs Asset Management; company reports; as of July 2014; S&P 500, US plans only (when specified ). For CIEBA use only – not for further distribution. 14
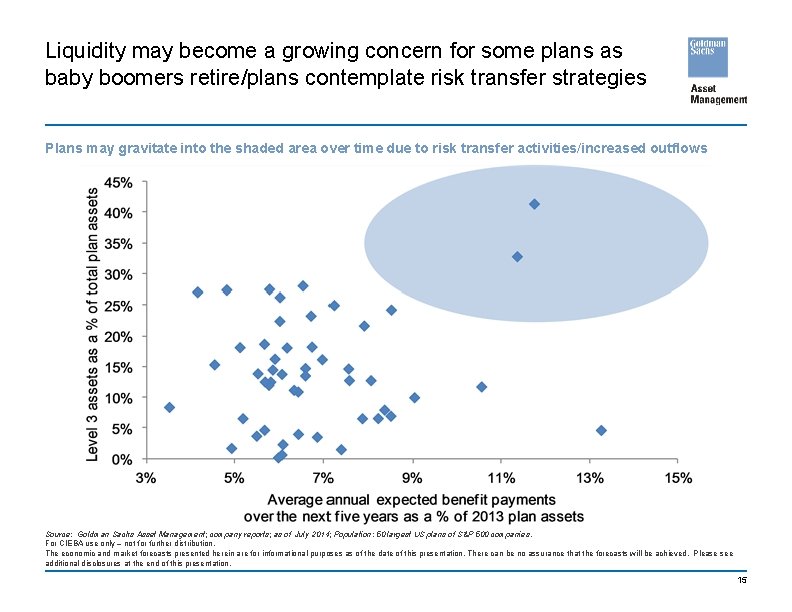
Liquidity may become a growing concern for some plans as baby boomers retire/plans contemplate risk transfer strategies Plans may gravitate into the shaded area over time due to risk transfer activities/increased outflows Source: Goldman Sachs Asset Management; company reports; as of July 2014; Population: 50 largest US plans of S&P 500 companies. For CIEBA use only – not for further distribution. The economic and market forecasts presented herein are for informational purposes as of the date of this presentation. There can be no assurance that the forecasts will be achieved. Please see additional disclosures at the end of this presentation. 15
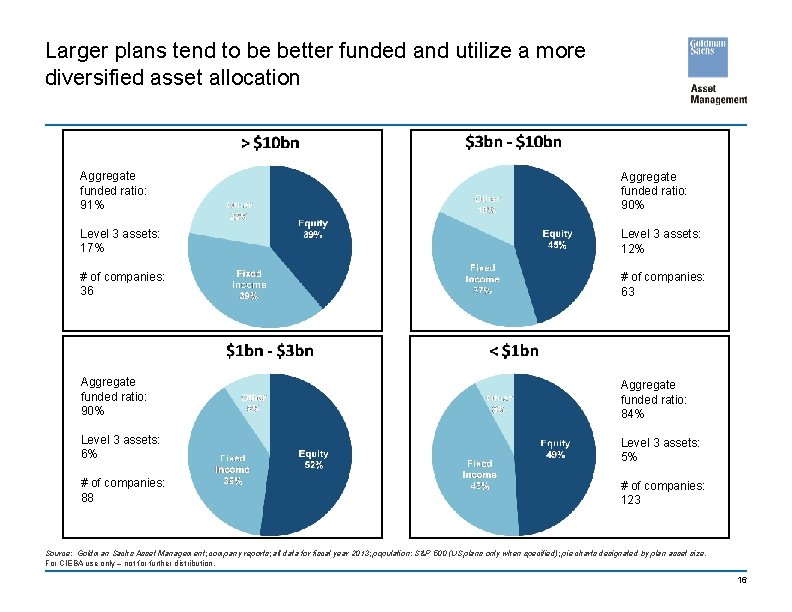
Larger plans tend to be better funded and utilize a more diversified asset allocation Aggregate funded ratio: 91% Aggregate funded ratio: 90% Level 3 assets: 17% Level 3 assets: 12% # of companies: 36 # of companies: 63 Aggregate funded ratio: 90% Aggregate funded ratio: 84% Level 3 assets: 6% Level 3 assets: 5% # of companies: 88 # of companies: 123 Source: Goldman Sachs Asset Management; company reports; all data for fiscal year 2013; population: S&P 500 (US plans only when specified); pie charts designated by plan asset size. For CIEBA use only – not for further distribution. 16
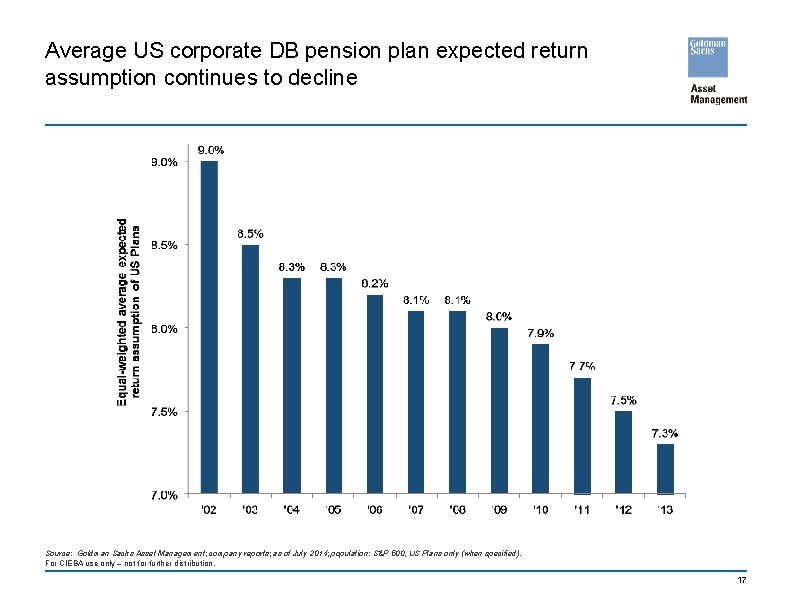
Average US corporate DB pension plan expected return assumption continues to decline Source: Goldman Sachs Asset Management; company reports; as of July 2014; population: S&P 500, US Plans only (when specified). For CIEBA use only – not for further distribution. 17
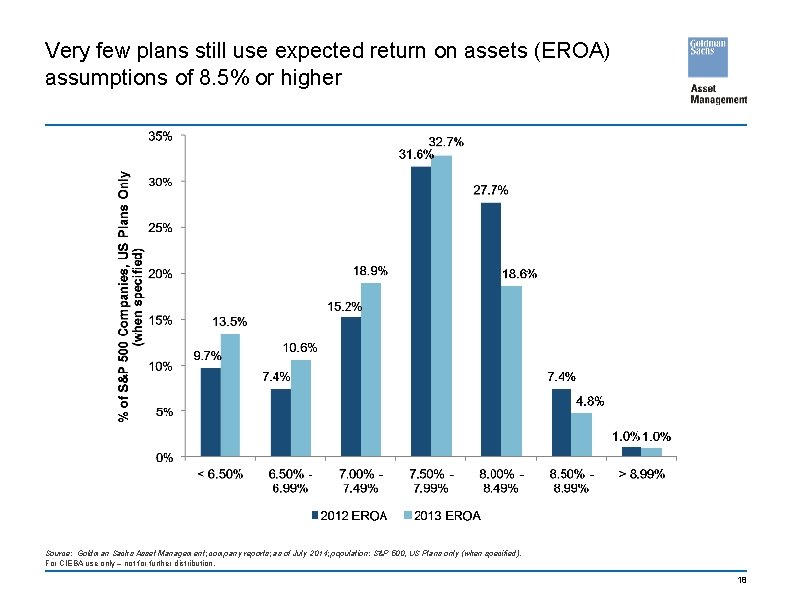
Very few plans still use expected return on assets (EROA) assumptions of 8. 5% or higher Source: Goldman Sachs Asset Management; company reports; as of July 2014; population: S&P 500, US Plans only (when specified). For CIEBA use only – not for further distribution. 18
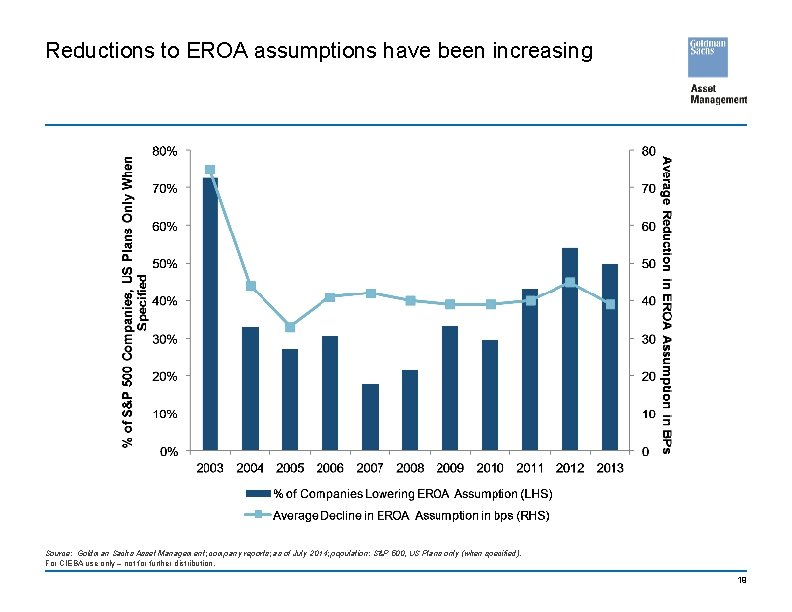
Reductions to EROA assumptions have been increasing Source: Goldman Sachs Asset Management; company reports; as of July 2014; population: S&P 500, US Plans only (when specified). For CIEBA use only – not for further distribution. 19
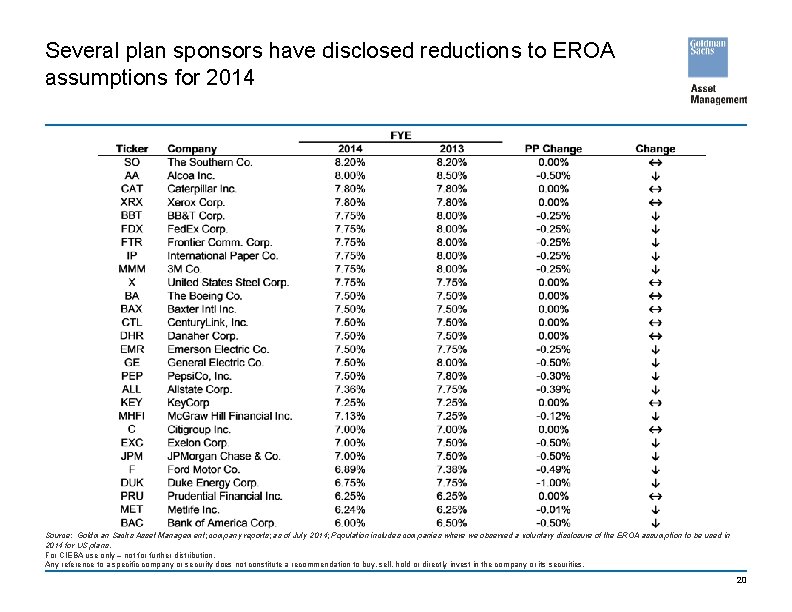
Several plan sponsors have disclosed reductions to EROA assumptions for 2014 Source: Goldman Sachs Asset Management; company reports; as of July 2014; Population includes companies where we observed a voluntary disclosure of the EROA assumption to be used in 2014 for US plans. For CIEBA use only – not for further distribution. Any reference to a specific company or security does not constitute a recommendation to buy, sell, hold or directly invest in the company or its securities. 20

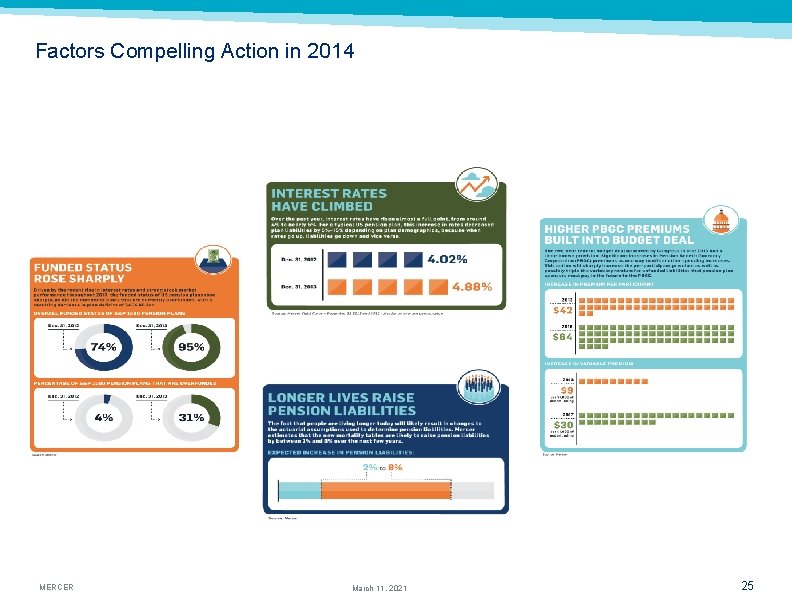
Regulatory/Financial reporting themes to watch � Revised mortality tables may increase some plan liabilities by 5% - 10% – Controversial proposal with concerns around the quantity and quality of data used in the analysis � Pension Benefit Guaranty Corporation flat and variable rate premiums moving substantially higher over the next few years – Could provide incentive for some plans to take de-risking actions to reduce their liabilities � Various constituents in Washington (and elsewhere) evaluating whether de-risking actions such as lump sum payments and annuitization are appropriate from a policy perspective – May not result in the elimination of these actions, but regulatory or disclosure hurdles could be raised � Pension smoothing/funding relief included as part of Highway Trust Fund package – Potential new funding relief just as the relief from MAP-21 starts to diminish � More voluntary adoptions of mark to market accounting likely to occur – Could be an opportune time if interest rates have seen their lowest levels Source: Goldman Sachs Asset Management; as of July 2014. For CIEBA use only – not for further distribution. Goldman Sachs does not provide accounting, tax or legal advice. Please see additional disclosures at the end of this presentation The economic and market forecasts presented herein are for informational purposes as of the date of this presentation. There can be no assurance that the forecasts will be achieved. Please see additional disclosures at the end of this presentation. 21
Disclosures THESE MATERIALS ARE PROVIDED SOLELY ON THE BASIS THAT THEY WILL NOT CONSTITUTE INVESTMENT ADVICE AND WILL NOT FORM A PRIMARY BASIS FOR ANY PERSON'S OR PLAN'S INVESTMENT DECISIONS, AND GOLDMAN SACHS IS NOT A FIDUCIARY WITH RESPECT TO ANY PERSON OR PLAN BY REASON OF PROVIDING THE MATERIAL OR CONTENT HEREIN. PLAN FIDUCIARIES SHOULD CONSIDER THEIR OWN CIRCUMSTANCES IN ASSESSING ANY POTENTIAL INVESTMENT COURSE OF ACTION. This material is provided for educational purposes only and should not be construed as investment advice or an offer or solicitation to buy or sell securities. This material is provided at your request solely for your use. THIS MATERIAL DOES NOT CONSTITUTE AN OFFER OR SOLICITATION IN ANY JURISDICTION WHERE OR TO ANY PERSON TO WHOM IT WOULD BE UNAUTHORIZED OR UNLAWFUL TO DO SO. Views and opinions expressed are for informational purposes only and do not constitute a recommendation by GSAM to buy, sell, or hold any security. Views and opinions are current as of the date of this presentation and may be subject to change, they should not be construed as investment advice. Although certain information has been obtained from sources believed to be reliable, we do not guarantee its accuracy, completeness or fairness. We have relied upon and assumed without independent verification, the accuracy and completeness of all information available from public sources. Past performance does not guarantee future results, which may vary. The value of investments and the income derived from investments will fluctuate and can go down as well as up. A loss of principal may occur. Economic and market forecasts presented herein reflect a series of assumptions and judgments as of the date of this presentation and are subject to change without notice. These forecasts do not take into account the specific investment objectives, restrictions, tax and financial situation or other needs of any specific client. Actual data will vary and may not be reflected here. These forecasts are subject to high levels of uncertainty that may affect actual performance. Accordingly, these forecasts should be viewed as merely representative of a broad range of possible outcomes. These forecasts are estimated, based on assumptions, and are subject to significant revision and may change materially as economic and market conditions change. Goldman Sachs has no obligation to provide updates or changes to these forecasts. Case studies and examples are for illustrative purposes only. Any reference to a specific company or security does not constitute a recommendation to buy, sell, hold or directly invest in the company or its securities. It should not be assumed that investment decisions made in the future will be profitable or will equal the performance of the securities discussed in this document. Confidentiality No part of this material may, without GSAM’s prior written consent, be (i) copied, photocopied or duplicated in any form, by any means, or (ii) distributed to any person that is not an employee, officer, director, or authorized agent of the recipient. Expected return models apply statistical methods and a series of fixed assumptions to derive estimates of hypothetical average asset class performance. Reasonable people may disagree about the appropriate statistical model and assumptions. These models have limitations, as the assumptions may not be consensus views, or the model may not be updated to reflect current economic or market conditions. These models should not be relied upon to make predictions of actual future account performance. GSAM has no obligation to provide updates or changes to such data. 22
Disclosures Goldman Sachs does not provide accounting, tax, or legal advice. Notwithstanding anything in this document to the contrary, and except as required to enable compliance with applicable securities law, you may disclose to any person the US federal and state income tax treatment and tax structure of the transaction and all materials of any kind (including tax opinions and other tax analyses) that are provided to you relating to such tax treatment and tax structure, without Goldman Sachs imposing any limitation of any kind. Investors should be aware that a determination of the tax consequences to them should take into account their specific circumstances and that the tax law is subject to change in the future or retroactively and investors are strongly urged to consult with their own tax advisor regarding any potential strategy, investment or transaction. © 2014 Goldman Sachs. All rights reserved. Compliance code: 133439. STR. TMPL/7/2014. Date of first use: July 15, 2014. 23
INNOVATIONS IN PENSION RISK TRANSFER JULY 8, 2014 Sean Brennan New York
Factors Compelling Action in 2014 MERCER March 11, 2021 25
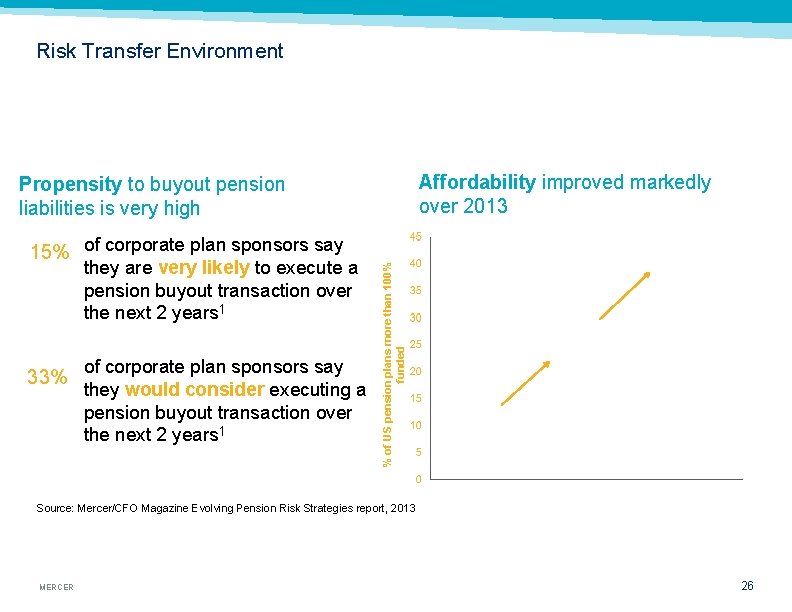
Risk Transfer Environment Affordability improved markedly over 2013 15% of corporate plan sponsors say they are very likely to execute a pension buyout transaction over the next 2 years 1 33% of corporate plan sponsors say they would consider executing a pension buyout transaction over the next 2 years 1 % of US pension plans more than 100% funded Propensity to buyout pension liabilities is very high Source: Mercer/CFO Magazine Evolving Pension Risk Strategies report, 2013 MERCER 26
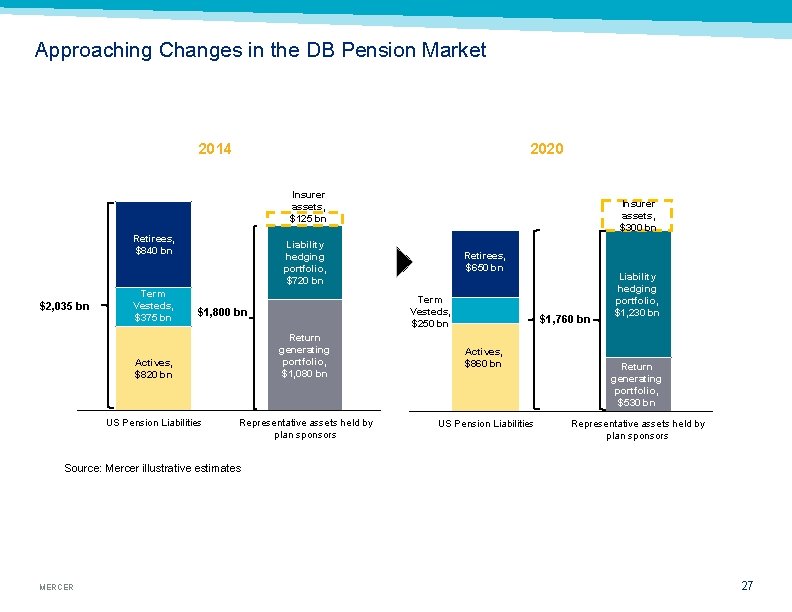
Approaching Changes in the DB Pension Market 2014 2020 Insurer assets, $125 bn Retirees, $840 bn $2, 035 bn Term Vesteds, $375 bn Insurer assets, $300 bn Liability hedging portfolio, $720 bn Term Vesteds, $250 bn $1, 800 bn $1, 760 bn Return generating portfolio, $1, 080 bn Actives, $860 bn Representative assets held by plan sponsors US Pension Liabilities Actives, $820 bn US Pension Liabilities Retirees, $650 bn Liability hedging portfolio, $1, 230 bn Return generating portfolio, $530 bn Representative assets held by plan sponsors Source: Mercer illustrative estimates MERCER 27
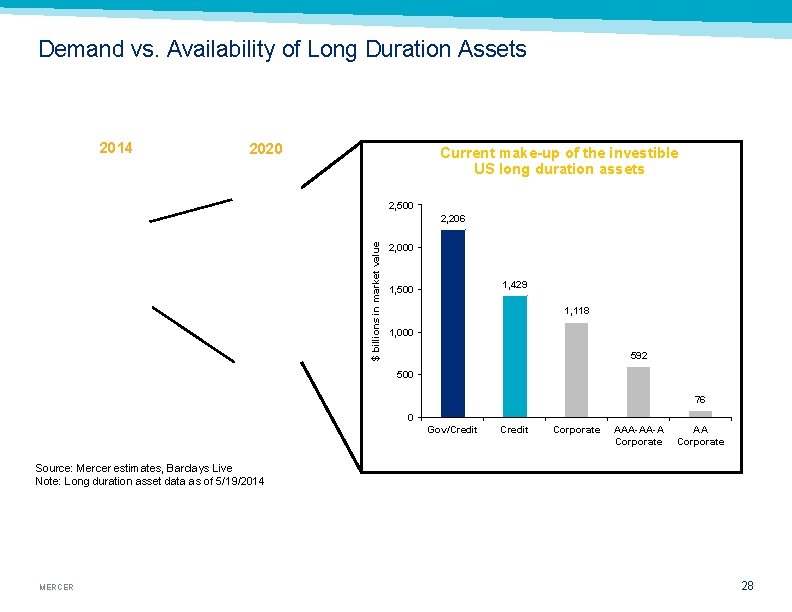
Demand vs. Availability of Long Duration Assets 2014 2020 Current make-up of the investible US long duration assets 2, 500 $ billions in market value 2, 206 2, 000 1, 429 1, 500 1, 118 1, 000 592 500 76 0 Gov/Credit Corporate AAA-AA-A Corporate AA Corporate Source: Mercer estimates, Barclays Live Note: Long duration asset data as of 5/19/2014 MERCER 28
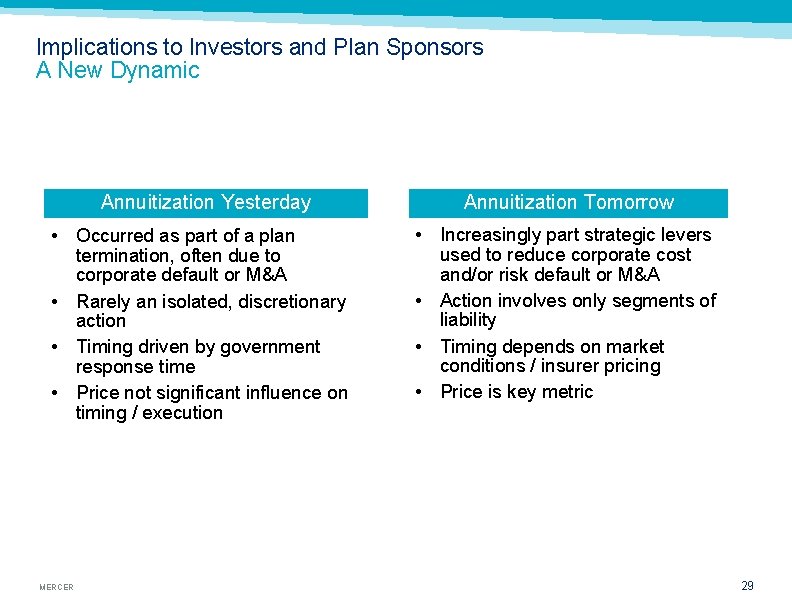
Implications to Investors and Plan Sponsors A New Dynamic Annuitization Yesterday Annuitization Tomorrow • Occurred as part of a plan termination, often due to corporate default or M&A • Rarely an isolated, discretionary action • Timing driven by government response time • Price not significant influence on timing / execution • Increasingly part strategic levers used to reduce corporate cost and/or risk default or M&A • Action involves only segments of liability • Timing depends on market conditions / insurer pricing • Price is key metric MERCER 29
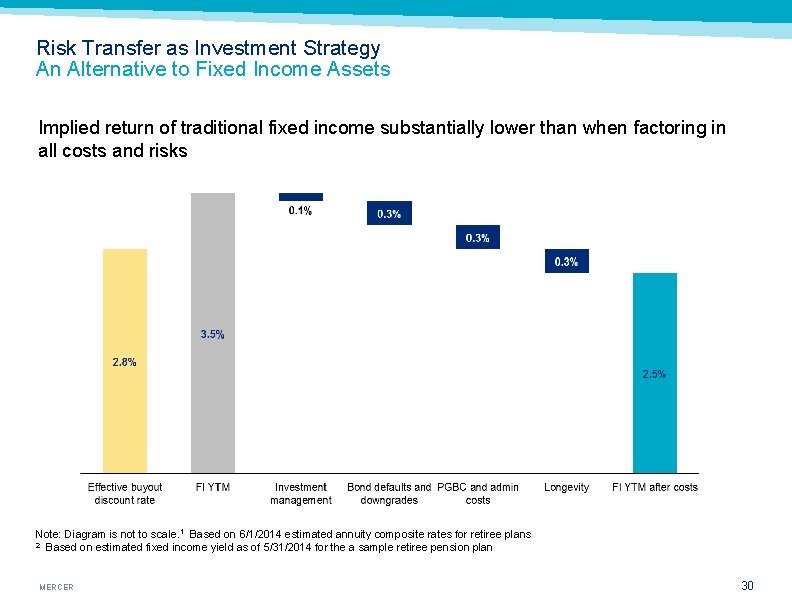
Risk Transfer as Investment Strategy An Alternative to Fixed Income Assets Implied return of traditional fixed income substantially lower than when factoring in all costs and risks Note: Diagram is not to scale. 1 Based on 6/1/2014 estimated annuity composite rates for retiree plans 2 Based on estimated fixed income yield as of 5/31/2014 for the a sample retiree pension plan MERCER 30
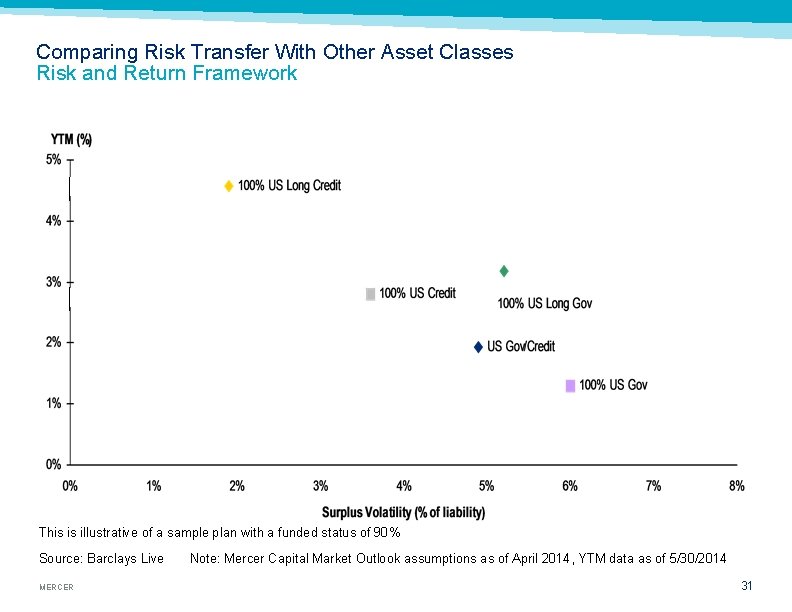
Comparing Risk Transfer With Other Asset Classes Risk and Return Framework This is illustrative of a sample plan with a funded status of 90% Source: Barclays Live Note: Mercer Capital Market Outlook assumptions as of April 2014, YTM data as of 5/30/2014 MERCER 31
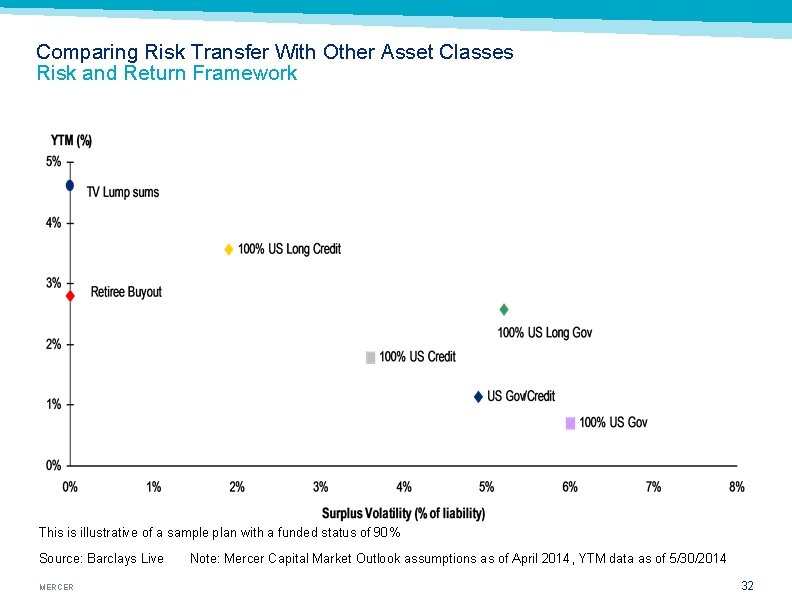
Comparing Risk Transfer With Other Asset Classes Risk and Return Framework This is illustrative of a sample plan with a funded status of 90% Source: Barclays Live Note: Mercer Capital Market Outlook assumptions as of April 2014, YTM data as of 5/30/2014 MERCER 32
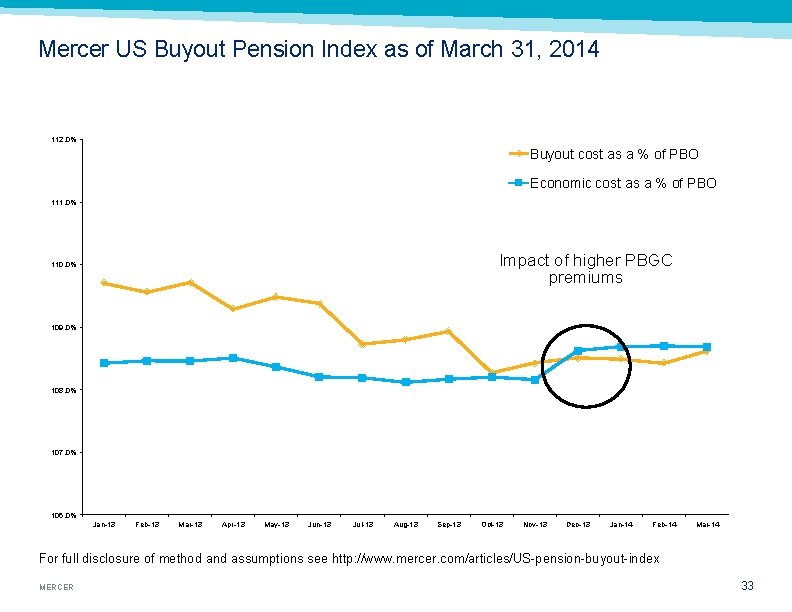
Mercer US Buyout Pension Index as of March 31, 2014 112. 0% Buyout cost as a % of PBO Economic cost as a % of PBO 111. 0% Impact of higher PBGC premiums 110. 0% 109. 0% 108. 0% 107. 0% 106. 0% Jan-13 Feb-13 Mar-13 Apr-13 May-13 Jun-13 Jul-13 Aug-13 Sep-13 Oct-13 Nov-13 Dec-13 Jan-14 Feb-14 Mar-14 For full disclosure of method and assumptions see http: //www. mercer. com/articles/US-pension-buyout-index MERCER 33
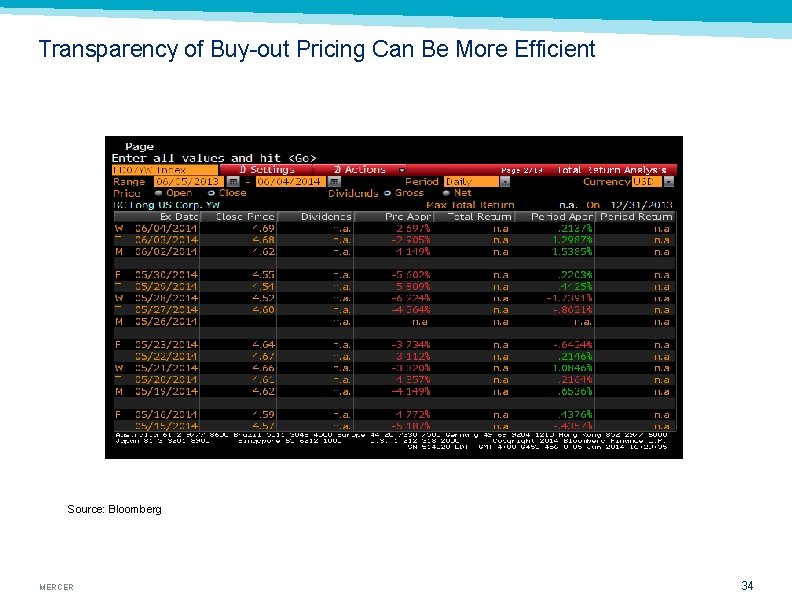
Transparency of Buy-out Pricing Can Be More Efficient Source: Bloomberg MERCER 34
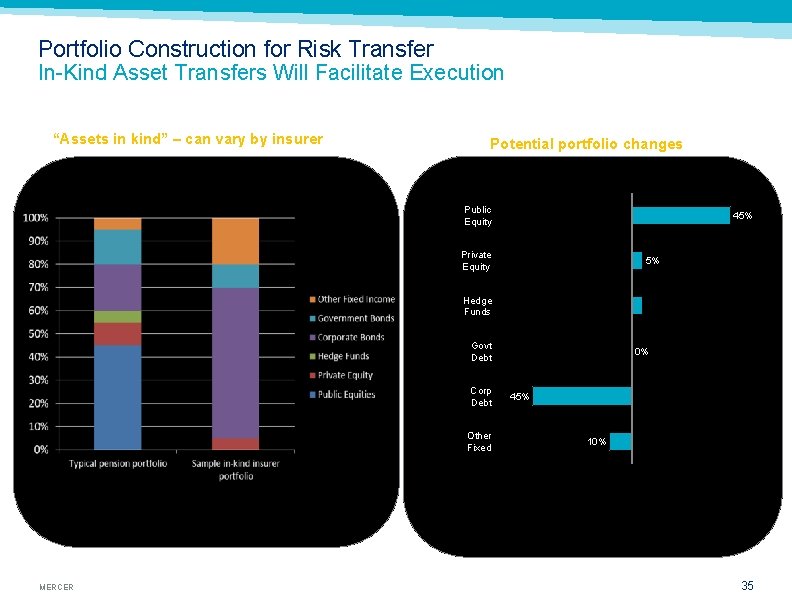
Portfolio Construction for Risk Transfer In-Kind Asset Transfers Will Facilitate Execution “Assets in kind” – can vary by insurer Potential portfolio changes Public Equity 45% Private Equity 5% Hedge Funds Govt Debt Corp Debt Other Fixed MERCER 0% 45% 10% 35
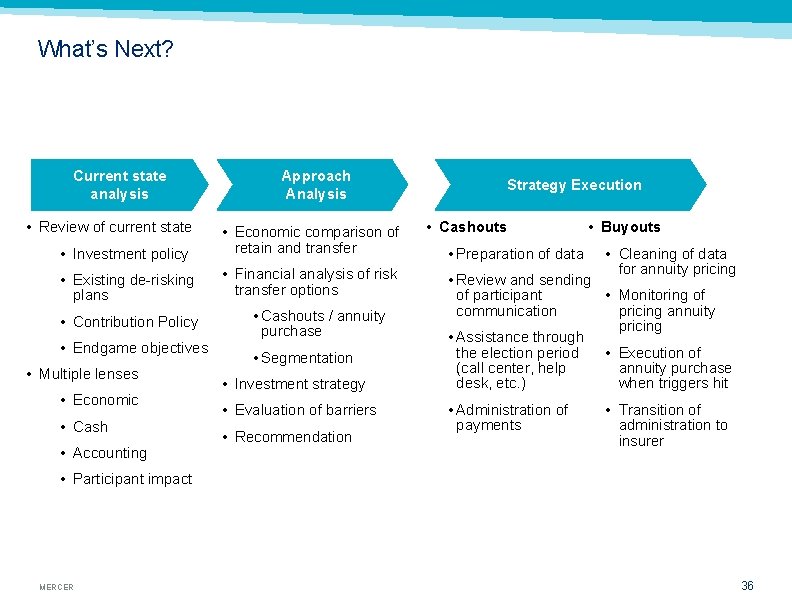
What’s Next? Current state analysis • Review of current state Approach Analysis • Investment policy • Economic comparison of retain and transfer • Existing de-risking plans • Financial analysis of risk transfer options • Contribution Policy • Endgame objectives • Multiple lenses • Economic • Cash • Accounting • Cashouts / annuity purchase • Segmentation • Investment strategy • Evaluation of barriers • Recommendation Strategy Execution • Cashouts • Preparation of data • Buyouts • Cleaning of data for annuity pricing • Review and sending • Monitoring of of participant pricing annuity communication pricing • Assistance through the election period • Execution of annuity purchase (call center, help when triggers hit desk, etc. ) • Administration of payments • Transition of administration to insurer • Participant impact MERCER 36

- Slides: 38