Optimizing Trial Design From Early Phase to Confirmatory











- Slides: 37
Optimizing Trial Design: From Early Phase to Confirmatory Trials
§ Head of Statistics § n. Query Lead Researcher § FDA Guest Speaker § Guest Lecturer HOSTED BY: Ronan Fitzpatrick
Overview Clinical Trial Stages and SSD Phase III Trials – Count Data Example Phase II Trials – Simon’s Design & MCP-Mod Phase I Trials – Continual Reassessment Method
Worked Examples Overview WORKED EXAMPLES ü Two Sample Negative Binomial üNegative Binomial GST üSimon’s Design üMCP-Mod (continuous outcome) üContinual Reassessment Method
About n. Query In 2018, 91% of organizations with clinical trials approved by the FDA use n. Query
PAR T 1 Clinical Trials Stages & SSD
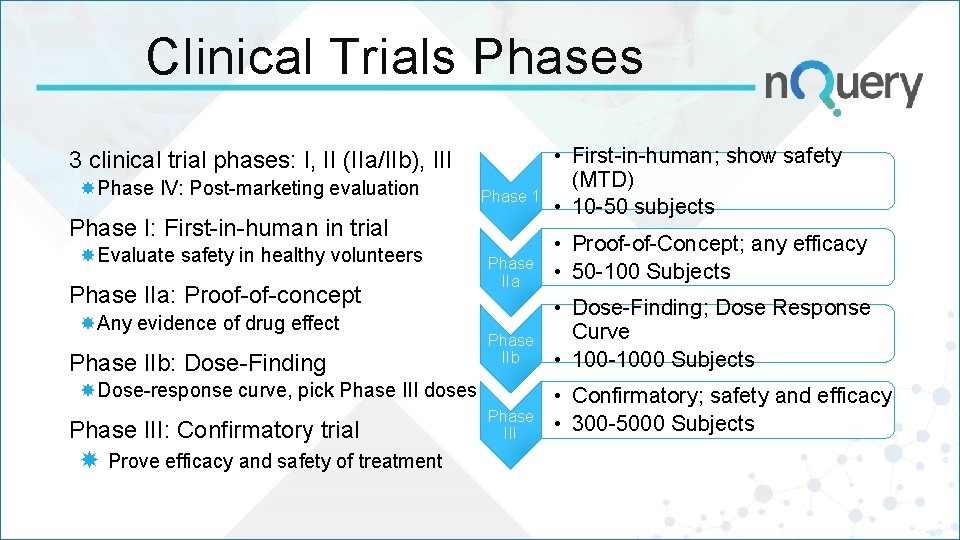
Clinical Trials Phases 3 clinical trial phases: I, II (IIa/IIb), III Phase IV: Post-marketing evaluation Phase 1 Phase I: First-in-human in trial Evaluate safety in healthy volunteers Phase IIa: Proof-of-concept Any evidence of drug effect Phase IIb: Dose-Finding Phase IIa • Proof-of-Concept; any efficacy • 50 -100 Subjects Phase IIb • Dose-Finding; Dose Response Curve • 100 -1000 Subjects Phase III • Confirmatory; safety and efficacy • 300 -5000 Subjects Dose-response curve, pick Phase III doses Phase III: Confirmatory trial Prove efficacy and safety of treatment • First-in-human; show safety (MTD) • 10 -50 subjects
PAR T 2 Phase III Trials
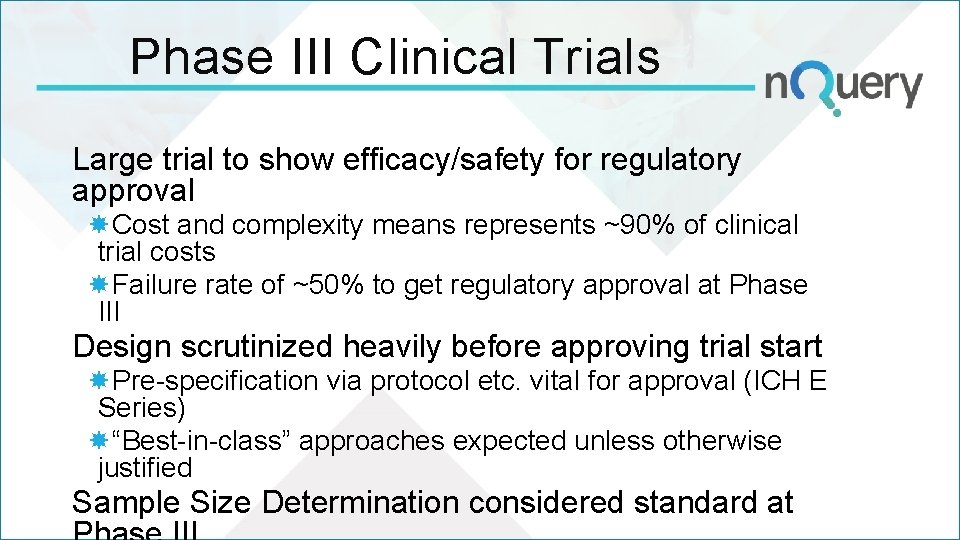
Phase III Clinical Trials Large trial to show efficacy/safety for regulatory approval Cost and complexity means represents ~90% of clinical trial costs Failure rate of ~50% to get regulatory approval at Phase III Design scrutinized heavily before approving trial start Pre-specification via protocol etc. vital for approval (ICH E Series) “Best-in-class” approaches expected unless otherwise justified Sample Size Determination considered standard at
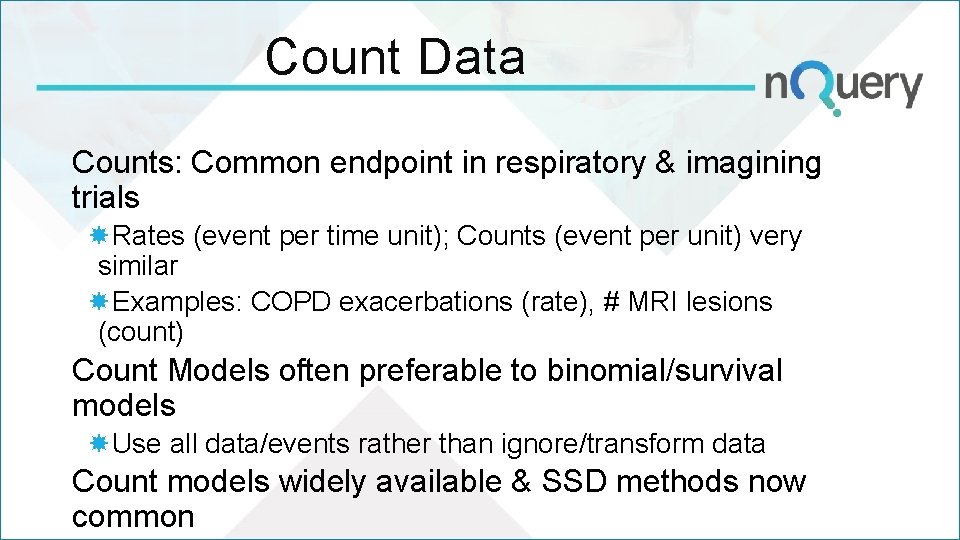
Count Data Counts: Common endpoint in respiratory & imagining trials Rates (event per time unit); Counts (event per unit) very similar Examples: COPD exacerbations (rate), # MRI lesions (count) Count Models often preferable to binomial/survival models Use all data/events rather than ignore/transform data Count models widely available & SSD methods now common
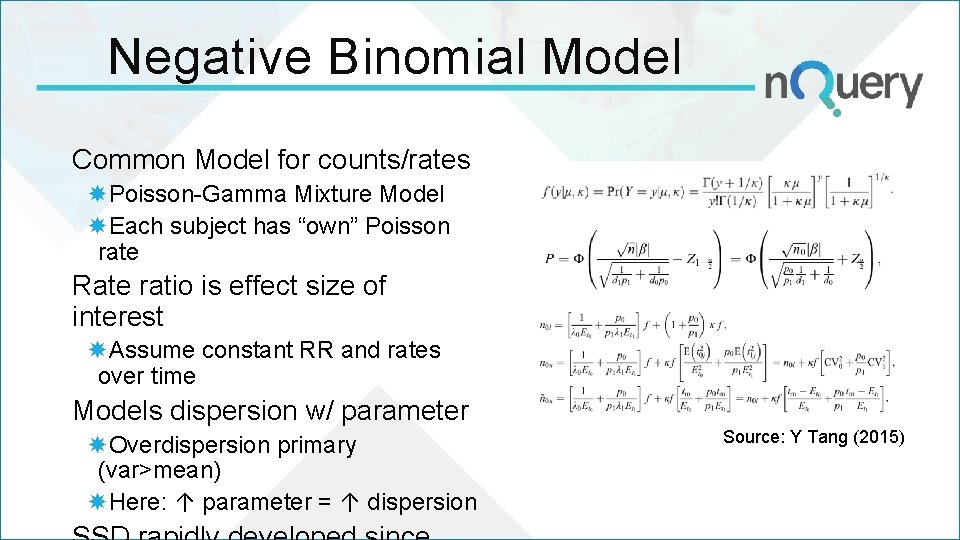
Negative Binomial Model Common Model for counts/rates Poisson-Gamma Mixture Model Each subject has “own” Poisson rate Rate ratio is effect size of interest Assume constant RR and rates over time Models dispersion w/ parameter Overdispersion primary (var>mean) Here: ↑ parameter = ↑ dispersion Source: Y Tang (2015)
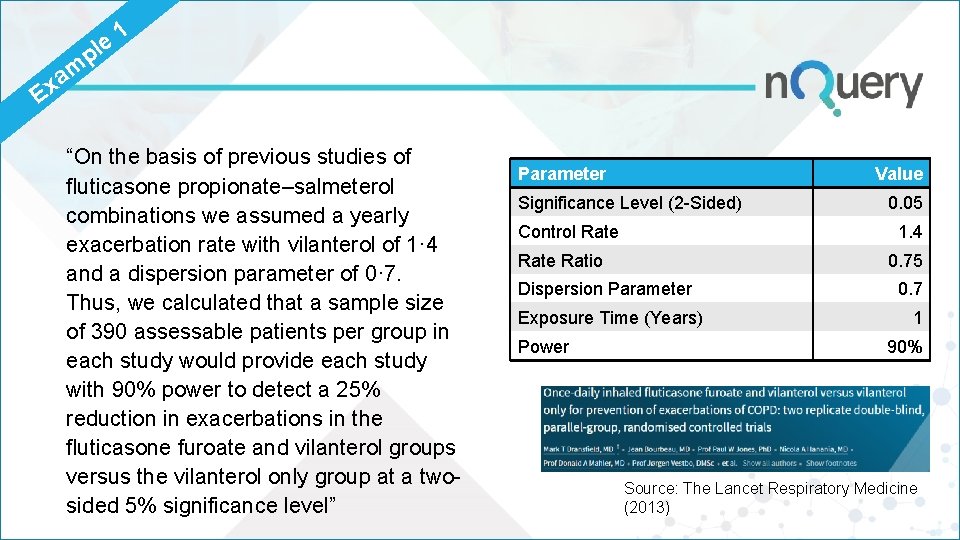
e l p 1 m a x E “On the basis of previous studies of fluticasone propionate–salmeterol combinations we assumed a yearly exacerbation rate with vilanterol of 1· 4 and a dispersion parameter of 0· 7. Thus, we calculated that a sample size of 390 assessable patients per group in each study would provide each study with 90% power to detect a 25% reduction in exacerbations in the fluticasone furoate and vilanterol groups versus the vilanterol only group at a twosided 5% significance level” Parameter Value Significance Level (2 -Sided) Control Rate 1. 4 Rate Ratio 0. 75 Dispersion Parameter Exposure Time (Years) Power 0. 05 0. 7 1 90% Source: The Lancet Respiratory Medicine (2013)
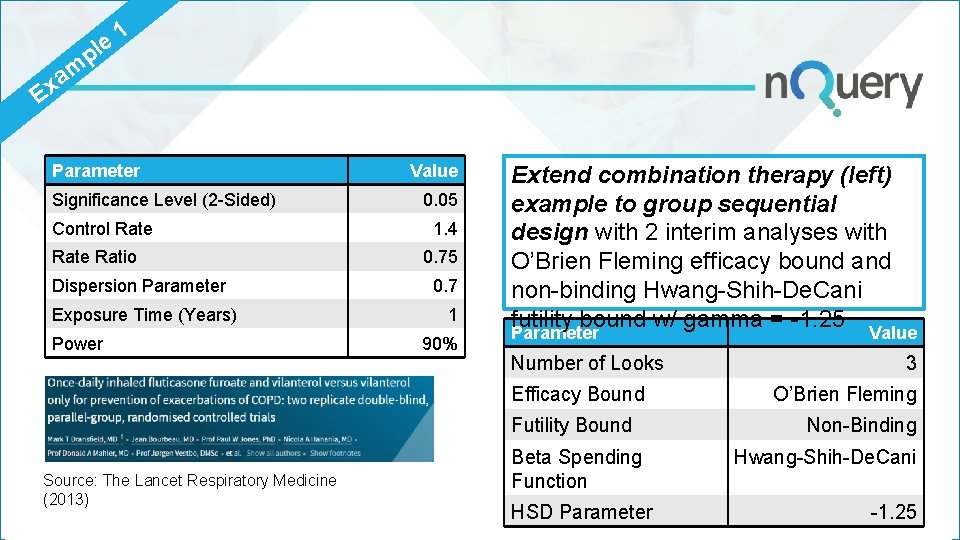
e l p 1 m a x E Parameter Significance Level (2 -Sided) Control Rate Ratio Dispersion Parameter Exposure Time (Years) Power Value 0. 05 1. 4 0. 75 0. 7 1 90% Extend combination therapy (left) example to group sequential design with 2 interim analyses with O’Brien Fleming efficacy bound and non-binding Hwang-Shih-De. Cani futility bound w/ gamma = -1. 25 Parameter Number of Looks Efficacy Bound Futility Bound Source: The Lancet Respiratory Medicine (2013) Value 3 O’Brien Fleming Non-Binding Beta Spending Function Hwang-Shih-De. Cani HSD Parameter -1. 25
PAR T 3 Phase II Trials
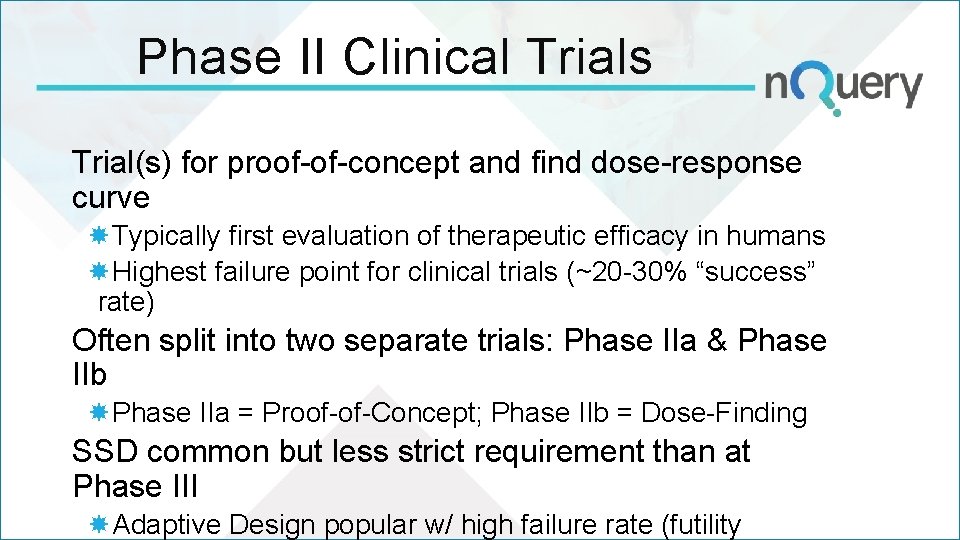
Phase II Clinical Trials Trial(s) for proof-of-concept and find dose-response curve Typically first evaluation of therapeutic efficacy in humans Highest failure point for clinical trials (~20 -30% “success” rate) Often split into two separate trials: Phase IIa & Phase IIb Phase IIa = Proof-of-Concept; Phase IIb = Dose-Finding SSD common but less strict requirement than at Phase III Adaptive Design popular w/ high failure rate (futility
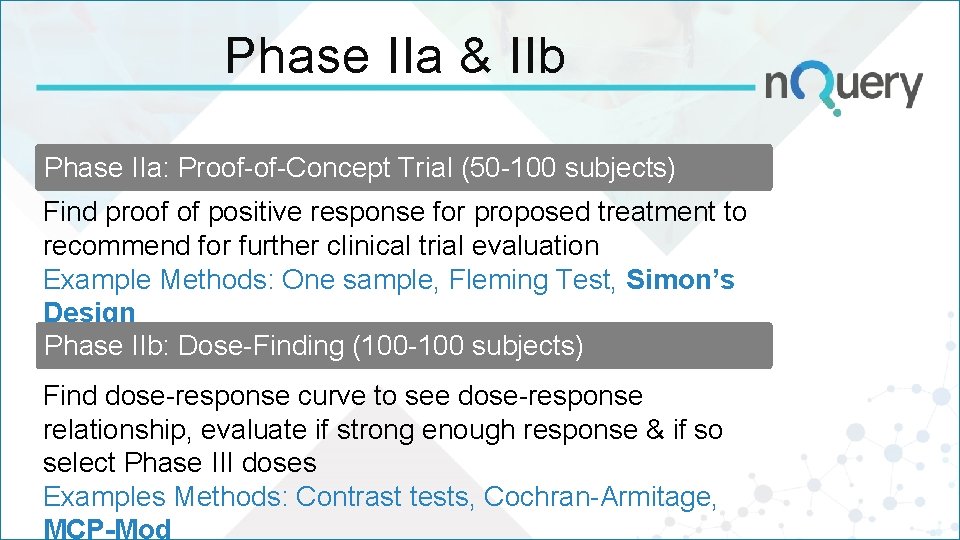
Phase IIa & IIb Phase IIa: Proof-of-Concept Trial (50 -100 subjects) Find proof of positive response for proposed treatment to recommend for further clinical trial evaluation Example Methods: One sample, Fleming Test, Simon’s Design Phase IIb: Dose-Finding (100 -100 subjects) Find dose-response curve to see dose-response relationship, evaluate if strong enough response & if so select Phase III doses Examples Methods: Contrast tests, Cochran-Armitage, MCP-Mod
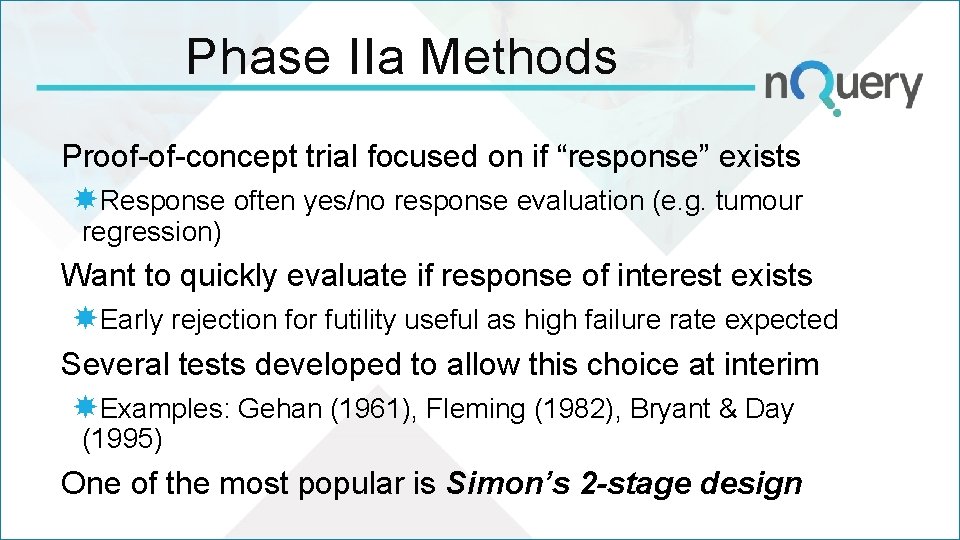
Phase IIa Methods Proof-of-concept trial focused on if “response” exists Response often yes/no response evaluation (e. g. tumour regression) Want to quickly evaluate if response of interest exists Early rejection for futility useful as high failure rate expected Several tests developed to allow this choice at interim Examples: Gehan (1961), Fleming (1982), Bryant & Day (1995) One of the most popular is Simon’s 2 -stage design
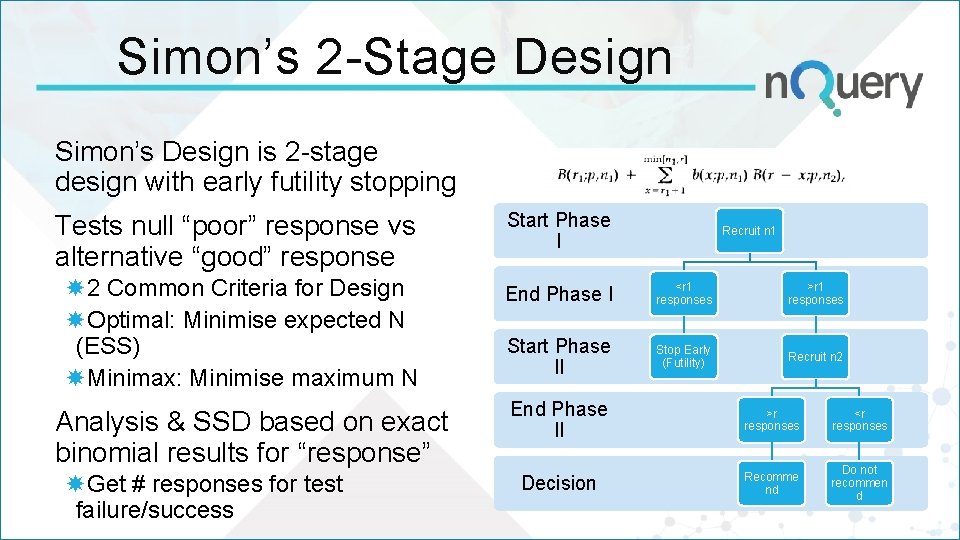
Simon’s 2 -Stage Design Simon’s Design is 2 -stage design with early futility stopping Tests null “poor” response vs alternative “good” response Start Phase I 2 Common Criteria for Design Optimal: Minimise expected N (ESS) Minimax: Minimise maximum N End Phase I <r 1 responses >r 1 responses Start Phase II Stop Early (Futility) Recruit n 2 Analysis & SSD based on exact binomial results for “response” Get # responses for test failure/success Recruit n 1 End Phase II >r responses <r responses Decision Recomme nd Do not recommen d
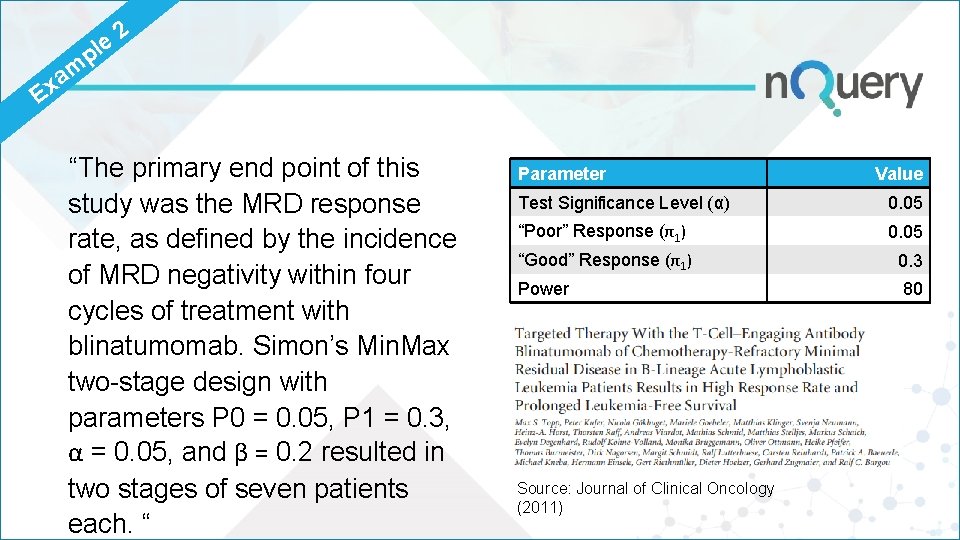
e l p 2 m a x E “The primary end point of this study was the MRD response rate, as defined by the incidence of MRD negativity within four cycles of treatment with blinatumomab. Simon’s Min. Max two-stage design with parameters P 0 = 0. 05, P 1 = 0. 3, α = 0. 05, and β = 0. 2 resulted in two stages of seven patients each. “ Parameter Value Test Significance Level (α) 0. 05 “Poor” Response (π1) 0. 05 “Good” Response (π1) 0. 3 Power 80 Source: Journal of Clinical Oncology (2011)
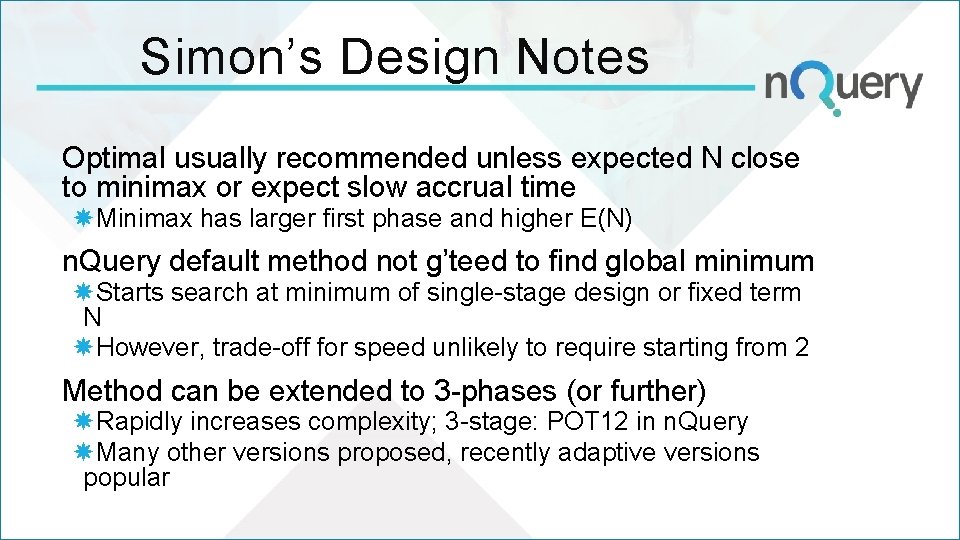
Simon’s Design Notes Optimal usually recommended unless expected N close to minimax or expect slow accrual time Minimax has larger first phase and higher E(N) n. Query default method not g’teed to find global minimum Starts search at minimum of single-stage design or fixed term N However, trade-off for speed unlikely to require starting from 2 Method can be extended to 3 -phases (or further) Rapidly increases complexity; 3 -stage: POT 12 in n. Query Many other versions proposed, recently adaptive versions popular
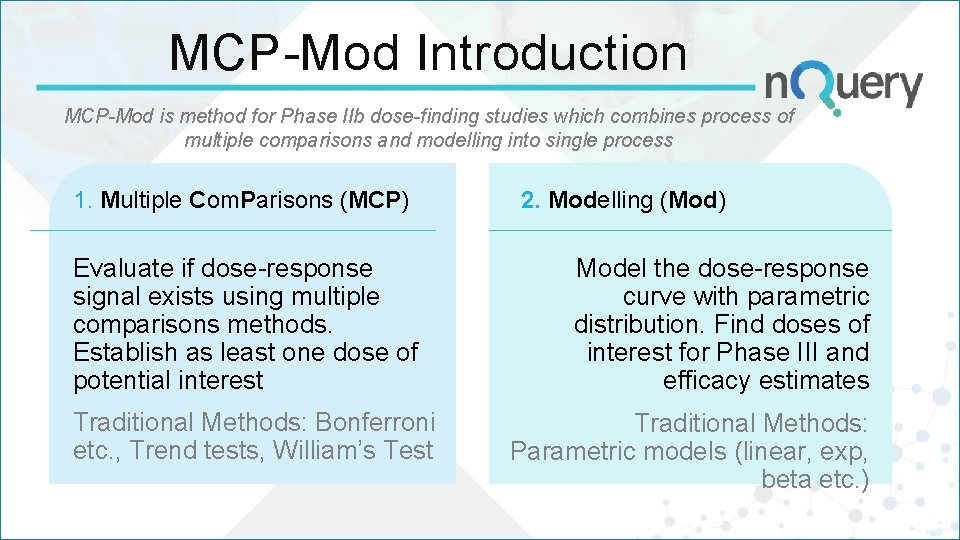
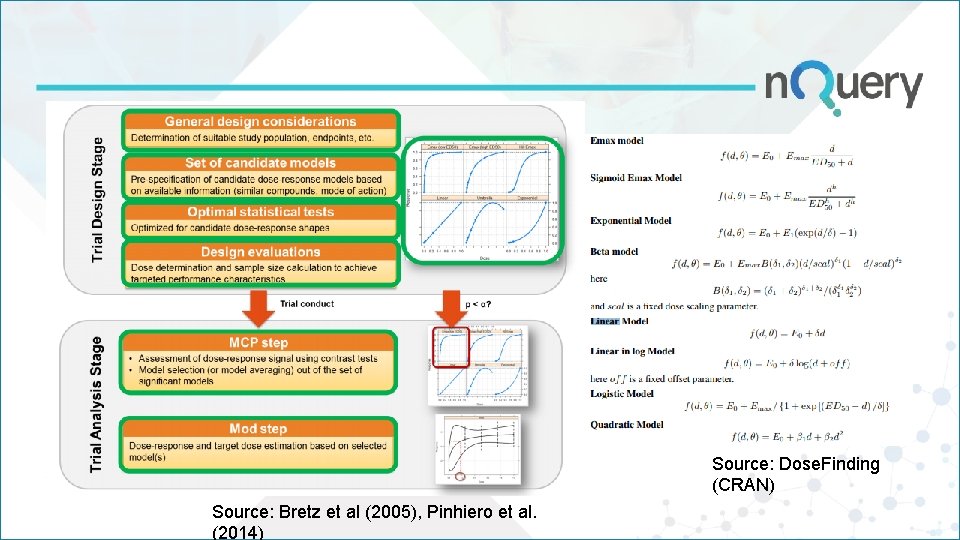
MCP-Mod Introduction MCP-Mod is method for Phase IIb dose-finding studies which combines process of multiple comparisons and modelling into single process 1. Multiple Com. Parisons (MCP) Evaluate if dose-response signal exists using multiple comparisons methods. Establish as least one dose of potential interest Traditional Methods: Bonferroni etc. , Trend tests, William’s Test 2. Modelling (Mod) Model the dose-response curve with parametric distribution. Find doses of interest for Phase III and efficacy estimates Traditional Methods: Parametric models (linear, exp, beta etc. )
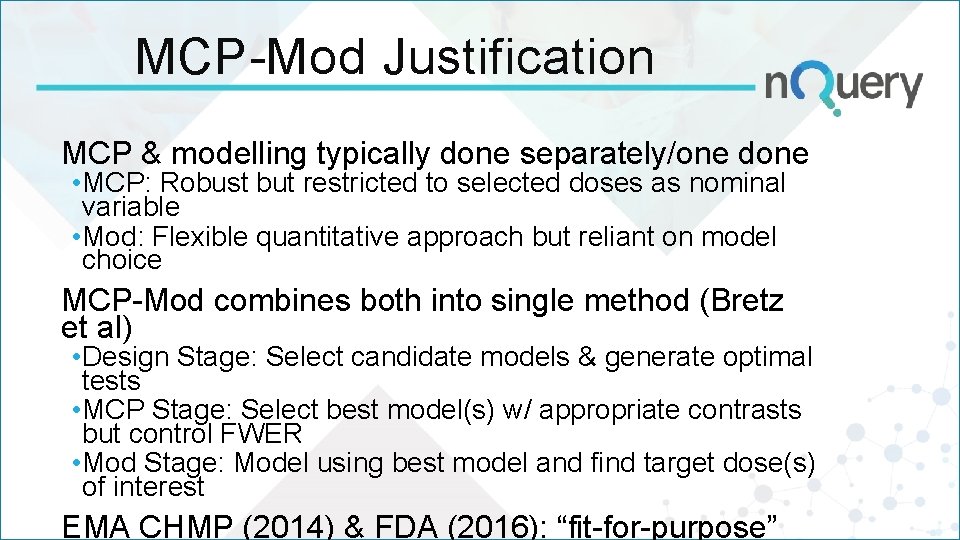
MCP-Mod Justification MCP & modelling typically done separately/one done • MCP: Robust but restricted to selected doses as nominal variable • Mod: Flexible quantitative approach but reliant on model choice MCP-Mod combines both into single method (Bretz et al) • Design Stage: Select candidate models & generate optimal tests • MCP Stage: Select best model(s) w/ appropriate contrasts but control FWER • Mod Stage: Model using best model and find target dose(s) of interest EMA CHMP (2014) & FDA (2016): “fit-for-purpose”
Source: Dose. Finding (CRAN) Source: Bretz et al (2005), Pinhiero et al. (2014)
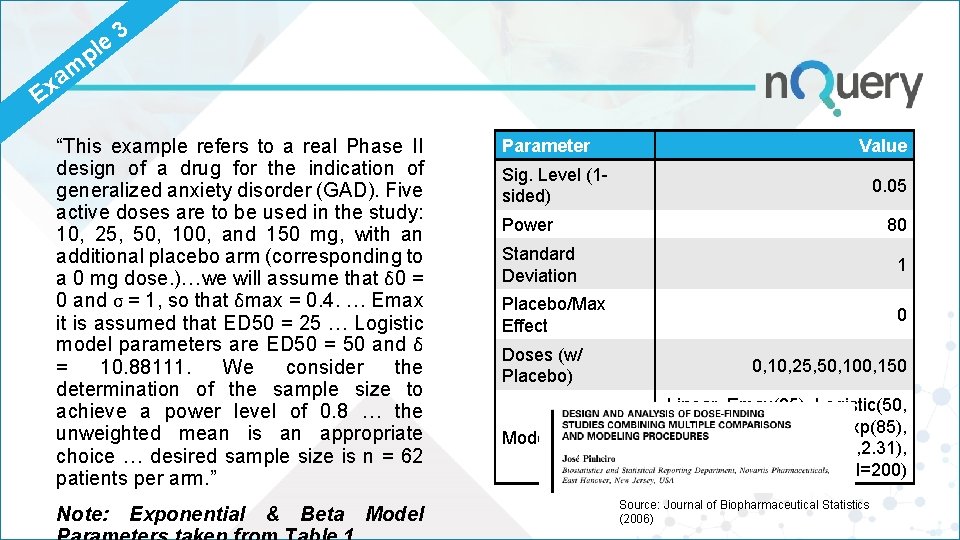
e l p 3 m a x E “This example refers to a real Phase II design of a drug for the indication of generalized anxiety disorder (GAD). Five active doses are to be used in the study: 10, 25, 50, 100, and 150 mg, with an additional placebo arm (corresponding to a 0 mg dose. )…we will assume that δ 0 = 0 and σ = 1, so that δmax = 0. 4. … Emax it is assumed that ED 50 = 25 … Logistic model parameters are ED 50 = 50 and δ = 10. 88111. We consider the determination of the sample size to achieve a power level of 0. 8 … the unweighted mean is an appropriate choice … desired sample size is n = 62 patients per arm. ” Note: Exponential & Beta Model Parameter Sig. Level (1 sided) Value 0. 05 Power 80 Standard Deviation 1 Placebo/Max Effect 0 Doses (w/ Placebo) Models 0, 10, 25, 50, 100, 150 Linear, Emax(25), Logistic(50, 10. 88), Exp(85), Beta(0. 33, 2. 31), Beta(1. 39, 1. 39) (scal=200) Source: Journal of Biopharmaceutical Statistics (2006)
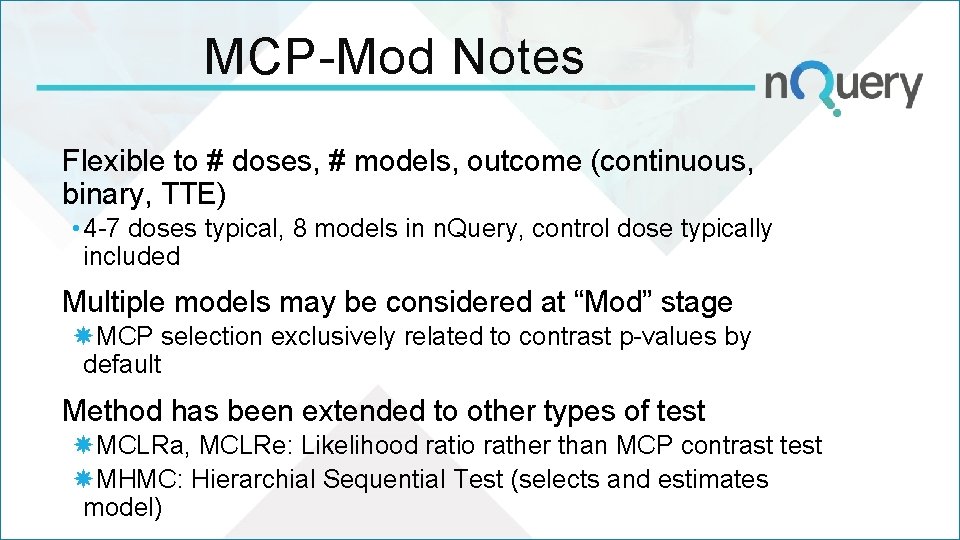
MCP-Mod Notes Flexible to # doses, # models, outcome (continuous, binary, TTE) • 4 -7 doses typical, 8 models in n. Query, control dose typically included Multiple models may be considered at “Mod” stage MCP selection exclusively related to contrast p-values by default Method has been extended to other types of test MCLRa, MCLRe: Likelihood ratio rather than MCP contrast test MHMC: Hierarchial Sequential Test (selects and estimates model)
PAR T 4 Phase I Trials
Phase I Clinical Trials First-in-human trial to evaluate safety on healthy volunteers Primary Objective: Safety Evaluation (MTD); efficacy optional Lowest failure point for clinical trials (~2 in 3 “success” rate) Rules methods popular but modelling of increasing interest Rules Method: 3+3; Modelling Method: CRM, Bayesian Logistic Significant statistical evidence for modelling over rules
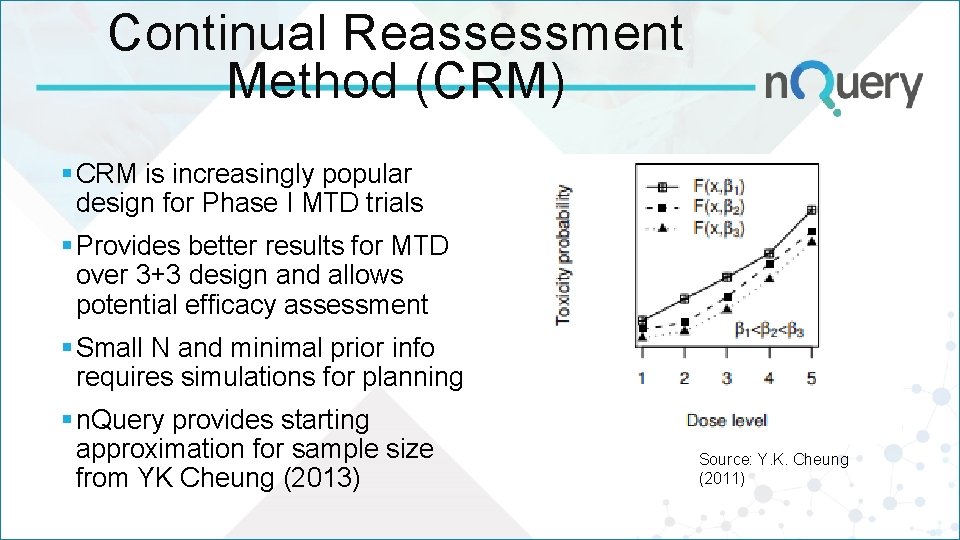
Continual Reassessment Method (CRM) § CRM is increasingly popular design for Phase I MTD trials § Provides better results for MTD over 3+3 design and allows potential efficacy assessment § Small N and minimal prior info requires simulations for planning § n. Query provides starting approximation for sample size from YK Cheung (2013) Source: Y. K. Cheung (2011)
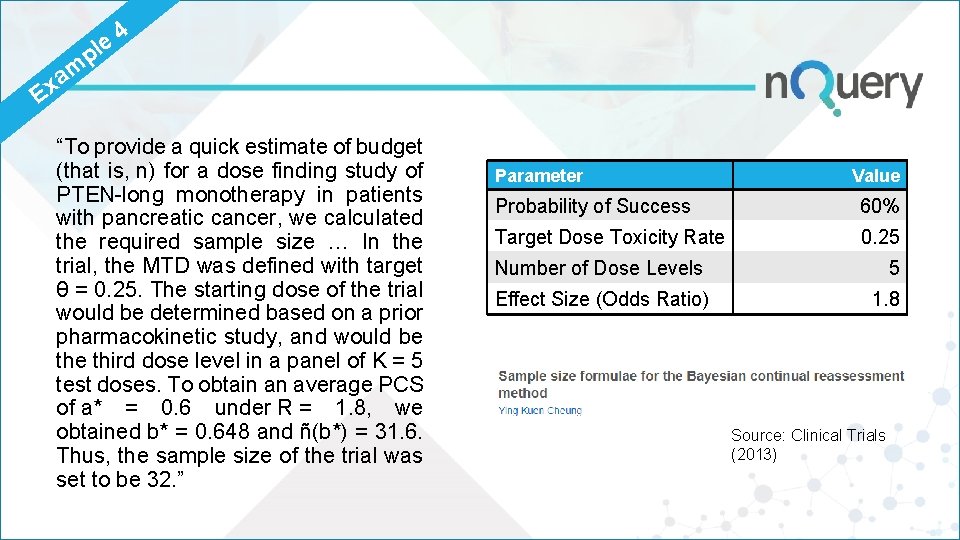
e l p 4 m a x E “To provide a quick estimate of budget (that is, n) for a dose finding study of PTEN-long monotherapy in patients with pancreatic cancer, we calculated the required sample size … In the trial, the MTD was defined with target θ = 0. 25. The starting dose of the trial would be determined based on a prior pharmacokinetic study, and would be third dose level in a panel of K = 5 test doses. To obtain an average PCS of a* = 0. 6 under R = 1. 8, we obtained b* = 0. 648 and ñ(b*) = 31. 6. Thus, the sample size of the trial was set to be 32. ” Parameter Value Probability of Success 60% Target Dose Toxicity Rate 0. 25 Number of Dose Levels 5 Effect Size (Odds Ratio) 1. 8 Source: Clinical Trials (2013)
Discussion and Conclusions Clinical trial designs should optimise for the specific phase Use context (failure %, cost) to optimize design for trial SSD methods can help evaluate and compare designs on N/cost Phase III design is focused on regulatory approval and thus design should be “best-in-class” w/ fully justified N Phase II design about evaluating if response exists & doses of interest with adaptive designs (Simon’s, MCP-Mod) rec’d
n. Query Winter 2019 Update Overhauls the workflow and plotting functionality of n. Query while adding new tables for classical, Bayesian and adaptive designs www. statsols. com/whats-new 2 New Software Improvements Improved Fully Editable Plots Simplified Welcome Screen 16 New Classical & Bayesian Tables Count Models One Proportion Credible Intervals Survival NI 6 New Adaptive Design Tables Counts GST Phase II Designs MCP-Mod
Statsols. com/trial
Q&A Any Questions? For further details, contact at: info@statsols. com Thanks for listening!
References De. Mets, D. , Friedman, L. , and Furberg, C. (2010). Fundamentals of Clinical Trials (4 th ed. ). Springer. Senn, S. S. (2008). Statistical issues in drug development. John Wiley & Sons. ICH Expert Working Group. (1998, February). Statistical principles for clinical trials E 9. In International conference on harmonisation of technical requirements for registration of pharmaceuticals for human use. ICH Expert Working Group. (1997). General considerations for clinical trials E 8. In International Conference on Harmonization of Technical Requirements for Registration of Pharmaceuticals for Human Use. International Council for Harmonisation of Technical Requirements for Pharmaceuticals for Human Use (ICH). (2016). Integrated addendum to ICH E 6 (R 1): guideline for good clinical practice E 6 (R 2). Thomas, D. W. , Burns, J. , Audette, J. , Carroll, A. , Dow-Hygelund, C. , & Hay, M. (2016). Clinical development success rates 2006– 2015. San Diego: Biomedtracker/Washington, DC: BIO/Bend: Amplion. Sertkaya, A. , Wong, H. H. , Jessup, A. , & Beleche, T. (2016). Key cost drivers of pharmaceutical clinical trials in the United States. Clinical Trials, 13(2), 117 -126.
References Tang, Y. (2015). Sample size estimation for negative binomial regression comparing rates of recurrent events with unequal follow-up time. Journal of biopharmaceutical statistics, 25(5), 1100 -1113. Tang, Y. (2017). Sample size for comparing negative binomial rates in noninferiority and equivalence trials with unequal follow-up times. Journal of biopharmaceutical statistics, 1 -17. Jennison, C. , & Turnbull, B. W. (1999). Group sequential methods with applications to clinical trials. CRC Press. US Food and Drug Administration. (2018) Adaptive design clinical trials for drugs and biologics (Draft guidance). Retrieved from https: //www. fda. gov/media/78495/download Mütze, T. , Glimm, E. , Schmidli, H. , & Friede, T. (2019). Group sequential designs for negative binomial outcomes. Statistical methods in medical research, 28(8), 2326 -2347. Dransfield, M. T. , et. al. (2013). Once-daily inhaled fluticasone furoate and vilanterol versus vilanterol only for prevention of exacerbations of COPD: two replicate double-blind, parallelgroup, randomised controlled trials. The lancet Respiratory medicine, 1(3), 210 -223. Ting, N; Chen, DG; Ho, S; Cappelleri, J; (2017). Phase II Clinical Development of New Drugs. Springer.
References Fleming, T. R. , 1982. One-sample multiple testing procedure for phase II clinical trials. Biometrics, pp. 143 -151. Gehan, E. A. , 1961. The determination of the number of patients required in a preliminary and a follow-up trial of a new chemotherapeutic agent. Journal of chronic diseases, 13(4), pp. 346 -353. Bryant, J. and Day, R. , 1995. Incorporating toxicity considerations into the design of two-stage phase II clinical trials. Biometrics, pp. 1372 -1383. Simon, R. , 1989. Optimal two-stage designs for phase II clinical trials. Controlled clinical trials, 10(1), pp. 1 -10. Jung, S. H. , Lee, T. , Kim, K. and George, S. L. , 2004. Admissible two‐stage designs for phase II cancer clinical trials. Statistics in medicine, 23(4), pp. 561 -569. Topp, M. S. , Kufer, P. , Gökbuget, N. , Goebeler, M. , Klinger, M. , Neumann, S. , Horst, H. A. , Raff, T. , Viardot, A. , Schmid, M. and Stelljes, M. , 2011. Targeted therapy with the T-cell–engaging antibody blinatumomab of chemotherapy-refractory minimal residual disease in B-lineage acute lymphoblastic leukemia patients results in high response rate and prolonged leukemia-free survival. Journal of clinical oncology, 29(18), pp. 2493 -2498.
References Englert, S. and Kieser, M. , 2013. Optimal adaptive two‐stage designs for phase II cancer clinical trials. Biometrical Journal, 55(6), pp. 955 -968. Bretz, F. , Pinheiro, J. C. and Branson, M. , 2005. Combining multiple comparisons and modeling techniques in dose‐response studies. Biometrics, 61(3), pp. 738 -748. Pinheiro, J. , Bornkamp, B. and Bretz, F. , 2006. Design and analysis of dose-finding studies combining multiple comparisons and modeling procedures. Journal of biopharmaceutical statistics, 16(5), pp. 639 -656. Bornkamp, B. , Bretz, F. , Dmitrienko, A. , Enas, G. , Gaydos, B. , Hsu, C. H. , König, F. , Krams, M. , Liu, Q. , Neuenschwander, B. and Parke, T. , 2007. Innovative approaches for designing and analyzing adaptive dose-ranging trials. Journal of biopharmaceutical statistics, 17(6), pp. 965995. Ruberg, S. J. , 1995. Dose response studies I. Some design considerations. Journal of Biopharmaceutical Statistics, 5(1), pp. 1 -14. Cheung, Y. K. (2011). Dose finding by the continual reassessment method. Chapman and Hall/CRC. Kuen Cheung, Y. (2013), Sample size formulae for the Bayesian continual reassessment method, Clinical Trials: Journal of the Society for Clinical Trials, 10(6), 852 -861.