Model Split Modal split is the process of
- Slides: 11
Model Split
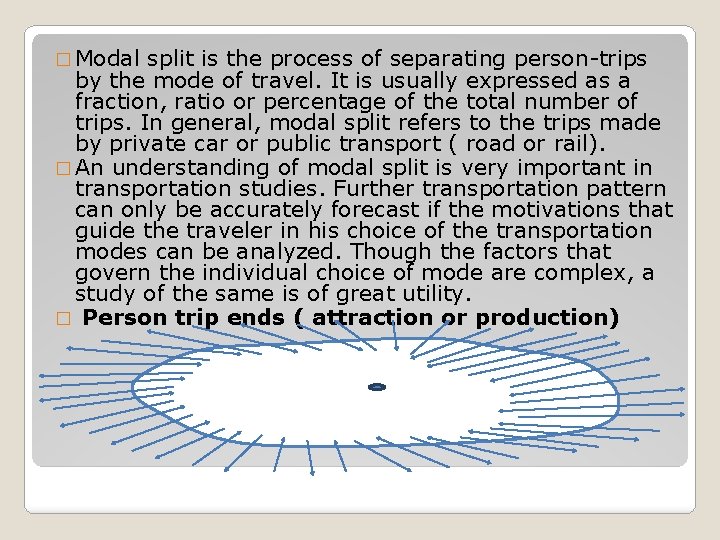
� Modal split is the process of separating person-trips by the mode of travel. It is usually expressed as a fraction, ratio or percentage of the total number of trips. In general, modal split refers to the trips made by private car or public transport ( road or rail). � An understanding of modal split is very important in transportation studies. Further transportation pattern can only be accurately forecast if the motivations that guide the traveler in his choice of the transportation modes can be analyzed. Though the factors that govern the individual choice of mode are complex, a study of the same is of great utility. � Person trip ends ( attraction or production)
�Modal Split Analysis �Factors influencing mode choice of urban travelers: �Characteristics of the trip. �Household characteristics. �Zonal characteristics. �Network characteristics.
� Characteristics of trip � Trip purpose: the choice of mode is guided to a certain extent by the trip purpose. To give an example, home based school trips have a high rate of usage of public transport. On the other hand, home based shopping journeys can have a higher rate of private car usage, for the simple reason that it is more convenient to shop when travelling in a personalized transport. � Trip length: the length can govern an individual's choice of a particular mode. A measure of the trip length is also possible by the travel time and the cost of travelling.
� Household characteristics Income: the income of a person is a direct determinant of the expenses he is prepared to incur on a journey. Higher income groups are able to purchase and maintain private cars, and thus private car trips are more frequent as the income increase. � Car ownership: car ownership is determined by the income and for this reason both income and car ownership are inter-related in their effect on modal choice. In general, families which own a car prefer private car trips, and in contrast families without car patronize public transport in the absence of any other alternative. � Family size and composition: the number of persons in the family, the number of school-going children, the number of wage earns, the number of unemployed, the age-sex structure of the family, and some other factors connected with the socio-economic status of the family profoundly influence the modal choice. Some of these factors are responsible for certain captive trips in public transport, such as those due to old age pensioners, school children, crippled and infirm persons and those who do not wish to drive. �
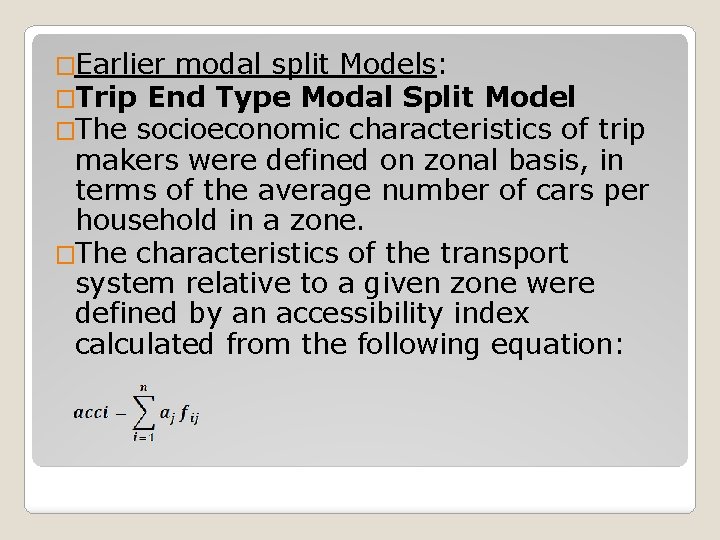
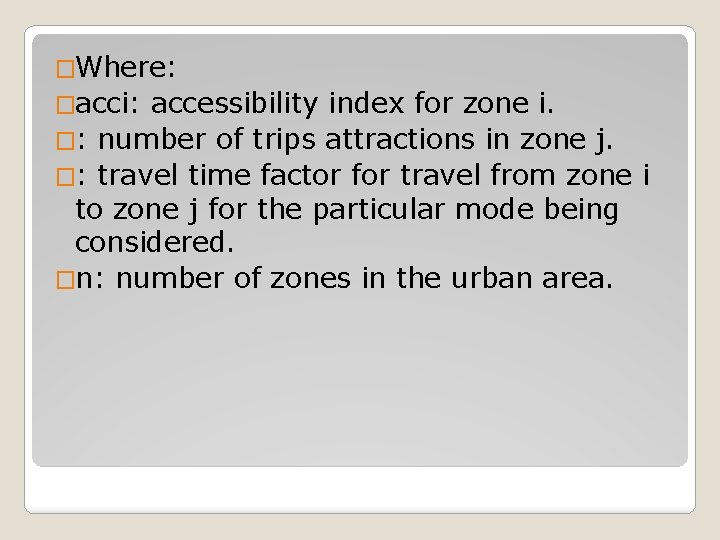
�Earlier modal split Models: �Trip End Type Modal Split Model �The socioeconomic characteristics of trip makers were defined on zonal basis, in terms of the average number of cars per household in a zone. �The characteristics of the transport system relative to a given zone were defined by an accessibility index calculated from the following equation:
�Where: �acci: accessibility index for zone i. �: number of trips attractions in zone j. �: travel time factor for travel from zone i to zone j for the particular mode being considered. �n: number of zones in the urban area.
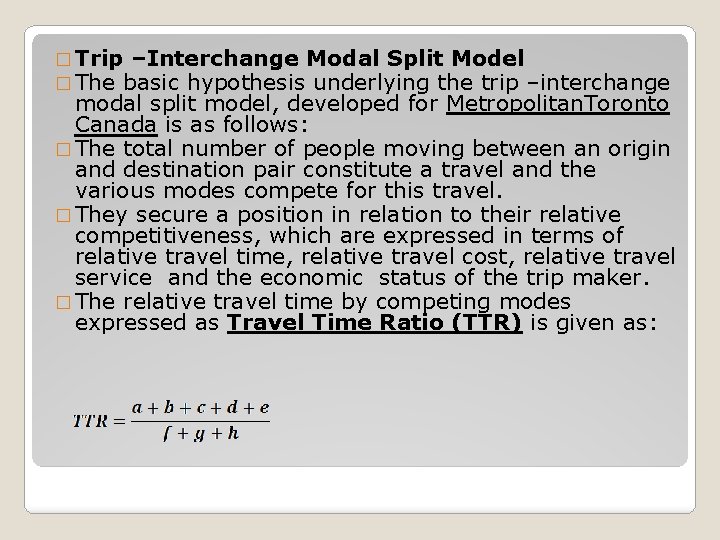
� Trip –Interchange Modal Split Model � The basic hypothesis underlying the trip –interchange modal split model, developed for Metropolitan. Toronto Canada is as follows: � The total number of people moving between an origin and destination pair constitute a travel and the various modes compete for this travel. � They secure a position in relation to their relative competitiveness, which are expressed in terms of relative travel time, relative travel cost, relative travel service and the economic status of the trip maker. � The relative travel time by competing modes expressed as Travel Time Ratio (TTR) is given as:
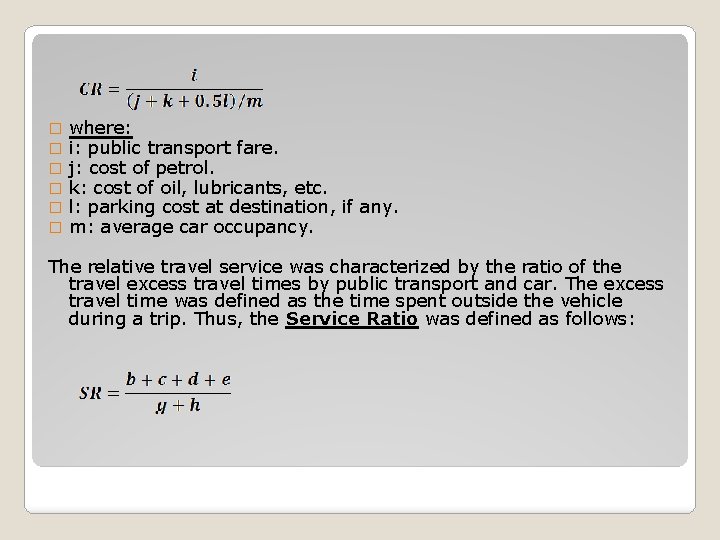
� where: � a: time spent in the public transport vehicle. � b: transfer time between public –transport vehicles. � c: time spent waiting for public transport vehicle. � d: walking time to public transport vehicle. � e: walking time from public transport vehicle. � f: car driving time. � g: parking delay at destination. � h: walking time from parking place to destination. � The relative travel cost was defined by the ratio of –out-of-pocket travel costs by public transport and car ( private transport) as follows:
� � � where: i: public transport fare. j: cost of petrol. k: cost of oil, lubricants, etc. l: parking cost at destination, if any. m: average car occupancy. The relative travel service was characterized by the ratio of the travel excess travel times by public transport and car. The excess travel time was defined as the time spent outside the vehicle during a trip. Thus, the Service Ratio was defined as follows:
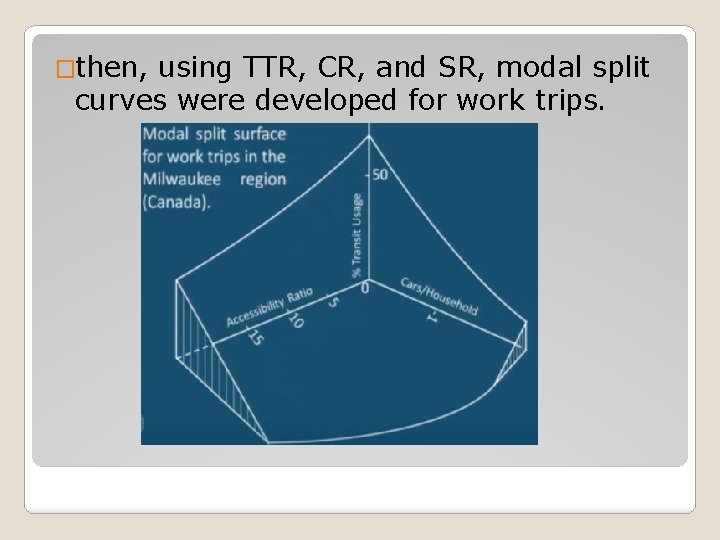
�then, using TTR, CR, and SR, modal split curves were developed for work trips.