Measuring Project Performance MS Project Key Performance Indicators

 • Quantifiable measurements – Reflect and measure achievements on critical")


 • Assume that you want to do an “If” evaluation")
 – Identifies Late Tasks")
 – Based on PM delegated")

 • Determines when the effort")


- Slides: 31
Measuring Project Performance MS Project
Key Performance Indicators (KPIs) • Quantifiable measurements – Reflect and measure achievements on critical success factors of the project • Based on beforehand agreed measures • They reveal a high-level snapshot of the what is being measured • Act as a measure of progress towards the goals of what is being measured • For a Key Performance Indicator to be of any value, there must be a way to accurately define and measure it – A clear and understandable target must be defined and communicated
Simple Examples of KPIs • For production – Number of defective products created against number of normal ones, per certain period • For sales – Number of prospects turned into actual sales against overall number of prospects, per certain period • For HR – Actual time used to find and employ an appropriate candidate against estimate time allocated for this process
What is Common in KPIs • Some measure of performance • Some standard against which the measurement occurs • Some time qualifier • Remember: any measure of project progress is really just an estimate!
Measure Cost Earned Value KPI Name Definition EV Earned Value of work actually accomplished (BCWP) PV Planned Value Planned cost of work to be done at this point and time (BCWS) AC Actual Cost of work completed (ACWP) BAC Budget at Completion Total planned value of the entire project EAC Estimate at Completion What you think the project will actually cost ETC Estimate to Completion From this point, how much more will it cost to complete the project VAC Variance at Completion How much over/under budget do we expect to be at project end TCPI To Complete Performance Index What cost performance goals must be met to stay within the BAC
Common EV Measures KPI Formula Description Cost variance CV = EV-AC earned value-actual value (>0 is good) Schedule variance SV=EV-PV earned value-planned value (>1 is good) Cost performance index CPI = EV/PV earned value/actual value (>1 is good) Schedule performance index SPI=EV/PV earned value/planned value (>1 is good)
EV in MS Project
10 reasons why Earned Valve Analysis doesn’t work • No documented requirements • Incomplete requirements – Without requirements, the link to developing a quality WBS is broken • WBS not used or not accepted • WBS incomplete – without a complete WBS, the schedule and budget will not accurately reflect what it will take to successfully complete the project • • • Plan not integrated (WBS-Schedule-Budget) Schedule and/or budget incorrect Change management not used or ineffective Cost collection system inadequate Incorrect progress Management influence and/or control
Dashboard • Facilitate control over KPIs by providing them all in one place • Where the project manager can see and control all the key performance indicators related to his/her project • Indicators can be derived from several key elements (areas) concurrently
Simple MS Project Dashboards You Can Build • Some indicators we will examine – Late Tasks – Horizon Segments – Baseline Status – Effort Status – Variance Days – Variance Hours – % Variance – Target % Complete
Customizing a Text Field • Add a text field to your project view (Gantt, Detailed Gantt, etc. )
Customizing a Text Field • Select the text field that you are going to customize • Give it a title for display in the project view
Customizing a Text Field • Select the column, right-button click and select the Customize Fields menu option
Customizing a Text Field • Rename the field • Write formula • Select display options – Data – Graphical Indicators
Developing the Formula • When you select the “Formula” option in the Custom Attributes, you will get a formula editor
Developing the Formula (Cont’d) • Assume that you want to do an “If” evaluation on the “project Start Date”
Plan Status • Icon Indicators (red, yellow, green and flag) – Identifies Late Tasks – Illustrates Horizon Task Segments • 0 - 7 days • 8 - 21 days • 22 – 30 days – Uses a custom text field IIf([% Complete]<100 And [Finish]<[Date 10]+1, "R", IIf([% Complete]<100 And [Finish]<[Date 10]+7, "Y", IIf([% Complete]<100 And [Finish]<[Date 10]+21, "G", IIf([% Complete]<100 And [Finish]<[Date 10]+30, "F", ""))))
Baseline Status • Icon Indicators (red, yellow and green) – Based on PM delegated authority Any change in resourcing that increases the allocated hours for a task group by more than 10% or any change in a milestone finish date that exceeds 20 days – Calculate 20 day authority • Exceed 20 day authority • Horizon Segments – 5 days – 10 days – Uses a custom text field IIf([% Complete]<100 And [Finish]-[Baseline Finish]>=20, "R", IIf([% Complete]<100 And [Finish]-[Baseline Finish]>10, "Y", IIf([% Complete]<100 And [Finish]-[Baseline Finish]>5, "G", "")))
Baseline Variance Days • Calculated values – Compare Planned Finish Date to Baseline Finish Date – Indicates how many days the planned finish date is now beyond the baseline finish date – Uses a custom text field IIf([% Complete]<100 And Round([Finish]-[Baseline Finish])>0, Round([Finish]-[Baseline Finish]), "")
Effort Status • Icon Indicators (green, yellow and red) • Determines when the effort hours for a task has increased by more than 10% • Provides indication of 2. 5% and 5% increases • Uses a custom text field IIf([% Complete]<100 And [Work]>([Baseline Work]*1. 1), "R", IIf([% Complete]<100 And [Work]>([Baseline Work]*1. 05), "Y", IIf([% Complete]<100 And [Work]>([Baseline Work]*1. 025), "G", "")))
Variance Hours • Calculated values • Compares the Planned Work to the Baseline Work • Determines the actual effort hours for a task that has increased effort by more than 10% • Provides indication of 2. 5% and 5% increases • Uses a custom text field IIf([% Complete]<100 And [Work]>([Baseline Work]*1. 1), ([Work][Baseline Work])/60, IIf([% Complete]<100 And [Work]>([Baseline Work]*1. 05), ([Work]-[Baseline Work])/60, IIf([% Complete]<100 And [Work]>([Baseline Work]*1. 025), ([Work]-[Baseline Work])/60, "")))
% Variance • Calculated values • Compares the Planned Work to the Baseline Work • Determines the % increase of actual effort hours for a task that has increased effort by more than 10% • Uses a custom text field IIf([% Complete]<100 And [Work]>([Baseline Work]*1. 1), Round(((((([Work]-[Baseline Work])/60)/[Work])*100)), "")
% Complete Target • Calculated value • Identifies the % complete that should have been attained by the day the schedule is opened • Used to monitor % complete progress and/or reporting IIf([% Complete]<100 And ([Date 10]-[Start])>0 And [Duration]>0, IIf([Finish]<=[Date 10], "100", Round(([Date 10][Start])/(([Duration]/60)/6)*100)), "")
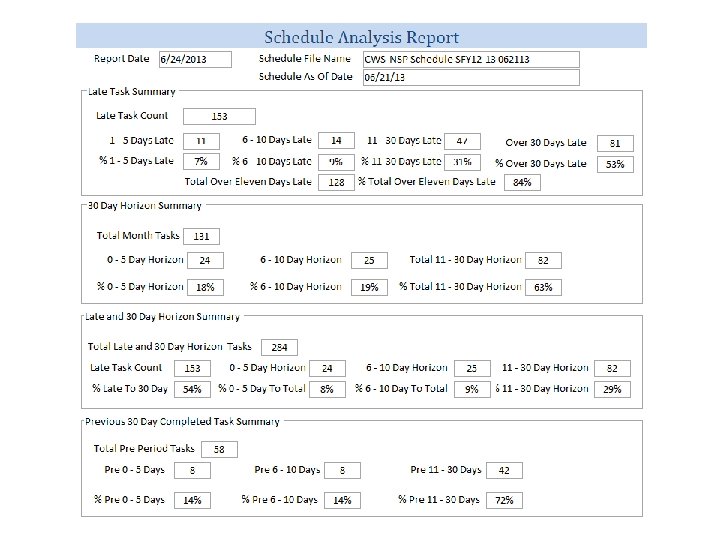
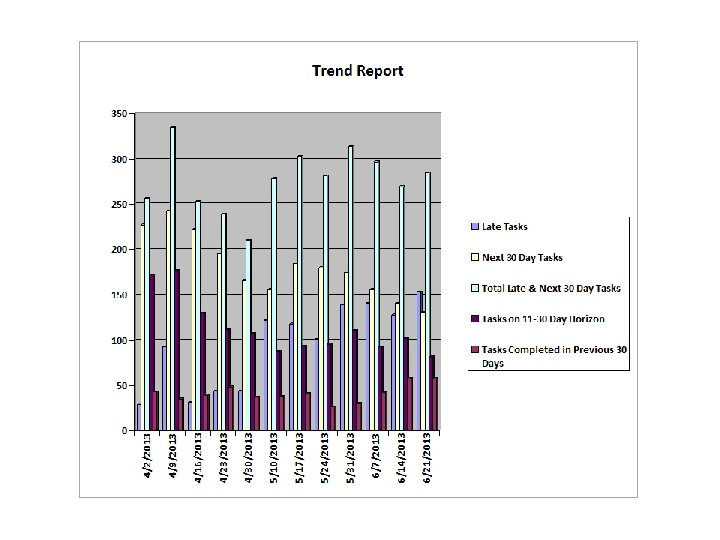
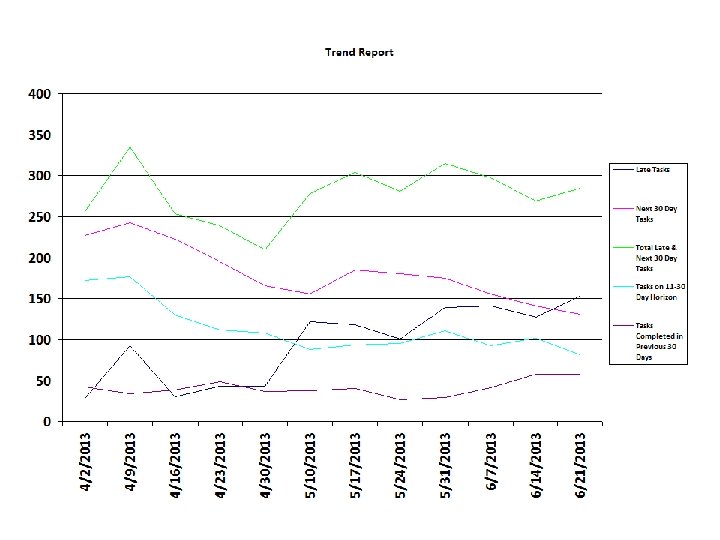
Standard Reports
Visual Reports • Use the Report menu option to navigate to the Visual Reports dialog • Make time based selection for selected report • You can create new or modify existing templates, but be careful
Resource Effort Assignment • Output is an MS Excel Pivot Table • Modify the displayed content using the field categories in the right-hand border • Assume that you only want to show September – December 2013 • To determine over-under allocation – Team works 6 hour day on project – These four months have 81 actual work days – Fully resourced staff member should work 486 hours
Supporting Options • Export MS Project file to Excel • Import Excel file into MS Access • Slice, dice and manipulate at will to do custom reports • and…………………. you get to write VBA code
Successor Chain Report