Marketing Analytics Conjoint Analysis Dr Arne Floh a


 The basic outputs of")


² I 2 1, 6667 0, 333 0,")

 Type of cheese (3")


 = S S aijxij j=1 i=1 P: A")
 *Base product for customer 1: Thin pizza with")

 Under this choice rule, each customer selects the product that")

 § Consider a market with three customers")
 Utility (Value) of each product for each")


- Slides: 38
Marketing Analytics – Conjoint Analysis Dr Arne Floh a. floh@surrey. ac. uk Skype: arnefloh
NEW PRODUCT DEVELOPEMENT
Overview of New Product Development Process Opportunity Identification Reposition Market definition Idea generation Harvest Life-Cycle Management Go No Market response analysis & fine tuning the marketing mix; Competitor monitoring & defense Innovation at maturity Design Identifying customer needs Sales forecasting Product positioning Engineering Marketing mix assessment Segmentation Go No Introduction Go No Launch planning Tracking the launch Testing Advertising & product testing Pretest & prelaunch forecasting Test marketing Go No
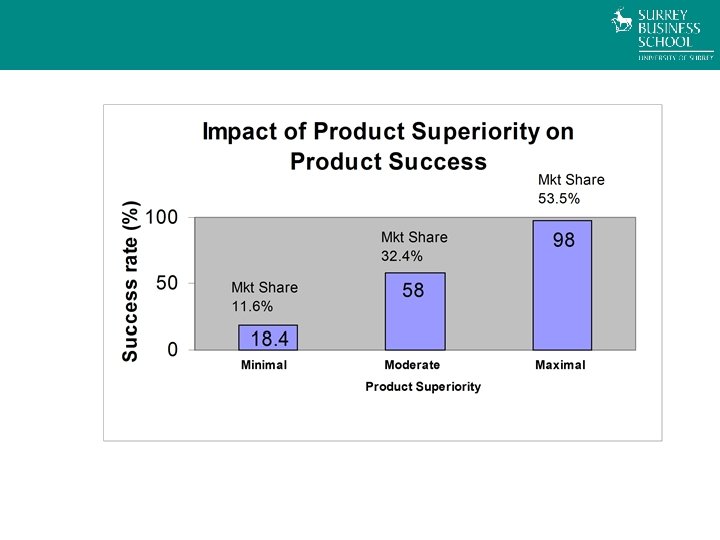
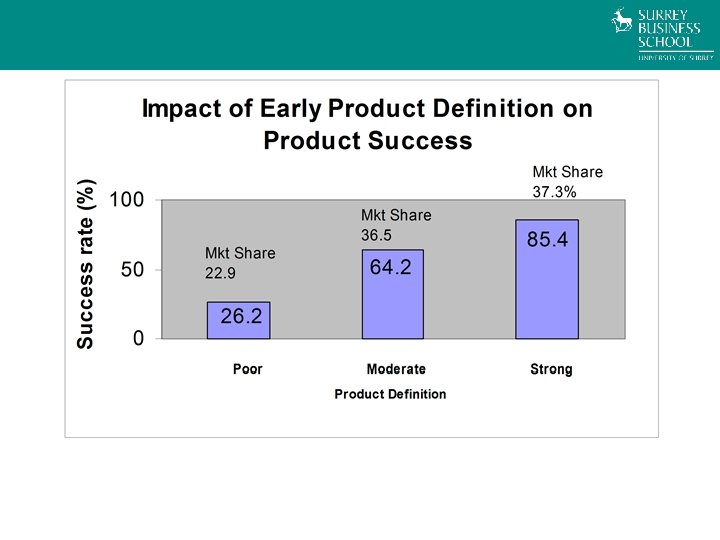
Value of Good Design 80% of a product’s manufacturing costs are incurred during the first 20% of its design (varies with product category). Conjoint Analysis is a systematic approach for matching product design with the needs and wants of customers, especially in the early stages of the New Product Development process.
CONJOINT ANALYSIS
Conjoint Analysis is a dependence technique used to understand how respondents develop preferences for products or services. The dependent variable is a measure of respondent preference and can be metric or nonmetric (choice-based conjoint). The independent variables are dummy variables representing attributes of multiattribute products or services. The researcher first constructs a set of real or hypothetical products by combining selected levels of each attribute (factor): – In most situations, the researcher will need to create an experimental design. – Some computer programs will create the design (Sawtooth Software, SPSS Conjoint). These combinations or profiles are then presented to respondents, who provide their overall evaluations.
What Does Conjoint Analysis Do? (Measure Importance by Assessing Preferences) The basic outputs of conjoint analysis are: • A numerical assessment of the relative importance that customers attach to attributes of a product category • The value (utility) provided to customers by each potential feature (attribute option) of an offering • Identification of product designs that maximize market share or other indices.
In developing the conjoint task the researcher must answer four questions. . . What are the important attributes that could affect preference? How will respondents know the meaning of each factor? What do the respondents actually evaluate? How many profiles are evaluated?
Is calculated as shown below: Is a decompositional technique: – Conjoint decomposes stated overall preference to determine preferences for each attribute. That is, the researcher collects data on the overall preference for a stimulus and decomposes it to ratings for the individual attributes. – In contrast, with compositional techniques the researcher collects ratings on many product characteristics and then compares the ratings to an overall preference rating to develop a predictive model. Individual-, aggregate-, or segment-level models can be estimated.
Conjoint Analysis in Product Design Conjoint Analysis can help answering the following questions: • Should we offer our business travelers more room space or a fax machine in their room? • Given a target cost for a product, should we enhance product reliability or its performance? • Should we use a steel or aluminum casing to increase customer preference for the new equipment?
Measuring Importance of Attributes When choosing a restaurant, how important is… Circle one Not Very Important Decor Important 1 2 3 4 5 6 7 8 9 Location 1 2 3 4 5 6 7 8 9 Quality of food 1 2 3 4 5 6 7 8 9 Price 1 2 3 4 5 6 7 8 9
Measuring Importance of Attributes Average Importance Ratings Décor 5, 7 Location 6, 5 Quality of Food 7, 1 Price 6, 2 1 5 9
Conjoint Study Process Stage 1—Designing the conjoint study: Step 1. 1: Select attributes relevant to the product or service category, Step 1. 2: Select levels for each attribute, and Step 1. 3: evaluated. Develop the “product” bundles to be Stage 2—Obtaining data from a sample of respondents: Step 2. 1: and Design a data-collection procedure, Step 2. 2: Select a computation method for obtaining part-worth functions. Stage 3—Evaluating product design options: Step 3. 1: Segment customers based on their part -worth functions, Step 3. 2: Design market simulations, and
Measuring Importance By Measuring Utility For single-attribute products, an underlying preference or utility scale can be constructed as follows: – If a customer tells you she prefers Blue to Red, Red to Yellow, and Blue to Yellow (transitivity), then you can create an underlying numeric scale with the following “utiles” to represent customer preferences for the three colors: assign 3 to Blue, 2 to Red, and 1 to Yellow; or you could assign 10 to Blue, 9. 95 to Red, and 1 to Yellow. From this can we say whether this customer would prefer Orange to Red? Note: Preferences represent a higher-order construct than Utility, i. e. , utility comes from preferences. How do we come up with an underlying scale to represent customer preferences for multi-attributed products?
Methodological Issues Selecting a measure of consumer preference: • • • Rankings (requires transformation or specialized computer software) Ratings Choices Choosing a presentation method: • • • Trade-off presentation – compares attributes two at a time. Full-profile presentation – most popular and most realistic. • Factorial design • Fractional factorial design • Bridging design Pairwise presentation – a combination of other two methods.
Part-Worth I Attribute B Attribute A 1 2 1 1, 5 -2, 0 2 3 4 3, 5 0, 0 3 6 5 5, 5 2. 0 3, 6667 3, 3333 3, 5 0, 1667 - 0, 1667 Part-Worth m= 3, 5 A 1 = -2, 000 B 1 = +0, 1667 A 2 = -0, 000 B 2 = -0, 1667 A 3 = +2, 000 Total Utility: y 1 = 3, 5 + (-2, 0) + 0, 1667 = 1, 667
Part-Worth II Stimulus p y p–y (p-y)² I 2 1, 6667 0, 333 0, 111 II 1 1, 3333 -0, 333 0, 111 III 3 3, 6667 -0, 667 0, 4444 IV 4 3, 3333 0, 667 0, 4444 V 6 5, 6667 0, 333 0, 1111 VI 5 5, 3333 -0, 333 0, 1111 21 21, 0000 0, 000 1, 3333
EXAMPLE
Designing a Frozen Pizza Attributes Type of crust (3 types) Type of cheese (3 types) Price (3 levels) • Topping (4 varieties) • Amount of cheese (2 levels) Price Crust Topping Type of cheese Pan Pineapple Romano $9. 99 2 Oz. Thin Veggie Mixed cheese $8. 99 6 Oz. Thick Sausage Mozzarella $7. 99 Pepperoni A total of 216 (3 x 4 x 3 x 2 x 3) different pizzas can be developed from these options! Amount of cheese
Designing a Frozen Pizza Example Paired Comparison Data Aloha Meat-Lover’s Special treat Crust Pan Thick Topping Pineapple Type of cheese Mozzarella Amount of cheese 2 Oz Price $8. 99 $9. 99 Which do you prefer? Which one would you buy? Pepperoni Mixed cheese 6 Oz
Designing a Frozen Pizza Example Ratings Data
Conjoint Utility Computations kj m U(P) = S S aijxij j=1 i=1 P: A particular product/concept of interest U(P): The utility associated with product P aij: Utility associated with the jth level (j = 1, 2, 3. . . kj) on the ith attribute kj : Number of levels of attribute i m: Number of attributes xij: 1 if the jth level of the ith attribute is present in product P, 0 otherwise
Part-Worth Computation: (Designing a Frozen Pizza) *Base product for customer 1: Thin pizza with pineapple, 2 oz of Romano cheese, and priced at $9. 99.
Market Share and Revenue Share Forecasts Define the competitive set – this is the set of products from which customers in the target segment make their choices. Some of them may be existing products and, others concepts being evaluated. We denote this set of products as P 1, P 2, . . . PN. Select Choice rule – Maximum utility rule – Share of preference rule – Logit choice rule – Alpha rule Software also has a “Revenue index option” wherein you can compute the revenue index of any product compared to the revenue index of 100 for a base product you select.
Maximum Utility Rule (Example) Under this choice rule, each customer selects the product that offers him/her the highest utility among the competing alternatives. Market share for product Pi is then given by: K is the number of consumers who participated in the study.
Other Choice Rules • Share of utility rule: Under this choice rule, the consumer selects each product with a probability that is proportional to the utility of that compared to the total utility derived from all the products in the choice set. • Logit choice rule: This is similar to the share of utility rule, except that it gives larger weights to more preferred alternatives and smaller weights to less preferred alternatives. • Alpha rule: Modified version of share of utility rule. Before applying the share of utility, the utility functions are modified by an “alpha” factor so that the computed market shares of existing products are as close as possible to their actual market shares.
Market Share Computation (Designing a Frozen Pizza) § Consider a market with three customers and three products:
Market Share Computation (Designing a Frozen Pizza) Utility (Value) of each product for each customer. Maximum Utility Rule: If we assume customers will only buy the product with the highest utility, the market share for Meat Lover’s treat is 2/3 and for Aloha Special is 1/3. Share of preference rule: If we assume that each customer will buy each product in proportion to its utility relative to the other products, then market shares for the three products are: Aloha Special (29. 3%), Meat Lover’s Treat (48. 1%) and Veggie Delite (22. 6%).
Identifying Segments Based on Conjoint Part Worths Note: You should not use standardize option in segmentation software when determining segments.
Other Issues That Can Be Addressed Revenue/profit potential of a new product Find optimal product by segment Assess cannibalization potential of new product
Situations Where Conjoint Analysis Might Be Valuable The new offering involves important tradeoffs affecting design, production, marketing, or other operational variables. The offering is realistically decomposable into a set of basic attributes. Consumer choices with respect to the offering and its market tends to be high involvement. Factorial combinations of basic attribute levels are believable. Desirable new offerings alternatives can be synthesized from basic alternatives. The alternatives can be realistically described, either verbally or pictorially. (Otherwise, actual product formulations should be considered). Perceptions of hypothetical combinations are reasonably homogeneous across members of the target group.
Conjoint Enhancements Adaptive Conjoint Choice-based Conjoint Internet data collection tools Improved input/output
Summary: Utility of Conjoint Analysis Design new offerings that enhance customer value. Forecast sales/market share/profit of alternative offerings. Identify market segments for which a given concept/offering has high value. Identify the “best” concept/offering for a target segment. Explore impact of alternative pricing and service strategies. Plan production in flexible manufacturing systems.
Session 8 What is Conjoint Analysis and how can it be used for product development? How can results of Conjoint Analysis be interpreted? What are pros& cons of Conjoint Analysis? How can it be linked with other statistical methods?