MACRO ECONOMICS Copyright ACDC Leadership 2015 1 Sing





- Slides: 41
MACRO ECONOMICS Copyright ACDC Leadership 2015 1
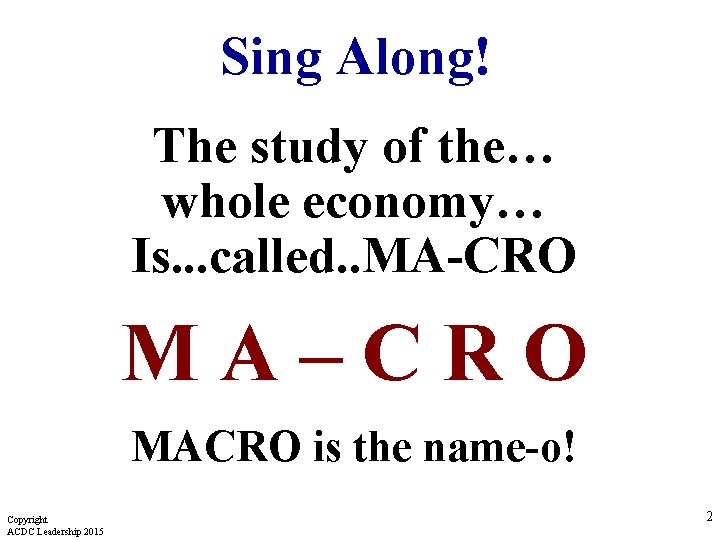
Sing Along! The study of the… whole economy… Is. . . called. . MA-CRO MA–CRO MACRO is the name-o! Copyright ACDC Leadership 2015 2
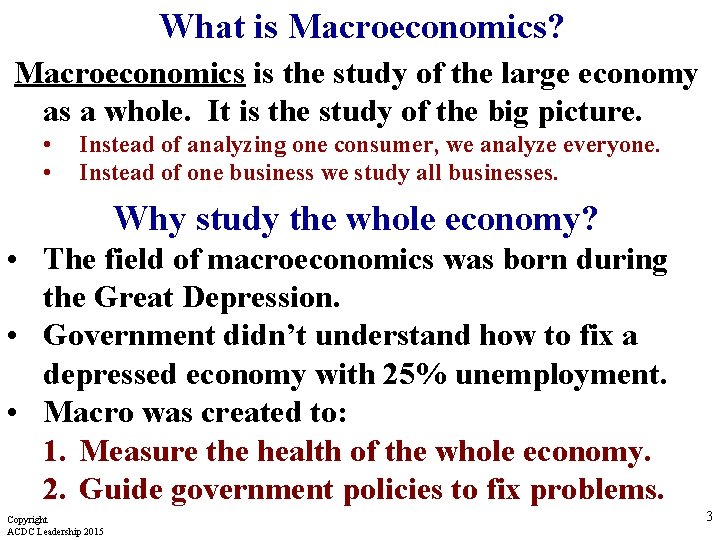
What is Macroeconomics? Macroeconomics is the study of the large economy as a whole. It is the study of the big picture. • • Instead of analyzing one consumer, we analyze everyone. Instead of one business we study all businesses. Why study the whole economy? • The field of macroeconomics was born during the Great Depression. • Government didn’t understand how to fix a depressed economy with 25% unemployment. • Macro was created to: 1. Measure the health of the whole economy. 2. Guide government policies to fix problems. Copyright ACDC Leadership 2015 3
Unit 2: Macro Measures Copyright ACDC Leadership 2015 4
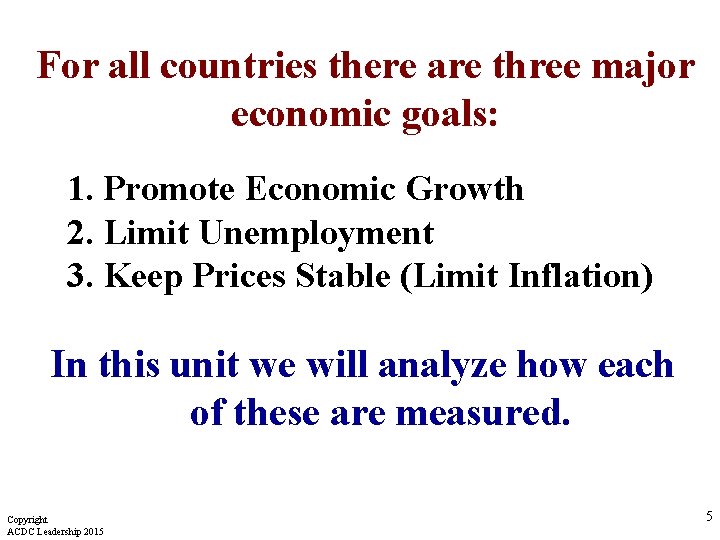
For all countries there are three major economic goals: 1. Promote Economic Growth 2. Limit Unemployment 3. Keep Prices Stable (Limit Inflation) In this unit we will analyze how each of these are measured. Copyright ACDC Leadership 2015 5
Goal #1 Promote Economic Growth How does a country measure economic growth? Copyright ACDC Leadership 2015 6
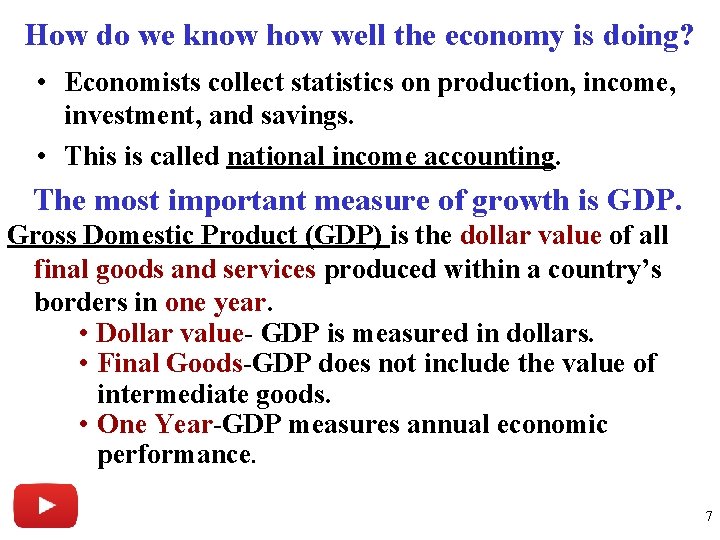
How do we know how well the economy is doing? • Economists collect statistics on production, income, investment, and savings. • This is called national income accounting. The most important measure of growth is GDP. Gross Domestic Product (GDP) is the dollar value of all final goods and services produced within a country’s borders in one year. • Dollar value- GDP is measured in dollars. • Final Goods-GDP does not include the value of intermediate goods. • One Year-GDP measures annual economic performance. 7
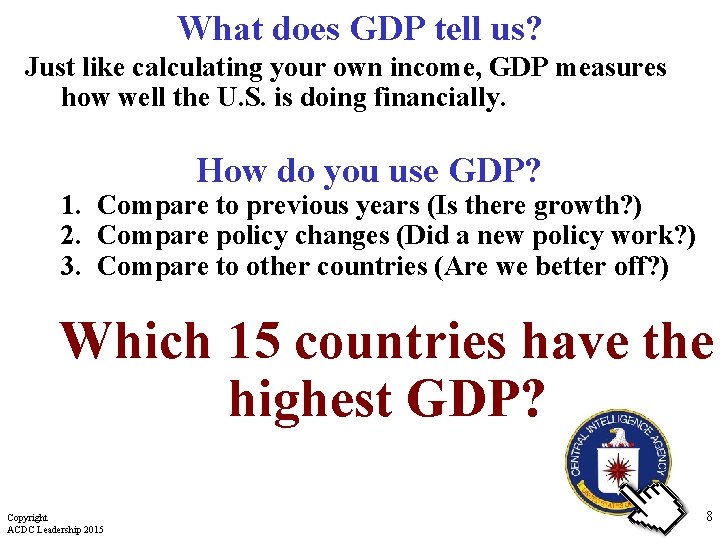
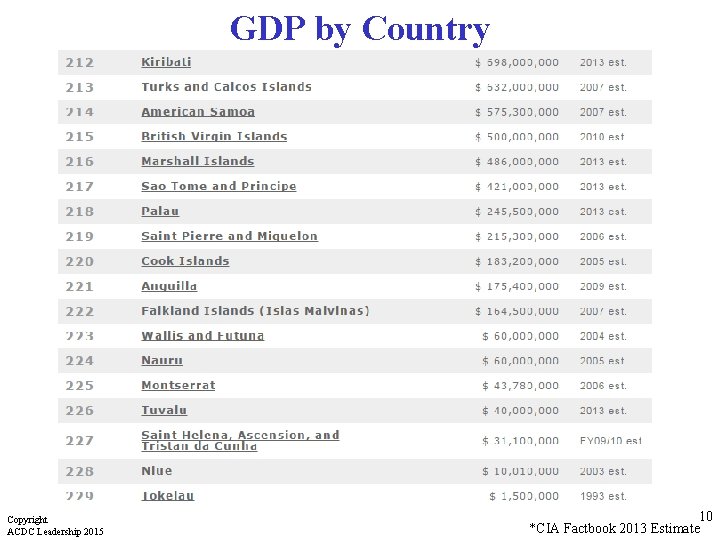
What does GDP tell us? Just like calculating your own income, GDP measures how well the U. S. is doing financially. How do you use GDP? 1. Compare to previous years (Is there growth? ) 2. Compare policy changes (Did a new policy work? ) 3. Compare to other countries (Are we better off? ) Which 15 countries have the highest GDP? Copyright ACDC Leadership 2015 8
GDP by Country Copyright ACDC Leadership 2015 39 *CIA Factbook 2013 Estimate
GDP by Country Copyright ACDC Leadership 2015 10 *CIA Factbook 2013 Estimate
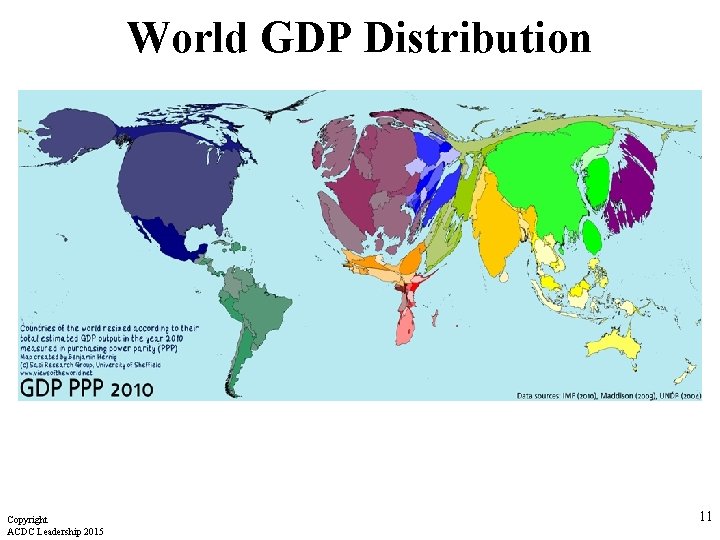
World GDP Distribution Copyright ACDC Leadership 2015 11
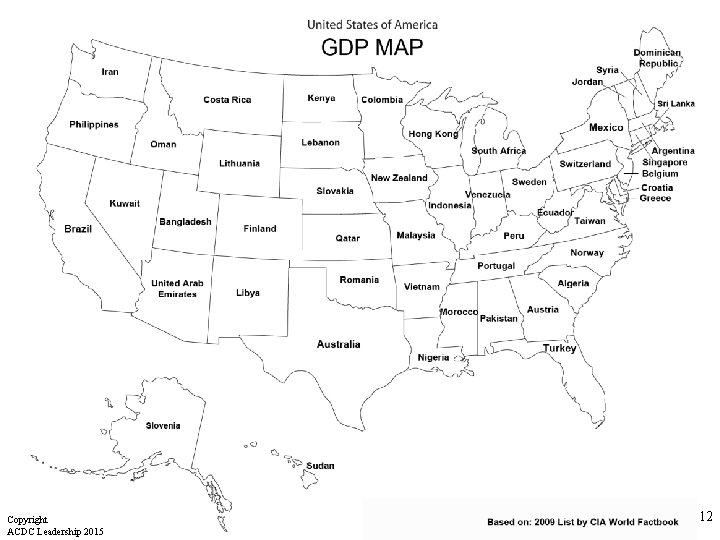
Copyright ACDC Leadership 2015 12
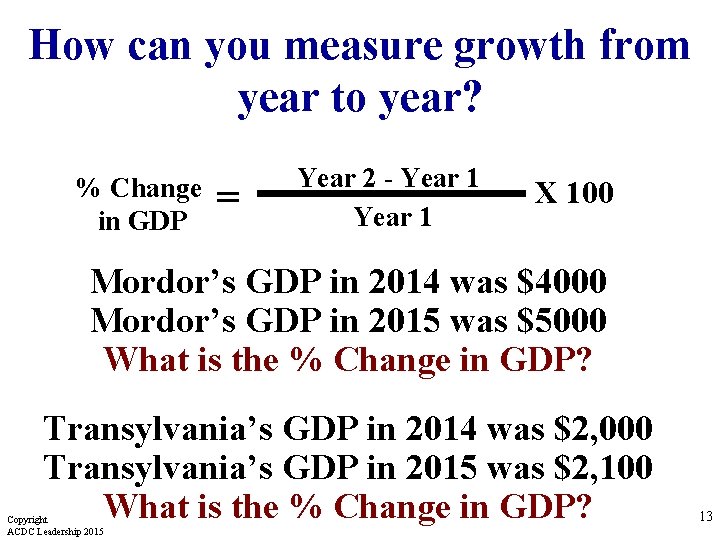
How can you measure growth from year to year? % Change in GDP = Year 2 - Year 1 X 100 Mordor’s GDP in 2014 was $4000 Mordor’s GDP in 2015 was $5000 What is the % Change in GDP? Transylvania’s GDP in 2014 was $2, 000 Transylvania’s GDP in 2015 was $2, 100 What is the % Change in GDP? Copyright ACDC Leadership 2015 13
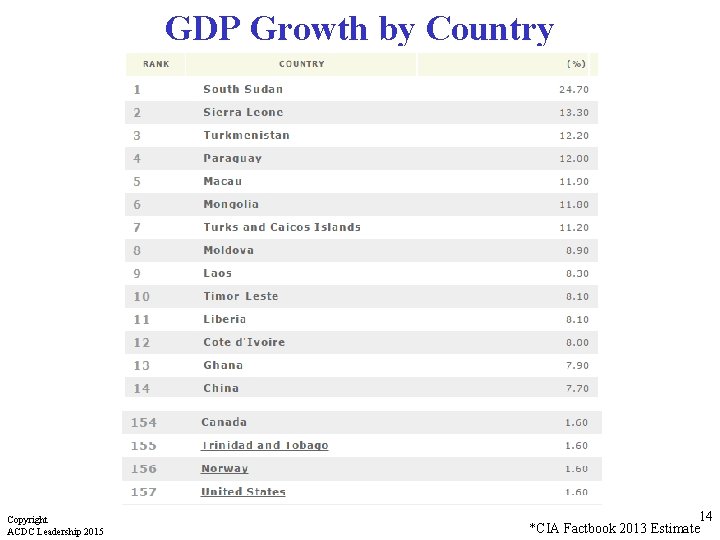
GDP Growth by Country Copyright ACDC Leadership 2015 14 *CIA Factbook 2013 Estimate
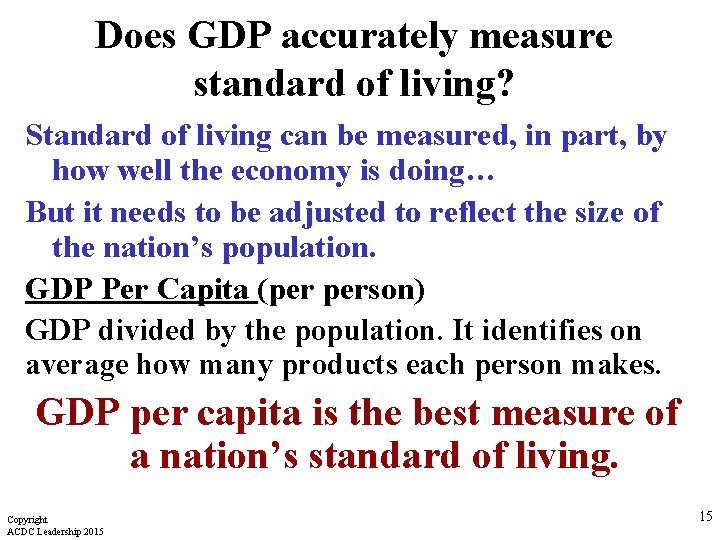
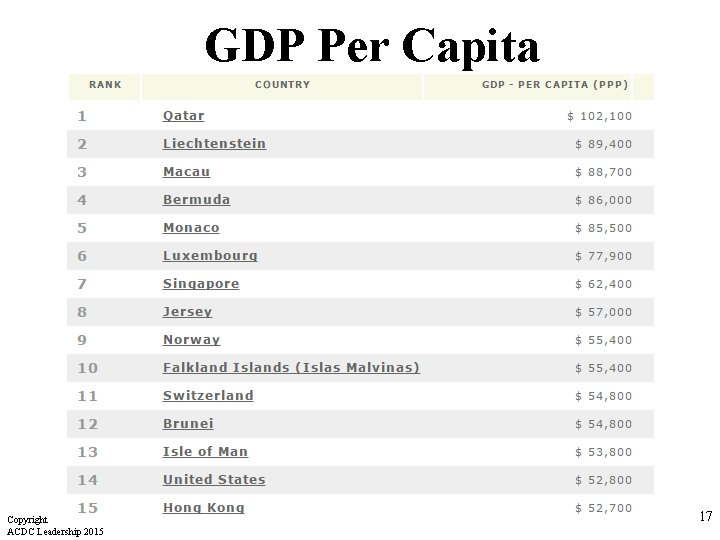
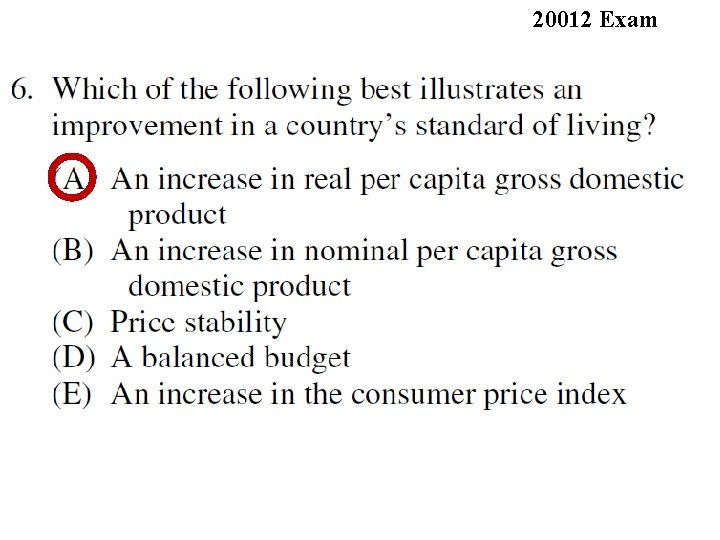
Does GDP accurately measure standard of living? Standard of living can be measured, in part, by how well the economy is doing… But it needs to be adjusted to reflect the size of the nation’s population. GDP Per Capita (per person) GDP divided by the population. It identifies on average how many products each person makes. GDP per capita is the best measure of a nation’s standard of living. Copyright ACDC Leadership 2015 15
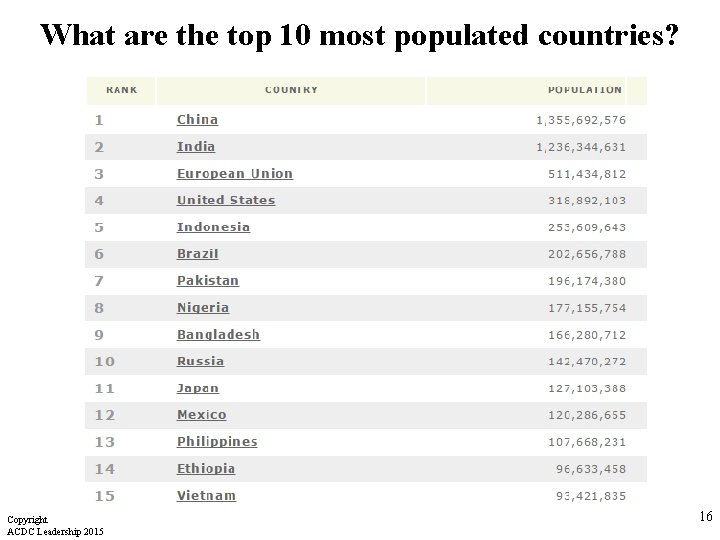
What are the top 10 most populated countries? Copyright ACDC Leadership 2015 16
GDP Per Capita Copyright ACDC Leadership 2015 17
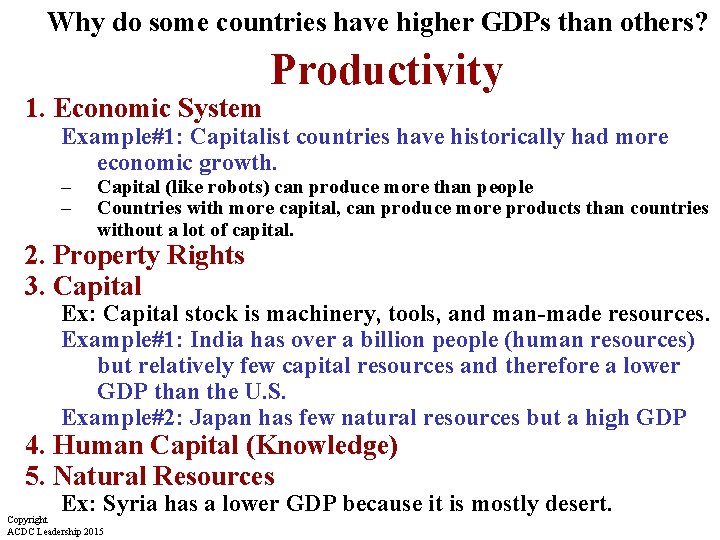
Why do some countries have higher GDPs than others? 1. Economic System Productivity Example#1: Capitalist countries have historically had more economic growth. – – Capital (like robots) can produce more than people Countries with more capital, can produce more products than countries without a lot of capital. 2. Property Rights 3. Capital Ex: Capital stock is machinery, tools, and man-made resources. Example#1: India has over a billion people (human resources) but relatively few capital resources and therefore a lower GDP than the U. S. Example#2: Japan has few natural resources but a high GDP 4. Human Capital (Knowledge) 5. Natural Resources Ex: Syria has a lower GDP because it is mostly desert. Copyright ACDC Leadership 2015
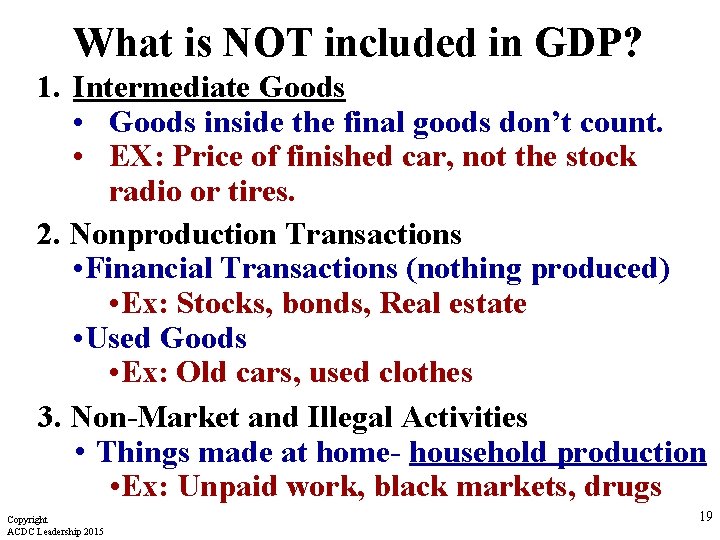
What is NOT included in GDP? 1. Intermediate Goods • Goods inside the final goods don’t count. • EX: Price of finished car, not the stock radio or tires. 2. Nonproduction Transactions • Financial Transactions (nothing produced) • Ex: Stocks, bonds, Real estate • Used Goods • Ex: Old cars, used clothes 3. Non-Market and Illegal Activities • Things made at home- household production • Ex: Unpaid work, black markets, drugs Copyright ACDC Leadership 2015 19
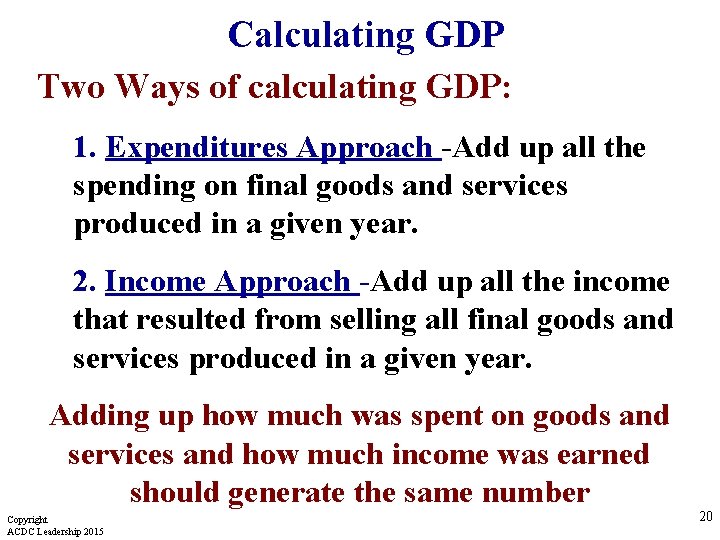
Calculating GDP Two Ways of calculating GDP: 1. Expenditures Approach -Add up all the spending on final goods and services produced in a given year. 2. Income Approach -Add up all the income that resulted from selling all final goods and services produced in a given year. Adding up how much was spent on goods and services and how much income was earned should generate the same number Copyright ACDC Leadership 2015 20
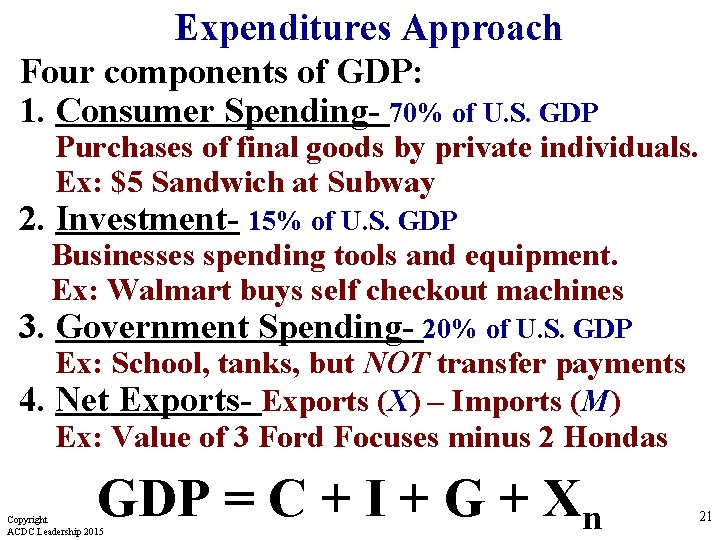
Expenditures Approach Four components of GDP: 1. Consumer Spending- 70% of U. S. GDP Purchases of final goods by private individuals. Ex: $5 Sandwich at Subway 2. Investment- 15% of U. S. GDP Businesses spending tools and equipment. Ex: Walmart buys self checkout machines 3. Government Spending- 20% of U. S. GDP Ex: School, tanks, but NOT transfer payments 4. Net Exports- Exports (X) – Imports (M) Ex: Value of 3 Ford Focuses minus 2 Hondas GDP = C + I + G + Xn Copyright ACDC Leadership 2015 21
Calculating GDP Copyright ACDC Leadership 2015 22
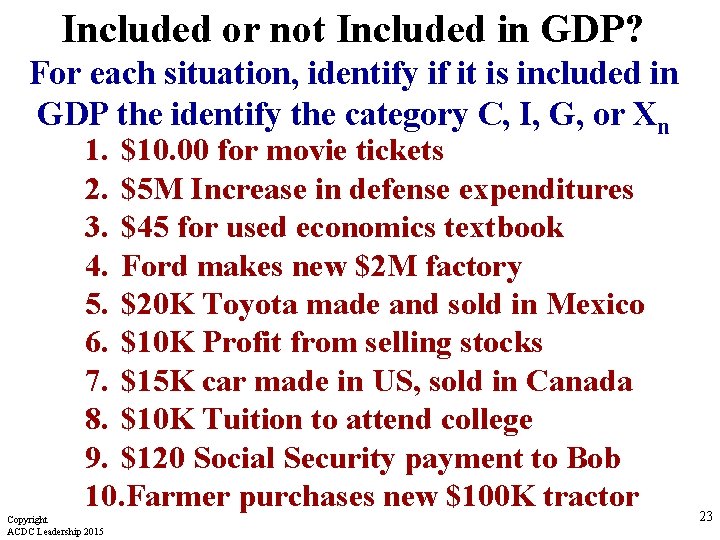
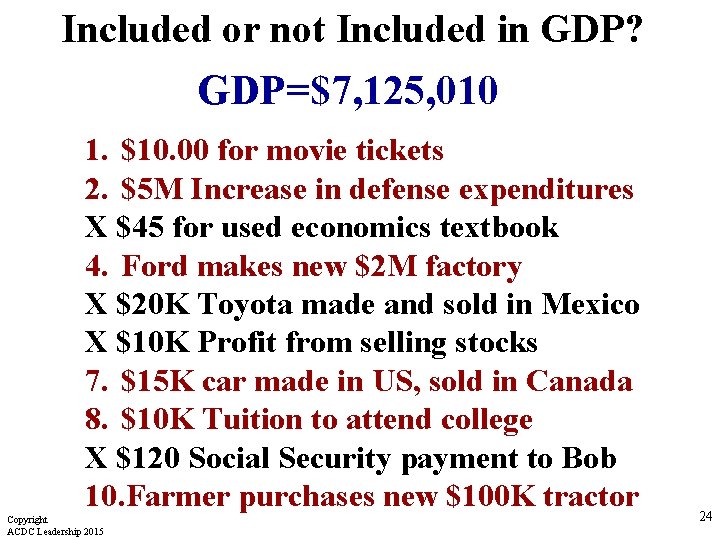
Included or not Included in GDP? For each situation, identify if it is included in GDP the identify the category C, I, G, or Xn 1. $10. 00 for movie tickets 2. $5 M Increase in defense expenditures 3. $45 for used economics textbook 4. Ford makes new $2 M factory 5. $20 K Toyota made and sold in Mexico 6. $10 K Profit from selling stocks 7. $15 K car made in US, sold in Canada 8. $10 K Tuition to attend college 9. $120 Social Security payment to Bob 10. Farmer purchases new $100 K tractor Copyright ACDC Leadership 2015 23
Included or not Included in GDP? GDP=$7, 125, 010 1. $10. 00 for movie tickets 2. $5 M Increase in defense expenditures X $45 for used economics textbook 4. Ford makes new $2 M factory X $20 K Toyota made and sold in Mexico X $10 K Profit from selling stocks 7. $15 K car made in US, sold in Canada 8. $10 K Tuition to attend college X $120 Social Security payment to Bob 10. Farmer purchases new $100 K tractor Copyright ACDC Leadership 2015 24
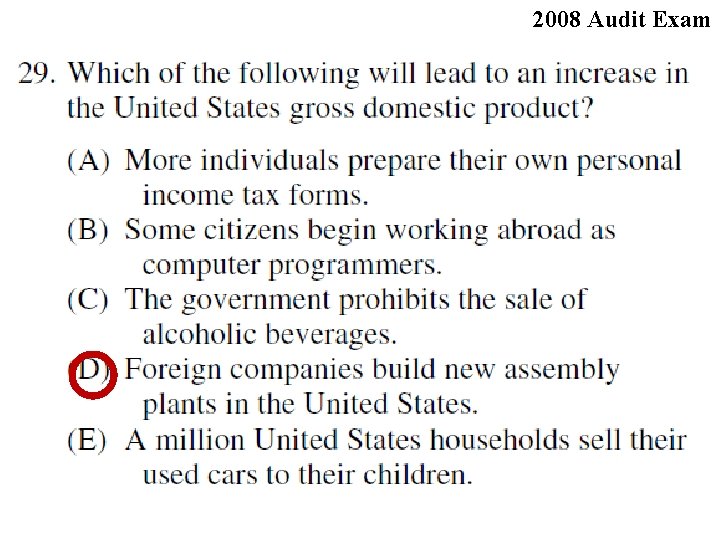
2008 Audit Exam
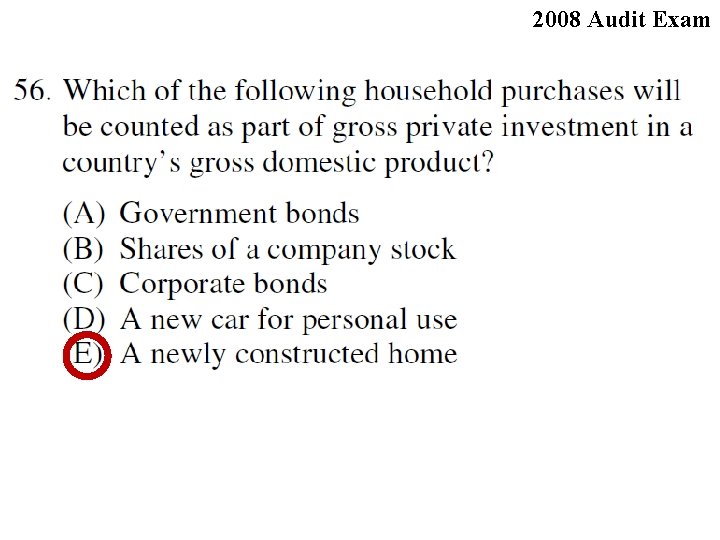
2008 Audit Exam
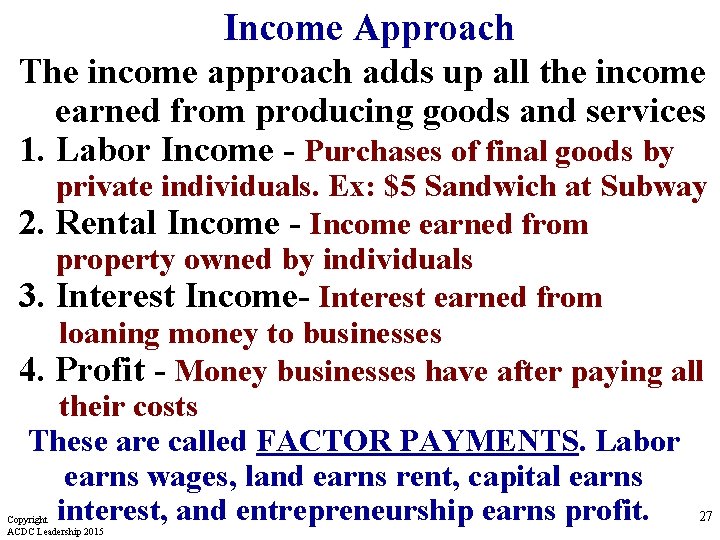
Income Approach The income approach adds up all the income earned from producing goods and services 1. Labor Income - Purchases of final goods by private individuals. Ex: $5 Sandwich at Subway 2. Rental Income - Income earned from property owned by individuals 3. Interest Income- Interest earned from loaning money to businesses 4. Profit - Money businesses have after paying all their costs These are called FACTOR PAYMENTS. Labor earns wages, land earns rent, capital earns interest, and entrepreneurship earns profit. 27 Copyright ACDC Leadership 2015
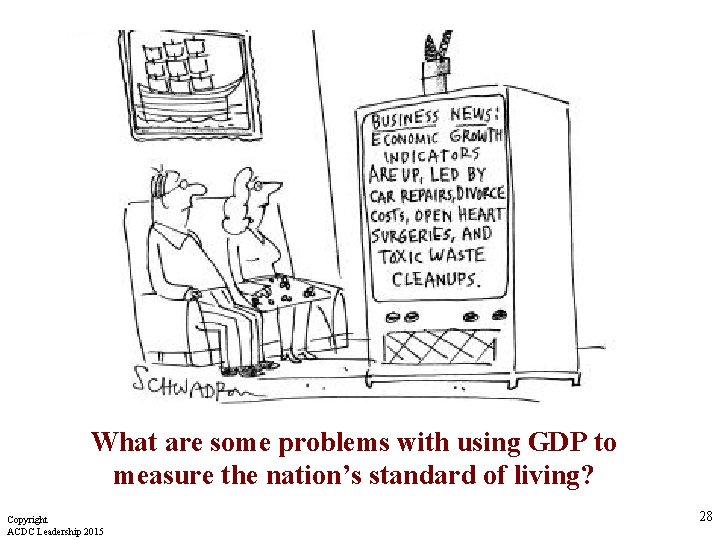
What are some problems with using GDP to measure the nation’s standard of living? Copyright ACDC Leadership 2015 28
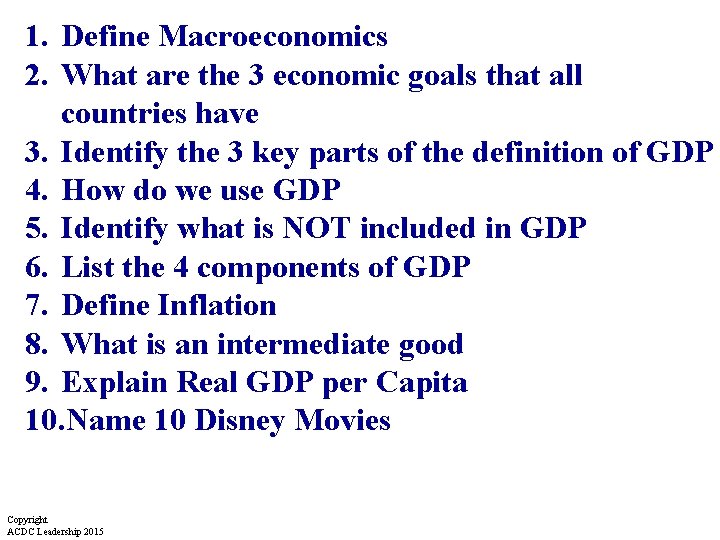
1. Define Macroeconomics 2. What are the 3 economic goals that all countries have 3. Identify the 3 key parts of the definition of GDP 4. How do we use GDP 5. Identify what is NOT included in GDP 6. List the 4 components of GDP 7. Define Inflation 8. What is an intermediate good 9. Explain Real GDP per Capita 10. Name 10 Disney Movies Copyright ACDC Leadership 2015
Video: Robert Kennedy GDP Speech 30
Nominal GDP vs. Real GDP 31
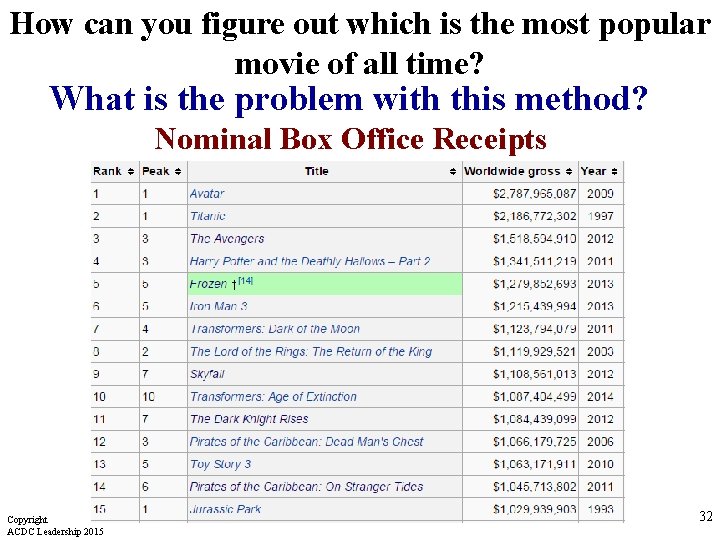
How can you figure out which is the most popular movie of all time? What is the problem with this method? Nominal Box Office Receipts Copyright ACDC Leadership 2015 32
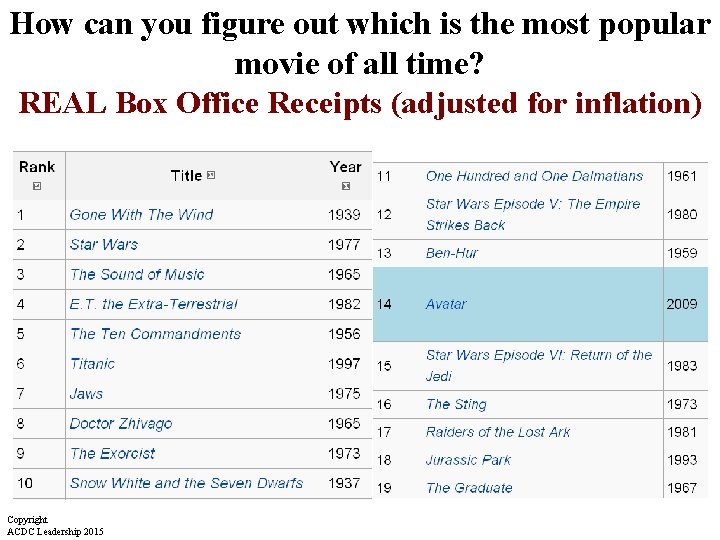
How can you figure out which is the most popular movie of all time? REAL Box Office Receipts (adjusted for inflation) Copyright ACDC Leadership 2015
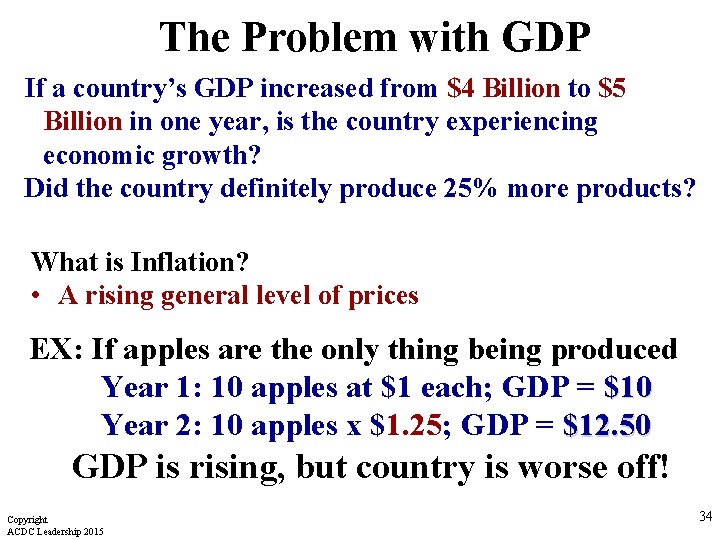
The Problem with GDP If a country’s GDP increased from $4 Billion to $5 Billion in one year, is the country experiencing economic growth? Did the country definitely produce 25% more products? What is Inflation? • A rising general level of prices EX: If apples are the only thing being produced Year 1: 10 apples at $1 each; GDP = $10 Year 2: 10 apples x $1. 25; GDP = $12. 50 GDP is rising, but country is worse off! Copyright ACDC Leadership 2015 34
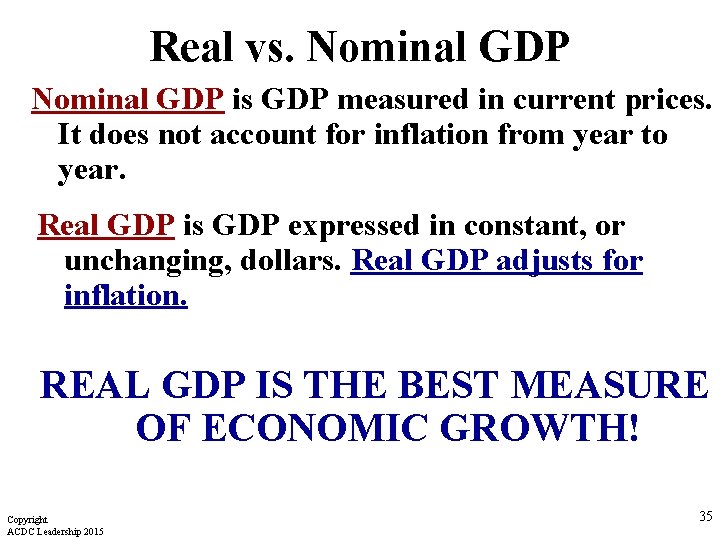
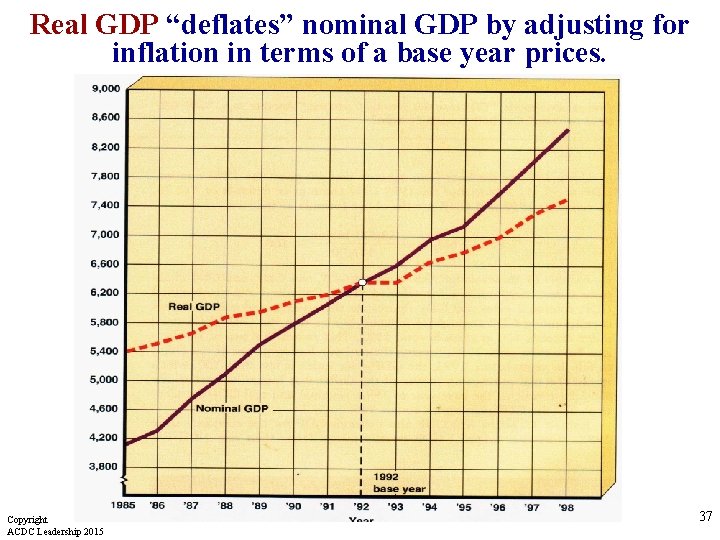
Real vs. Nominal GDP is GDP measured in current prices. It does not account for inflation from year to year. Real GDP is GDP expressed in constant, or unchanging, dollars. Real GDP adjusts for inflation. REAL GDP IS THE BEST MEASURE OF ECONOMIC GROWTH! Copyright ACDC Leadership 2015 35
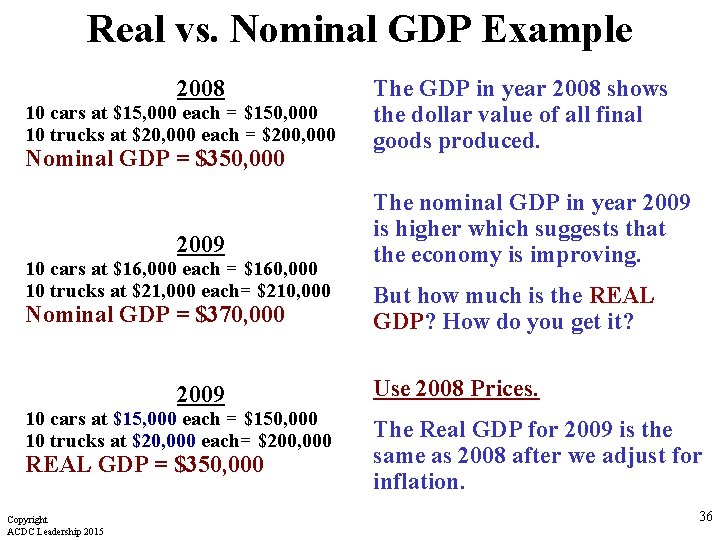
Real vs. Nominal GDP Example 2008 10 cars at $15, 000 each = $150, 000 10 trucks at $20, 000 each = $200, 000 Nominal GDP = $350, 000 2009 10 cars at $16, 000 each = $160, 000 10 trucks at $21, 000 each= $210, 000 Nominal GDP = $370, 000 2009 10 cars at $15, 000 each = $150, 000 10 trucks at $20, 000 each= $200, 000 REAL GDP = $350, 000 Copyright ACDC Leadership 2015 The GDP in year 2008 shows the dollar value of all final goods produced. The nominal GDP in year 2009 is higher which suggests that the economy is improving. But how much is the REAL GDP? How do you get it? Use 2008 Prices. The Real GDP for 2009 is the same as 2008 after we adjust for inflation. 36
Real GDP “deflates” nominal GDP by adjusting for inflation in terms of a base year prices. Copyright ACDC Leadership 2015 37
20012 Exam
Econmovies Episode 5: Cars
The Business Cycle 40
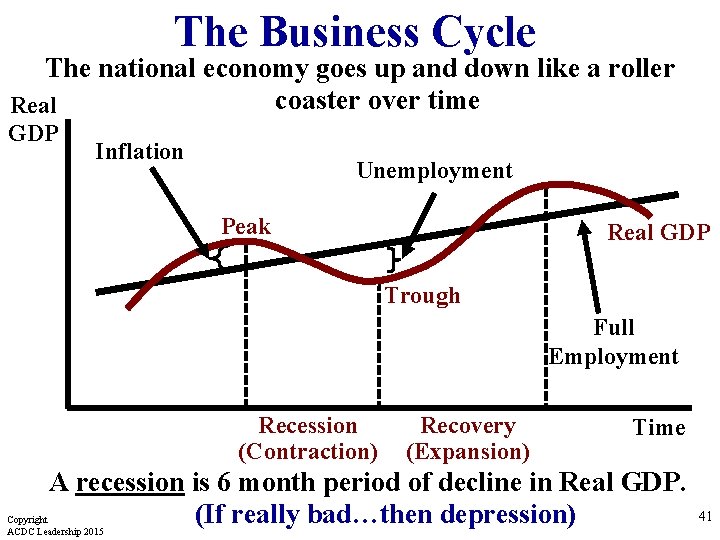
The Business Cycle The national economy goes up and down like a roller coaster over time Real GDP Inflation Unemployment Peak Real GDP Trough Full Employment Recession (Contraction) Recovery (Expansion) Time A recession is 6 month period of decline in Real GDP. (If really bad…then depression) Copyright ACDC Leadership 2015 41