LESSON 9 AGGREGATE PLANNING EXAMPLES Outline Examples Chase


 Suppose that a level strategy will be used without any overtime. What")


: Ending inventory in fall = actual production")
: Workers hired in summer = (production hours")


 Problem 2: Chase, no overtime, work hours not flexible Forecast Beginning")

: Actual production in fall = Number of")
 Problem 2: Chase, no overtime, work hours not flexible Hiring Cost")
 Self Study Problem 3: Chase, no overtime, flexible hours")
 Problem 4: Constant workforce, no overtime, no shortages Computation of the")
 • Problem 4 computation of number of workers required: Step 1:")
 • Problem 4 computation of number of workers required: Number of")
 Problem 4: Constant workforce, no overtime, no shortages Forecast Beginning Actual")
 Self Study Problem 5: Constant 36 workers, no overtime, shortages allowed")
 Self Study Problem 5: Constant 36 workers, no overtime, shortages allowed")
 Self Study Problem 6: Constant 37 workers, overtime to prevent shortages")
 Self Study Problem 6: Constant 37 workers, overtime to prevent shortages")

- Slides: 30
LESSON 9: AGGREGATE PLANNING EXAMPLES Outline • Examples – Chase Strategy – Level Strategy – Optimization
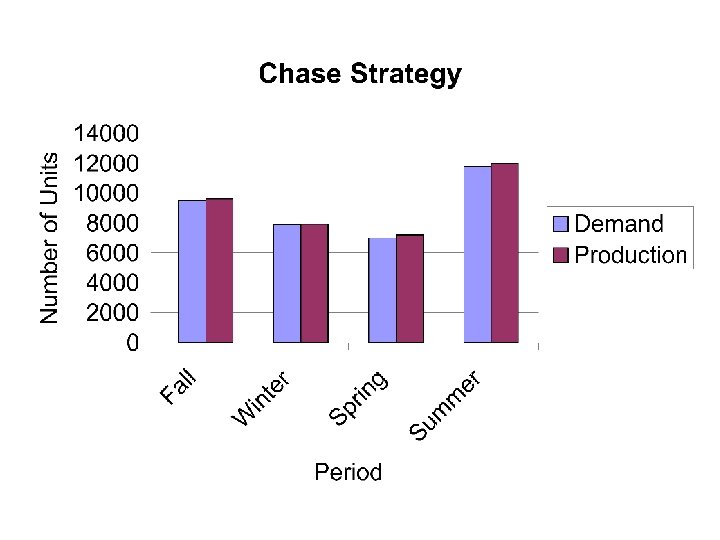
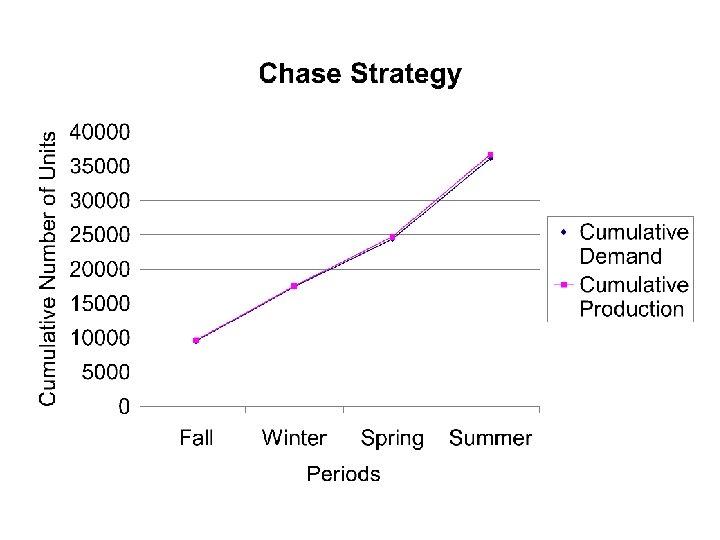
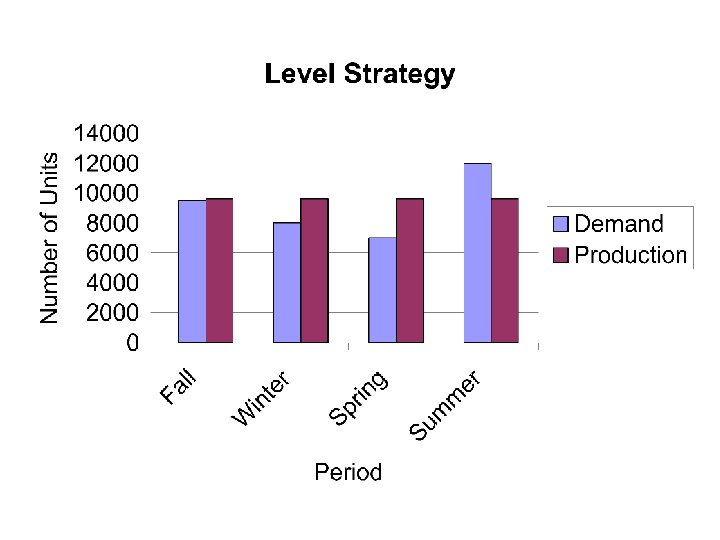
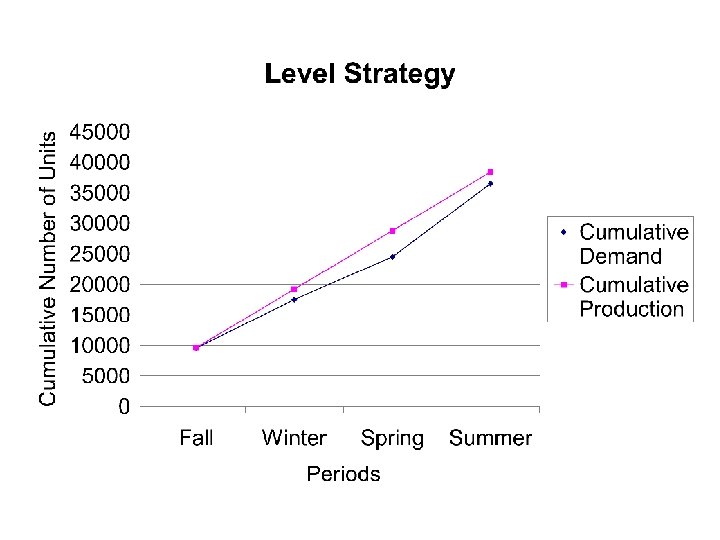
Two Simple Strategies • Chase strategy – Produce as much as needed – Zero inventory, no holding cost, no shortages – Zero inventory is difficult to achieve because work hours may not be flexible – Low inventory costs, high smoothing costs • Level strategy – Produce a constant amount each period – Stable workforce, no hiring/firing, no overtime, – no subcontract – Low smoothing costs, high inventory costs
Optimization • The chase and level strategies are two extreme strategies. Chase strategy minimizes inventory costs and level strategy minimizes smoothing costs. The goal of optimization is to identify a production plan that minimizes the total inventory and smoothing costs. This can be done using linear programming. • Lesson 10 discusses the application of linear programming using Excel Solver.
Example • Develop a production plan and calculate the annual cost for a firm whose demand forecast is fall, 10, 000; winter, 8, 000; spring 7, 000; summer, 12, 000. Inventory at the beginning of fall is 500 units. At the beginning of fall you currently have 30 workers, but you plan to hire temporary workers at the beginning of summer and lay them off at the end of summer. In addition, you have negotiated with the union an option to use the regular workforce on overtime during winter or spring if the overtime is necessary to prevent stock-outs at the end of those quarters. Overtime is not available during fall. (Continued. . . )
Example Relevant costs are: hiring, $100 for each temp; layoff, $200 for each worker laid off; inventory holding, $5 per unitquarter; backorder, $10 per unit; straight time, $5 per hour; overtime $8 per hour. Assume that the productivity is 0. 5 units per worker hour, with eight hours per day and 60 days per season. • Develop a production plan using (1) all the constraints as stated (2) chase strategy, no overtime, work hours not flexible (3) chase strategy, no overtime, flexible hours (self study)
Example (4) Suppose that a level strategy will be used without any overtime. What is the minimum number of workers required to avoid shortages? Develop a production plan using the minimum number of workers required to avoid shortages. (5) Assuming that the shortages are allowed and that 6 new workers will be hired in the beginning of the fall term develop a production plan using level strategy and no overtime (self study) (6) Assuming that the overtime will be used in fall and winter to prevent shortages and that 7 new workers will be hired in the beginning of the fall term, develop a production plan using level strategy with overtime (self study)
Example Problem 1: The original problem Forecast Fall Winter Spring Summer 10000 8000 7000 12000 Overtime Hours Beginning Production Inventory Required Hours Required Available 500 Workers Hired Workers Fired Actual Production Ending Inventory
Example • Problem 1 sample computation: Production required in fall = forecast in fall - beginning inventory in fall = 10, 000 - 500 = 9, 500 Production hours required in fall = production required in fall / productivity in units per worker = 9, 500 / 0. 50 = 19, 000 hours Production hours available in fall = 30 workers 60 days per season 8 hours per day = 14, 400 hours Overtime and temporary workers are not available in fall Actual production in fall = production hours available in fall productivity in units per worker = 14, 400 0. 50 = 7, 200 units
Example • Problem 1 sample computation (continued): Ending inventory in fall = actual production in fall - production required in fall = 7, 200 - 9, 500 = -2, 300 units Beginning inventory in winter = ending inventory in fall = -2, 300 units Overtime hours required in winter = production hours required - production hours available = 20, 600 - 14, 400 = 6, 200 hours Actual production in winter = (production hours available in winter + overtime hours in winter) productivity in units per worker = (14, 400+6, 200) 0. 50 = 10, 300 units
Example • Problem 1 sample computation (continued): Workers hired in summer = (production hours required in summer - production hours available in summer) / number of working hours per worker in summer [Note: the result should be rounded up, the number of workers is an integer and enough workers should be hired to avoid shortages] = (23, 600 -14, 400)/(60 days per season 8 hours per day) = 19. 167 rounded up to 20 Note: Actual production in summer is 11, 800 units, as much as required. The assumption is that temporary workers will not work for full 480 hours, but only as much as needed. So, they can be stopped after producing 11, 800 units.
Example Problem 1: The original problem Backorder Cost Overtime Cost Hiring Cost Fall Winter Spring Summer Inventory Straighttime H. Cost Fall Winter Spring Summer Total cost Total Cost Firing Cost
Example • Problem 1 sample computation: Straighttime cost in summer = actual production hours $5 per hour = 23, 600 hour 5 per hour = $118, 000 Note: the actual production hour in summer is the same as production hours required in summer because sufficient number of temporary worker are hired and the temporary workers can be stopped after producing the required amount of products.
Example (Chase Strategy) Problem 2: Chase, no overtime, work hours not flexible Forecast Beginning Net Production Workers Inventory Production Hours Required Fall Winter Spring Summer 10000 8000 7000 12000 Workers Hired 500 Workers Fired Actual Production Ending Inventory
Example • Problem 2 sample computation: Workers required in fall = production hours required in fall / number of working hours per worker in fall [Note: the result should be rounded up, the number of workers is an integer and enough workers should be hired to avoid shortages] = 19, 000/ (60 days per season 8 hours per day) = 39. 583 rounded up to 40 Number of workers hired in fall = Number of workers required in fall - number of workers available in the beginning of fall = 40 - 30 = 10
Example • Problem 2 sample computation (continued): Actual production in fall = Number of workers available in fall 60 days per season 8 hours per day 0. 5 units per worker per hour = 40 60 8 0. 50 = 9, 600 units Ending inventory in fall = actual production in fall production required in fall = 9, 600 --9, 500 = 100 units Beginning inventory in winter = ending inventory in fall = 10 units Number of workers fired in winter = Number of workers available in the beginning of winter - number of workers required in winter = 40 - 33 = 7.
Example (Chase Strategy) Problem 2: Chase, no overtime, work hours not flexible Hiring Cost Fall Winter Spring Summer Total Firing Cost Straight time Cost Inventory Holding Cost Total Cost
Example (Chase Strategy) Self Study Problem 3: Chase, no overtime, flexible hours
Example (Level Strategy) Problem 4: Constant workforce, no overtime, no shortages Computation of the workforce required for avoiding shortages Net Cumulative Workers Production Net units Required Requirement Production produced Requirement per worker Fall 9500 Winter 8000 Spring 7000 Summer 12000 Workers hired Workers fired Total workers Initial hiring cost Initial firing cost Straighttime cost
Example (Level Strategy) • Problem 4 computation of number of workers required: Step 1: For each period compute the cumulative net production requirement Step 2: For each period compute the cumulative units produced per worker Step 3: For each period compute the number of workers required to meet the cumulative demand upto that period by dividing the cumulative net production by the cumulative units produced and rounding up.
Example (Level Strategy) • Problem 4 computation of number of workers required: Number of workers required to meet the cumulative demand upto Fall Winter Spring Summer Step 4: The number of workers required is the maximum of all the numbers obtained in Step 3 Number of workers required = max ( )=
Example (Level Strategy) Problem 4: Constant workforce, no overtime, no shortages Forecast Beginning Actual Ending Inventory Production Inventory Fall Winter Spring Summer 10000 500 8000 7000 12000 Inventory Backorder Cost Fall Winter Spring Summer Total cost Total Cost
Example (Level Strategy) Self Study Problem 5: Constant 36 workers, no overtime, shortages allowed
Example (Level Strategy) Self Study Problem 5: Constant 36 workers, no overtime, shortages allowed
Example (Level Strategy) Self Study Problem 6: Constant 37 workers, overtime to prevent shortages
Example (Level Strategy) Self Study Problem 6: Constant 37 workers, overtime to prevent shortages
READING AND EXERCISES Lesson 9 Reading: Section 3. 4, pp. 121 -127 (4 th Ed. ), pp. 117 -125 (5 th Ed. ) Exercises: 9, 13 and 14, pp. 127 -129 (4 th Ed. ), pp. 123124 (5 th Ed. ) Lesson 10 Reading: Section 3. 5 -3. 6, pp. 129 -138 (4 th Ed. ), pp. 125135 (5 th Ed. ) Exercises: 17, 19 and 20, pp. 138 -139 (4 th Ed. ), pp. 133134 (5 th Ed. )