Chapter 8 Aggregate Planning in the Supply Chain


 u. Inventory u.")


 Wt = Workforce size for")
 Copyright © 2010 Pearson Education,")
 u. Workforce size for")
 u. Production for each month cannot exceed")
 u. Inventory balance for each month Copyright")
 u. Over time for each month Copyright")
 u. Overtime cost drops")


 Discount from $40 to $39 Cost = $421, 915, Revenue = $643,")
 Discount from $40 to $39 Cost = $438, 857, Revenue = $650,")
 Off-peak discount: Cost")
 Discount: 100% Increase in Consumption, Sale Price = $40 ($39) Peak discount:")


- Slides: 43
Chapter 8 Aggregate Planning in the Supply Chain Copyright © 2010 Pearson Education, Inc. Publishing as Prentice Hall. 8 -1
Outline u. Role of aggregate planning in a supply chain u. The aggregate planning problem u. Aggregate planning strategies u. Aggregate planning with Linear Programming u. Implementing aggregate planning in practice 8 -2
Planning Horizon Long Range Medium Range Short Range 1 to 10 years 6 to 18 months 1 to 10 weeks Strategic What is our business? Aggregate Planning Tactical/Operational Production schedule for a product group for specific products, detailed scheduling. u. Production level Capital investments u. Labour force level (new factories, new u. Inventory level machines, etc. ) (Production capacity fixed)
Role of Aggregate Planning in a Supply Chain u Capacity has a cost, lead times are greater than zero u Aggregate planning: Match workforce and materials to available equipment so as to meet projected demand at low cost. – determines levels of capacity, production, subcontracting, inventory, stockouts, and pricing over a specified time horizon – goal is to maximize profit – decisions made at a product family (not SKU) level – time frame of 3 to 18 months – how can a firm best use the facilities it has? First alert in marshalling resources! 8 -4
Aggregate Planning Decisions u. Specify operational parameters over the time horizon: – – – – production rate workforce overtime machine capacity usage subcontracting backlog inventory on hand Plant capacity fixed; Adjust: labour, materials, utilisation. u. All supply chain stages should work together on an aggregate plan that will optimize supply chain performance 8 -5
The Aggregate Planning Problem u. Given the demand forecast for each period in the planning horizon, determine the production level, inventory level, capacity level and the labour (type and level) for each period that maximizes the firm’s (supply chain’s) profit over the planning horizon u. Specify the planning horizon (typically 3 -18 months) u. Specify the duration of each period u. Specify key information required to develop an aggregate plan Copyright © 2010 Pearson Education, Inc. Publishing as Prentice Hall. 8 -6
Information Needed for an Aggregate Plan u. Demand forecast in each period u. Production costs – labor costs, regular time ($/hr) and overtime ($/hr) – subcontracting costs ($/hr or $/unit) – cost of changing capacity: hiring or layoff ($/worker) and cost of adding or reducing machine capacity ($/machine) u. Labor/machine hours required per unit u. Inventory holding cost ($/unit/period) u. Stockout or backlog cost ($/unit/period) u. Constraints: limits on overtime, layoffs, capital available, stockouts and backlogs Copyright © 2010 Pearson Education, Inc. Publishing as Prentice Hall. 8 -7
Outputs of Aggregate Plan u. Production quantity from regular time, overtime, and subcontracted time: used to determine number of workers and supplier purchase levels u. Inventory held: used to determine how much warehouse space and working capital is needed u. Backlog/stockout quantity: used to determine what customer service levels will be u. Machine capacity increase/decrease: used to determine if new production equipment needs to be purchased u. A poor aggregate plan can result in lost sales, lost profits, excess inventory, or excess capacity Copyright © 2010 Pearson Education, Inc. Publishing as Prentice Hall. 8 -8
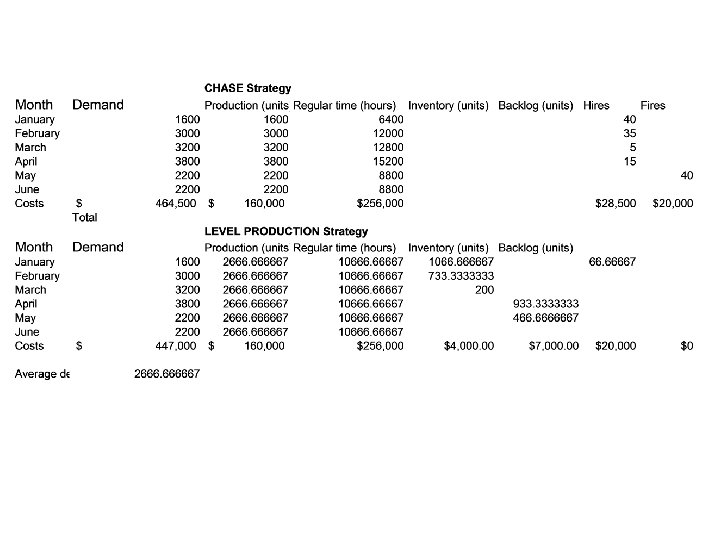
Aggregate Planning Strategies u. Trade-off between capacity, inventory, backlog/lost sales u. Chase strategy – using capacity as the lever u. Time flexibility from workforce or capacity strategy – using utilization as the lever u. Level strategy – using inventory as the lever u. Mixed strategy – a combination of one or more of the first three strategies Copyright © 2010 Pearson Education, Inc. Publishing as Prentice Hall. 8 -9
Chase Strategy u. Production rate is synchronized with demand by varying machine capacity or hiring and laying off workers as the demand rate varies u. However, in practice, it is often difficult to vary capacity and workforce on short notice u. Expensive if cost of varying capacity is high u. Negative effect on workforce morale u. Results in low levels of inventory u. Should be used when inventory holding costs are high and costs of changing capacity are low Copyright © 2010 Pearson Education, Inc. Publishing as Prentice Hall. 8 -10
Time Flexibility Strategy u. Can be used if there is excess machine capacity u. Workforce is kept stable, but the number of hours worked is varied over time to synchronize production and demand u. Can use overtime or a flexible work schedule u. Requires flexible workforce, but avoids morale problems of the chase strategy u. Low levels of inventory, lower utilization u. Should be used when inventory holding costs are high and capacity is relatively inexpensive Copyright © 2010 Pearson Education, Inc. Publishing as Prentice Hall. 8 -11
Level Strategy u. Maintain stable machine capacity and workforce levels with a constant output rate u. Shortages and surpluses result in fluctuations in inventory levels over time u. Inventories that are built up in anticipation of future demand or backlogs are carried over from high to low demand periods u. Better for worker morale u. Large inventories and backlogs may accumulate u. Should be used when inventory holding and backlog costs are relatively low Copyright © 2010 Pearson Education, Inc. Publishing as Prentice Hall. 8 -12
Fundamental Tradeoffs in Aggregate Planning u. Capacity (regular time, overtime, subcontract) u. Inventory u. Backlog / lost sales Basic Strategies u. Chase strategy u. Time flexibility from workforce or capacity u. Level strategy Copyright © 2010 Pearson Education, Inc. Publishing as Prentice Hall. 8 -13
Aggregate Planning at Red Tomato Tools Copyright © 2010 Pearson Education, Inc. Publishing as Prentice Hall. 8 -14
Aggregate Planning at Red Tomato Tools Copyright © 2010 Pearson Education, Inc. Publishing as Prentice Hall. 8 -15
Aggregate Planning Strategies u. For level production, inventory buildup and backlogs can be reduced by “starting” the cycle differently u. Adjusting production rate – Overtime and “furlough” – Subcontract (instead of hire-and-fire) u. Mixed strategies – Linear programming!
Summary of Learning Objectives u. What types of decisions are best solved by aggregate planning? u. What is the importance of aggregate planning as a supply chain activity? u. What kinds of information are needed to produce an aggregate plan? u. What are the basic trade-offs a manager makes to produce an aggregate plan? u. How are aggregate planning problems formulated and solved using Microsoft Excel? Copyright © 2010 Pearson Education, Inc. Publishing as Prentice Hall. 8 -18
Aggregate Planning in Excel u. Construct a table with the decision variables u. Construct a table for constraints u. Create a cell containing the objective function u. Use Data Analysis Solver Copyright © 2010 Pearson Education, Inc. Publishing as Prentice Hall. 8 -19
Aggregate Planning at Red Tomato Tools (Define Decision Variables) Wt = Workforce size for month t, t = 1, . . . , 6 Ht = Number of employees hired at the beginning of month t, t = 1, . . . , 6 Lt = Number of employees laid off at the beginning of month t, t = 1, . . . , 6 Pt = Production in month t, t = 1, . . . , 6 It = Inventory at the end of month t, t = 1, . . . , 6 St = Number of units stocked out at the end of month t, t = 1, . . . , 6 Ct = Number of units subcontracted for month t, t = 1, . . . , 6 Ot = Number of overtime hours worked in month t, t = 1, . . . , 6 Copyright © 2010 Pearson Education, Inc. Publishing as Prentice Hall. 8 -20
Aggregate Planning at Red Tomato Tools (Define Objective Function) Copyright © 2010 Pearson Education, Inc. Publishing as Prentice Hall. 8 -21
Aggregate Planning at Red Tomato tools (Define Constraints Linking Variables) u. Workforce size for each month is based on hiring and layoffs Copyright © 2010 Pearson Education, Inc. Publishing as Prentice Hall. 8 -22
Aggregate Planning at Red Tomato Tools (Constraints) u. Production for each month cannot exceed capacity Copyright © 2010 Pearson Education, Inc. Publishing as Prentice Hall. 8 -23
Aggregate Planning at Red Tomato Tools (Constraints) u. Inventory balance for each month Copyright © 2010 Pearson Education, Inc. Publishing as Prentice Hall. 8 -24
Aggregate Planning at Red Tomato Tools (Constraints) u. Over time for each month Copyright © 2010 Pearson Education, Inc. Publishing as Prentice Hall. 8 -25
Scenarios u. Increase in holding cost (from $2 to $6) u. Overtime cost drops to $4. 1 per hour u. Increased demand fluctuation Copyright © 2010 Pearson Education, Inc. Publishing as Prentice Hall. 8 -26
Increased Demand Fluctuation Copyright © 2010 Pearson Education, Inc. Publishing as Prentice Hall. 8 -27
Aggregate Planning in Practice u. Think beyond the enterprise to the entire supply chain u. Make plans flexible because forecasts are always wrong u. Rerun the aggregate plan as new information emerges u. Use aggregate planning as capacity utilization increases Copyright © 2010 Pearson Education, Inc. Publishing as Prentice Hall. 8 -28
Chapter 9 Sales and Operations Planning Copyright © 2010 Pearson Education, Inc. Publishing as Prentice Hall. 9 -29
Outline u. Responding to predictable variability in a supply chain u. Managing supply u. Managing demand u. Implementing solutions – Sales and Operations Planning - to predictable variability in practice Copyright © 2010 Pearson Education, Inc. Publishing as Prentice Hall. 9 -30
Responding to Predictable Variability in a Supply Chain u. Predictable variability is change in demand that can be forecasted u. Can cause increased costs and decreased responsiveness in the supply chain u. A firm can handle predictable variability using two broad approaches: – Manage supply using capacity, inventory, subcontracting, and backlogs – Manage demand using short-term price discounts and trade promotions Copyright © 2010 Pearson Education, Inc. Publishing as Prentice Hall. 9 -31
Managing Supply u. Managing capacity – – – Time flexibility from workforce Use of seasonal workforce Use of subcontracting Use of dual facilities – dedicated and flexible Designing product flexibility into production processes u. Managing inventory – Using common components across multiple products – Building inventory of high demand or predictable demand products Copyright © 2010 Pearson Education, Inc. Publishing as Prentice Hall. 9 -32
Inventory/Capacity Trade-off u. Leveling capacity forces inventory to build up in anticipation of seasonal variation in demand u. Carrying low levels of inventory requires capacity to vary with seasonal variation in demand or enough capacity to cover peak demand during season Copyright © 2010 Pearson Education, Inc. Publishing as Prentice Hall. 9 -33
Managing Demand u. Promotion u. Pricing u. Timing of promotion and pricing changes is important u. Demand increases can result from a combination of three factors: – Market growth (increased sales, increased market size) – Stealing share (increased sales, same market size) – Forward buying (same sales, same market size) Copyright © 2010 Pearson Education, Inc. Publishing as Prentice Hall. 9 -34
Demand Management u. Pricing and aggregate planning must be done jointly u. Factors affecting discount timing – Product margin: Impact of higher margin ($40 instead of $31) – Consumption: Changing fraction of increase coming from forward buy (100% increase in consumption instead of 10% increase) – Forward buy Copyright © 2010 Pearson Education, Inc. Publishing as Prentice Hall. 9 -35
Red Tomato Tools u. Planning example Copyright © 2010 Pearson Education, Inc. Publishing as Prentice Hall. 9 -36
Off-Peak (January) Discount from $40 to $39 Cost = $421, 915, Revenue = $643, 400, Profit = $221, 485 Copyright © 2010 Pearson Education, Inc. Publishing as Prentice Hall. 9 -37
Peak (April) Discount from $40 to $39 Cost = $438, 857, Revenue = $650, 140, Profit = $211, 283 Copyright © 2010 Pearson Education, Inc. Publishing as Prentice Hall. 9 -38
January Discount: 100% Increase in Consumption, Sale Price = $40 ($39) Off-peak discount: Cost = $456, 750, Revenue = $699, 560 Copyright © 2010 Pearson Education, Inc. Publishing as Prentice Hall. 9 -39
Peak (April) Discount: 100% Increase in Consumption, Sale Price = $40 ($39) Peak discount: Cost = $536, 200, Revenue = $783, 520 Copyright © 2010 Pearson Education, Inc. Publishing as Prentice Hall. 9 -40
Performance Under Different Scenarios Copyright © 2010 Pearson Education, Inc. Publishing as Prentice Hall. 9 -41
Implementing Solutions to Predictable Variability in Practice u. Coordinate planning across enterprises in the supply chain u. Take predictable variability into account when making strategic decisions u. Preempt, do not just react to, predictable variability Copyright © 2010 Pearson Education, Inc. Publishing as Prentice Hall. 9 -42
Summary of Learning Objectives u. How can supply be managed to improve synchronization in the supply chain in the face of predictable variability? u. How can demand be managed to improve synchronization in the supply chain in the face of predictable variability? u. How can sales and operations planning be used to maximize profitability when faced with predictable variability in the supply chain? Copyright © 2010 Pearson Education, Inc. Publishing as Prentice Hall. 9 -43