Keratin Waste Products A Critical Look at the


- Slides: 23

Keratin Waste Products - A Critical Look at the Benefits of Properly Processing this Undervalued Source of Protein into Valuable Feather Meal Guillaume Pfeuti & Dominique P. Bureau Fish Nutrition Research Laboratory Dept. of Animal Biosciences University of Guelph gpfeuti@uoguelph. ca

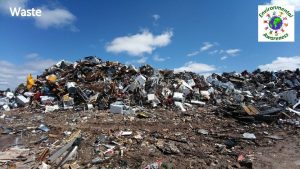
Chicken, Feather, and Fe. M Production • 8. 3 billion chickens raised and processed in the USA in 2013 • 23. 2 million tons of live weight • 5 to 7% of chicken body weight consist of feathers • ~1. 4 million tons of feathers co-products generated in the USA • 617 thousand tons recycled into feather meal • A fraction of the amount recycled for feather meal is used for textiles and composites • ~700 thousand tons of raw feathers incinerated and buried in landfills in the USA only A great amount of potential dietary protein is disposed of globally

Feather Meal • 75 -85% Crude Protein • Rich in: • Arginine (5. 8%) • Cystine (3. 8%) • Isoleucine (4. 2%) • Leucine (6. 9%) • Phenylalanine (4. 1%) • Threonine (3. 9%) • Poor in: • Histidine: (0. 7%) • Lysine: (1. 8%) • Tryptophan: (0. 55%) • Cost-effective (~700$/ton) High variability in nutritional value!!!

Price of Feed Ingredients Fishmeal Poultry Meal Corn gluten Meal Blood Meal Soybean Meal Canola Meal Meat and Bone Meal Feather Meal Crude Protein % $/MT 63 65 60 90 48 38 55 80 2000 820 750 900 450 350 475 700 Price $/ MT of Crude Protein 2860 1250 1000 990 920 910 875

Variability of Digestibility Author Cho et al. (1982) Cho and Kaushik (1990) Bureau et al. (1999) Cheng et al. (2004) Gaylord et al. (2008) Glencross (2011) Apparent Digestibility (%) DM CP GE 75 58 70 81 77 77 79 81 76 80 81 80 82 81 83 84 87 80 80 77 77 87 88 59 93 85

Variability of raw materials

Variability processing equipment Batch Pressure Cooker Disc Dryer Continuous Pressure Cooker Flash Dryer Ring Dryer

Steam-hydrolysis of keratin Disulphide Bond S S H Hydrogen Bond O O H Cysteine level dropping from 7% in raw feathers to 4% in Fe. M Peptide Bond

Amino Acid Cross-linking

Racemization of Amino Acids

Optimal Processing of Fe. M It is all about finding the sweet spot Under processing Over Processing → High level of keratin → High level of disulphide bonds → High level of D-amino acids High level of thiols ← High level of cross-linked AA ← High level of D-amino acids ← Optimal processing = Optimal Bioavailability

Current Quality Assessment Tool According to AFFCO (Association of America Feed Control Officials) HCl-Pepsin digestibility 0. 2% Pepsin • 0. 075 M HCL (p. H 2) • 45°C • 16 hours → A pepsin digestibility > 75% is considered the “standard” to indicate proper hydrolysis ØOfficial test adopted by the Association of Official Analytical Chemists (AOAC) in 1960. ØNo relationship between in vitro and in vivo digestibility of CP in Fe. M (Papadopoulous et al. , 1987)

HCl-Pepsin Digestibility Test Native, undamaged protein Easily hydrolysable soluble peptides Damaged protein Absorbable/soluble cross-links without nutritive value Water-soluble peptides, measured as “digestible” Indigestible cross-linked protein

Feather Meal: Effectiveness of a Simple Chemical Pre. Treatment Pre-treatment of 2 commercial feather meals (Fe. M) • 2% sodium sulfite (%Fe. M w/w) • 0. 05% Protease (%Fe. M w/w) • 200% water (%Fe. M w/w) • 24 h incubation

Pre-Treatment of Steam-hydrolyzed Feather Meals 1 - Sulfitolysis using sodium sulfite (Na 2 SO 3) Cystine + Sulfite Bunte Salt + Cysteine 2 - Proteolysis using a commercial protease

Results: Digestibility of Ingredients Fe. M 1 PTFe. M 1 Fe. M 2 PTFe. M 2 78. 3 b 85. 4 b 78. 3 b 87. 7 ab 94. 7 a 87. 2 ab 86. 9 ab 81. 9 b 86. 0 ab 93. 2 a 95. 5 a 94. 4 a 86. 3 b 53. 6 b 86. 0 b 82. 3 b 74. 1 b 73. 3 b 83. 0 b 80. 1 b 84. 3 b 95. 6 a 102. 5 a 94. 2 a 96. 1 a 96. 9 ab 87. 0 ab 96. 4 a 91. 0 a 95. 3 a 84. 9 b 72. 8 ab 87. 9 b 84. 9 b 87. 5 ab 88. 1 a 85. 1 b 79. 2 b 86. 0 b 95. 3 a 114. 8 a 96. 5 a 99. 4 a 105. 1 a 93. 2 a 99. 0 a 91. 9 a 96. 2 a Non-essential amino acids and lanthionine (%) Alanine 81. 3 b Aspartic acid 80. 4 c Cyst(e)ine 78. 8 b Glutamic acid 82. 8 b Glycine 87. 9 b Proline 85. 8 bc Serine 86. 9 b Lanthionine 79. 8 b 96. 8 a 92. 9 ab 86. 5 a 93. 0 a 96. 6 a 94. 2 a 95. 0 a 84. 6 a 84. 0 b 84. 7 bc 75. 4 b 84. 8 b 88. 1 b 83. 0 c 84. 0 b 66. 6 c 99. 9 a 97. 9 a 84. 8 a 95. 6 a 96. 0 a 90. 4 ab 94. 1 a 76. 8 b Proximate composition (a) Dry matter (%) Crude protein (%) Gross energy (k. J g-1)1 Essential amino acids (%) Arginine Histidine Isoleucine Lysine Methionine Phenylalanine Threonine Valine

Results: Digestibility of Ingredients Fe. M 1 PTFe. M 1 Fe. M 2 PTFe. M 2 78. 3 b 85. 4 b 78. 3 b 87. 7 ab 94. 7 a 87. 2 ab 86. 9 ab 81. 9 b 86. 0 ab 93. 2 a 95. 5 a 94. 4 a 86. 3 b 53. 6 b 86. 0 b 82. 3 b 74. 1 b 73. 3 b 83. 0 b 80. 1 b 84. 3 b 95. 6 a 102. 5 a 94. 2 a 96. 1 a 96. 9 ab 87. 0 ab 96. 4 a 91. 0 a 95. 3 a 84. 9 b 72. 8 ab 87. 9 b 84. 9 b 87. 5 ab 88. 1 a 85. 1 b 79. 2 b 86. 0 b 95. 3 a 114. 8 a 96. 5 a 99. 4 a 105. 1 a 93. 2 a 99. 0 a 91. 9 a 96. 2 a Non-essential amino acids and lanthionine (%) Alanine 81. 3 b Aspartic acid 80. 4 c Cyst(e)ine 78. 8 b Glutamic acid 82. 8 b Glycine 87. 9 b Proline 85. 8 bc Serine 86. 9 b Lanthionine 79. 8 b 96. 8 a 92. 9 ab 86. 5 a 93. 0 a 96. 6 a 94. 2 a 95. 0 a 84. 6 a 84. 0 b 84. 7 bc 75. 4 b 84. 8 b 88. 1 b 83. 0 c 84. 0 b 66. 6 c 99. 9 a 97. 9 a 84. 8 a 95. 6 a 96. 0 a 90. 4 ab 94. 1 a 76. 8 b Proximate composition (a) Dry matter (%) Crude protein (%) Gross energy (k. J g-1)1 Essential amino acids (%) Arginine Histidine Isoleucine Lysine Methionine Phenylalanine Threonine Valine

Slope-Ratio assay to assess the bioavailability of pre-treated feather meals

Objective 2 : Arginine Bio-Availability trial Ingredients 1 2 3 4 5 6 7 8 9 10 11 Arginine Level 1. 20 1. 35 1. 50 0. 15 0. 30 10 20 L- Arginine Feather meal 1– Original Feather meal 1– Treated Feather meal 2– Original Feather meal 2– Treated

Growth Trial: Results Dietary Arginine vs. TGC (Growth Rate) 0. 290 a 0. 270 a TGC (%) 0. 250 ab bc bc ab Arg Dig. = 95% 0. 230 bc Arg Dig. = 86% L-Arg 0. 210 c Fe. M 1 cd Arg Dig. = 96% PTFe. M 1 0. 190 Fe. M 2 d Arg Dig. = 86% PTFe. M 2 0. 170 1. 20 1. 35 Dietary Arginine (%) 1. 50

Cross-Linked Amino Acids Levels May be Inversely Correlated with Amino Acid Bioavailability Ingredients Fe. M 1 Proximate composition (as is) Dry matter (%) 93. 4 Crude protein (%) 81. 9 Lipid (%) 8. 3 Total carbohydrates (%) 1 1. 3 Ash (%) 1. 9 -1 1 Gross energy (k. J g ) 22. 6 Essential amino acids (% as is) Arginine 5. 9 Histidine 0. 6 Isoleucine 4. 0 Leucine 6. 7 Lysine 1. 8 Methionine 0. 5 Phenylalanine 4. 0 Threonine 3. 9 Valine 6. 0 Non-essential amino acids (% as is) Alanine 3. 8 Asparatic acid 5. 6 Cyst(e)ine 3. 5 Glutamic acid 9. 2 Glycine 6. 5 Proline 8. 3 Serine 9. 3 Cross-linked amino acids (% as is) Lanthionine 3. 18 DL-Lysinoalanine 0. 16 Β-aminoalanine 0. 14 PTFe. M 1 Fe. M 2 PTFe. M 2 93. 3 80. 3 7. 9 1. 3 3. 8 22. 1 86. 6 76. 3 6. 5 1. 5 2. 3 20. 7 93. 1 81. 7 6. 5 0. 6 4. 3 21. 8 5. 7 0. 6 3. 9 6. 5 1. 8 0. 5 3. 9 3. 8 5. 7 0. 7 3. 5 6. 2 2. 2 0. 6 3. 4 3. 8 5. 1 6. 1 0. 8 3. 8 6. 6 2. 3 0. 6 3. 6 4. 0 5. 6 3. 7 5. 5 3. 6 9. 0 6. 3 7. 8 8. 8 3. 6 5. 5 4. 1 9. 7 5. 8 6. 8 8. 1 3. 8 5. 8 4. 3 10. 1 6. 2 7. 3 8. 4 3. 17 0. 15 0. 13 2. 55 0. 06 0. 05 2. 80 0. 07 0. 06

Take-home Message • The pre-treatment significantly improves the digestibility of amino acids and the bioavailability of arginine in Fe. Ms. • Digestibility of CP and amino acids in feed ingredients is influenced by disulphide bond levels. • Disulphide bonds and cross-linked amino acids may be indicators of digestibility of CP and amino acids in feed ingredients. • Cross-linked amino acids may be indicators of bioavailability of amino acids in feed ingredients.

Acknowledgments • Sanimax • Anna-Kate Shoveller, • James Longstaffe • Elijah Kiarie • Leonid S. Brown
 Looking down to the left
 Critical semi critical and non critical instruments
 Spaulding classification
 Cholesteatoma
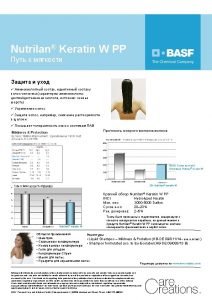
 Nutrilan keratin w pp
 Pan-keratin antibody
 Hardened keratin
 Forensic
 Carbohydrate elements
 Keratin alpha helix
 Ovčí vlna keratin
 Forensic
 Keratin filaments skin
 Keratin
 Ovčí vlna keratin
 Dr.beauty keratin
 Morphology forensics
 Image
Image 4ps of pepsi
 List 5 innovative and 5 functional products
 Critical reading meaning
 What's in activity 1 looking back
 Activity 1 look up look down
 Activity 1 take a look
