KANAD CIRCLE College of Engineering PUNE Ref Proceedings


 • KANAD Quality circle consists of")

 Identification of Work Related Problems Firstly with the help of observation and discussion,")
 Stratification of Problems Identified • The problems were stratified according to three groups’")

 Categorization of Problems Identified The further organisation of collected problems was done as")

 Problem Selection (2) The problem selection is the most important part of any")


 Feedback From Students After filtering the problems with Multivoting, they left with 20")


 Defining the Problem (3) Defining the problem correctly considering its all aspects is")
 Analysis of the Problem (4) • • • After defining the process, they")


 Down Equipments 07(33.")
 • After analysis of the problem they")

 Students: Careless handling of equipments. Loss of interest( involvement.")
 Finding Out the Root Causes (6) Now they were with the main sources")

 Analysis of Root Causes To find out the most affecting causes from the")


 • • • After knowing the critical areas where they")

 • While implementing the solutions they may come across the")

 Trial Implementation and Checking Performance • The solutions were first implemented on trial")
 Regular Implementation (11) After getting good results from the trial implementations done, they")

 Follow Up and Review To check the performance of the regular implementation they")
 Recurrence Prevention • • • To sustain the effects and results of the")

 Future Plans • The future plans of the KANAD Quality Circle are as")
 Contribution of Quality Circle • • • The benefits gained by the students")
 Experience of teamwork. b) Methodical problem solving skills.")
 Conclusion Quality Circles are not limited to manufacturing firms only. They are applicable")
 By Av seshagirirao Sr Faculty, QCFI. 21/08/2020 Ref: Proceedings")

- Slides: 50
KANAD CIRCLE College of Engineering PUNE Ref: Proceedings of the 2012 International Conference on Industrial Engineering and Operations Management Istanbul, Turkey, July 3 – 6, 2012
Quality Circle: An Approach to Solve Institutional Problems: • • A Case Study Mohan P. Khond Mechanical Engineering Department College of Engineering Pune India, 411005 Swapnil C. Devatwal and Hanumant J. Gorade College of Engineering Pune Maharashtra, India, 411005
Introduction The Quality Circles in educational institutes are much complex than those in manufacturing areas because in educational institutes the students are the most important element. The products of the educational institutes are measured by the student capabilities, student’s knowledge, values imparted to the students and all those which indicate the qualities of students towards the wellbeing of society. These qualities of the student are difficult to measure and analyze. So the level of complexity goes on increasing as they analyze them deeper.
Formation and Operation of KANAD Quality Circle (KQC) • KANAD Quality circle consists of seven students as a member who chosen a leader among them, a Professor as a facilitator and a coordinator from administration of Student Association. This QC of seven students, most of the time is involved in tackling the problems related to the teaching learning process. • The KANAD QC members meet regularly on Mondays and Thursdays for two and half hours after their regular college and academic activities.
Methodology adopted As this is an initiation of Quality Circle activity in the College of Engineering Pune, the KANAD Quality Circle members strictly followed the standard steps and procedures given by QCFI (Quality Circle Forum of India) for the effective implementation of the Quality Circle.
1) Identification of Work Related Problems Firstly with the help of observation and discussion, problems related to the teaching-learning and institute premises were identified. The total problems found out were 52.
2) Stratification of Problems Identified • The problems were stratified according to three groups’ viz. Green Zone, Yellow Zone and Red Zone. • • Green Zone – Problems which can be solved by QC members. • • Yellow Zone – Involvement of Department authorities is necessary. • • Red Zone – Involvement of management authorities is necessary. • It is found that the 14 problems were from Green Zone (26%), 19 problems were from Yellow Zone (37%) and 19 problems were from Red Zone (37%). • The figure 1 shows a graphical representation of the stratification for better visualization:
Stratification / Pi graph
3) Categorization of Problems Identified The further organisation of collected problems was done as follows: • Infrastructure – A (23. 08%), • Maintenance – B (9. 62%), • Students – C (11. 54%), • Teachers – D (1%), • Resources and Facilities – E (17. 31%), • Health – F (13. 46%), • Academics – G (23. 08%) The Histogram shown in Figure 2 shows that most of the problems were accumulated in Infrastructure, Academics and Resources & Facility.
Histogram
4) Problem Selection (2) The problem selection is the most important part of any case study. The proper selection of problem leads to the positive results of the case study otherwise failures leads to the loss of confidence in the group.
HOW ? The basic conditions which KANAD QC members considered while selecting a problem for their case study among 52 identified problems were as follows: • The problem should be selected from Green Zone problems. Because those problems needs involvement of QC members only, to solve them. • While selecting the problem, benefits to the students should be considered as the student is an important element in any educational institute. • The problem selected should serve the purpose for an overall development of students.
Methodology Following methodology was adopted by KANAD QC to select the problem from the bunch of 52 problems identified: Brainstorming The Brainstorming session was carried out in which one by one all the problems were discussed, according to their importance, effect and benefits. It gives the broader information of each problem.
Multi-voting • After getting well-known to each problem identified, KQC used Multi-voting tool to shorten the list of 52 problems to the sizable numbers. Multi-voting tool narrows a large list of possibilities to a smaller list of top priorities or to a final selection. With the help of this tool they narrowed our problems from 52 to 20. The procedure they followed was as follows: • �Firstly each QC member is allowed to select 20 problems from the list of 52 according to his priority, • �Then the member is allowed to rate each problem from the list of 20. The rating was to be given in the range of 1 to 10. As 1 for least priority and 10 for high. • �Then all data is combined analyzed, • �Then the top 20 problems according to the ratings were taken out for further analysis.
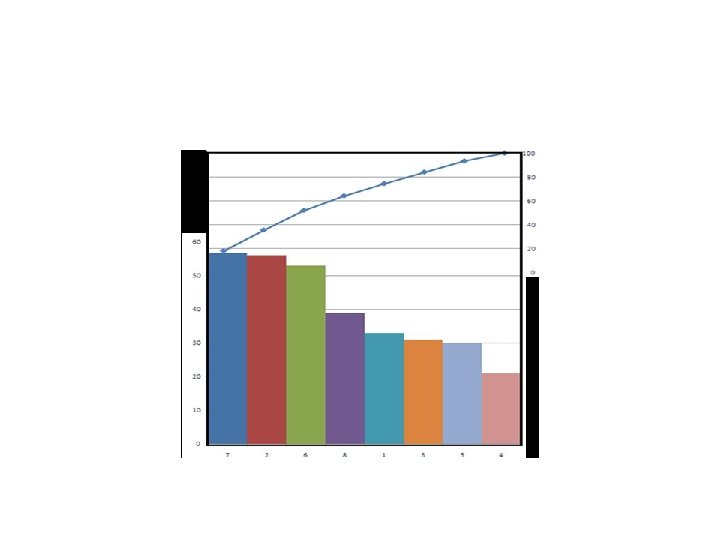
a) Feedback From Students After filtering the problems with Multivoting, they left with 20 problems of high priority according to the QC members and Multivoting tool. Then they went for the feedback from the students to find out the most pinning problem according to the student point of view. Figure 3 shows the graphical representation of the feedback taken from the students. It doesn’t arrive on any one final problem, so they took top 10 problems from the same feedback
Fig. 3
10 problems Following are the top 10 problems filtered through above steps: • Unhygienic conditions of boat club. • Less number of safety equipments in the workshop. • No common announcement system. • Under utilization of summer vacation. • Improper laboratory conditions. • Less number of class rooms. • Pigeon problem in drawing hall. Communication gap between students and teachers. • Students lack in presentation skills • Wastage of electricity.
• Then finally in one of the Brainstorming session with special presence of our facilitator they finalized our problem for further case study. The problem was as follows: • “Improper Laboratory Conditions” • The reasons behind selecting this problem are as follows: • o Improper utilization of existing lab facility. • o Practical and analytical experimentation is a base of engineering curriculum. • o Actual visualization and better understanding of different theoretical concepts. • o To develop students’ interest in experimentation. • o Exposure to high end technological equipments. • o Exposure to industrial equipments and methodology. • o To increase confidence level and judicial skills. • o To develop educational quality.
5) Defining the Problem (3) Defining the problem correctly considering its all aspects is the half problem solved. Therefore they defined our problem in proper manner as follows: “Improper laboratory condition leads to bad effects on various aspects such as hands on experience, student knowledge and skills, student safety, practical performance and educational quality”
6) Analysis of the Problem (4) • • • After defining the process, they collected the data regarding the problem from labs, lab in-charge, lab assistants and students. With the help of that data they analyzed the problem thoroughly. For analyzing the problem they adopted the following procedure: • Flow Diagram They drew a Flow Diagram of teaching and learning process. This diagram helped us to visualize the location of problem in it and its affect on the other elements in same process. From Flow Diagram they can conclude to the following effects of the problem: o Loss of interest of students in experimentation o Less exposure to industrial equipments. o Students are alienated from the practical and analytical experimentation. o Improper utilization of equipments. o Loss of knowledge and judicious skills. o Students miss the opportunity to practical application of theoretical concept.
Flow diagram START Students learn theory in class room Try to understand the concepts Is experimentation possible ? If yes-Are the equipments in working conditions. If Yes conduct experiment-Better understanding by the students. • If No-Are models or simulations available –If no try to understand some how-study exam point of view-No application. • • •
Benchmarking • • To scale our problem i. e. the “Improper laboratory conditions” they used a Benchmarking tool to scale the laboratories in the institute with comparison to the best institutes in the country. They divided the Benchmarking process in four steps as follows to have the clear picture of current condition of the laboratories. o Planning: �What to benchmark? - Institutional laboratory. �Whom to benchmark? - Renowned engineering institutes. �How to benchmark? - By collecting information regarding their lab conditions through internet and professors.
Analysis • Understanding the current practices of laboratories of our institute, as of those institutes being Benchmarked. • o Integration : Communicating the benchmark findings to lab in- charge and assistance • o Action : Developing and implementing solutions derived.
Analysis of Problem by 4 W 1 H • After getting well known to the current situation of the problem they moved to the detailed analysis of the problem to focus on the each aspect of problem. The 4 W 1 H helped us to see the problem in multi perspective view. • o WHAT? : “Improper Laboratory Condition” • Theory of Machines Lab (TOM LAB) • o WHERE? : In the different laboratories of the institute. • o WHO? : Who can be considered responsible? • �Students • �Lab in-charge • �Maintenance • �Management • o WHEN? : From past two years. • o HOW? : �No maintenance �No proper housekeeping.
Condition • • • Total Equipments 21 Equipments working 14(66. 66%) Down Equipments 07(33. 33%) Old Equipments 16(76. 19%) Old and Not Working 07 (43. 75) New Equipments 05 (23. 80) Space Area 110 sq. m. Student Batch 15 Weekly experiment Hours 24 Hours.
Finding Out Causes of the Problem (5) • After analysis of the problem they got familiar with current situation of the problem. Now they are able to find out the causes of the problem. Another Brainstorming session was carried out and the causes were written on a board at random places. The various causes of the problem found out are as follows: • 1. Careless handling of equipments. • 2. Lack of experience and knowledge. • 3. Lack of Belongingness. • 4. Improper guidance. • 5. Staff is giving incomplete information
Contd. . • 6. Faulty instruments. • 7. Failed instruments. • 8. Scheduled maintenance of machineries and infrastructure is not done. • 9. Under-utilization of instruments. • 10. Improper layout. • 11. Loss of interest (involvement). • 12. Negligence. • 13. No manpower for housekeeping and equipment.
Relation between causes (Affinity diagram) Students: Careless handling of equipments. Loss of interest( involvement. ) Lack of belongingness, Lack of experience and knowledge. Staff: Staff is not giving information Negligence Improper guidence Maintenance: Faulty Instruments Failed instruments Scheduled maintenance of machinaries and infrastructure is not done. Under utilisation of instruments. Housekeeping: No manpower for housekeeping and equipement. Improper layout.
9) Finding Out the Root Causes (6) Now they were with the main sources of the problem because of Affinity Diagram. Then they went for finding root causes with the help of Why – Why Analysis. With those main and root causes they drew the Fishbone Diagram as follows:
Fish Bone diagram
10) Analysis of Root Causes To find out the most affecting causes from the list of causes they used Pareto Analysis. Pareto analysis is mostly used to found out “vital few from trivial many”. The following table shows the prioritization of the root causes done according to the ratings given to the causes by the all seven QC members:
Table showing root cause and the ratings given to them by QC members
Root causes On the basis of the prioritization shown in above table, they made a Pareto Chart as shown in Figure 6. From this chart they were able to conclude that the most vital root causes of the problem were student knowledge, maintenance and the housekeeping of the laboratory.
Finding Out Solutions (8) • • • After knowing the critical areas where they need to focus, they found out various solutions. In one of the Brainstorming session they found out the solutions to strike the vital causes filtered by Pareto chart. Then they check the possible solutions with SMART technique. S - Simple & Specific M - Measurable & Manageable A - Achievable & Acceptable R - Reasonable & Realistic T - Time bound & Teste
Solutions • • • The final solutions after SMART technique are as follows: 1. Charts of Do’s and Don'ts 2. Preventive Maintenance charts 3. 5 S’s implementation 4. Awareness charts 5. Induction tours for 2 nd year students 6. Mini Projects 7. Best lab competition 8. “Learn and Earn” in lab 9. Safety and health issue
Foreseeing Probable Resistances (9) • While implementing the solutions they may come across the resistances, so to know those resistances and their magnitude they used Force Field Analysis tool. Figure 8 shows analysis: • As the solutions are filtered by SMART technique so there was no objections they faced for implementing them. Whereas Force Field analysis also explored the helping forces to implement our solutions.
Force Field Analysis showing helping and hindering forces
13) Trial Implementation and Checking Performance • The solutions were first implemented on trial basis. The performance was checked and following indications were found out. • Table 3: Results of Trial Implementation
14) Regular Implementation (11) After getting good results from the trial implementations done, they decided to go for regular implementation. For the effective implementation they used PDCA (Plan – Do – Check – Action) cycle. Table No. 4 shows the action plan for the regular implementation by using 5 W 1 H tool.
Action plan for regular implementation using 5 W 1 H Action Plan (P of PDCA cycle) • WHAT • Charts (Do's and Don'ts) To improve students’ knowledge & skill Hanumant & Devdatta 11 -Aug-09 TOM lab With the help of books, manuals and internet Preventive maintenance chart To prevent instrument failure Swapnil & Kunal 14 -Aug-09 TOM lab By common practice and equipment manual 5 S's Implementation For effective workplace organization 5 S’s Team & Kunal 12 -Aug-09 TOM lab By learning techniques from any industry Mini Projects To improve students’ knowledge & skill Ankur & Sourabh 13 -Aug-09 TOM lab By selecting instrument to be designed or repaired "Learn and Earn" in lab Social work with improvement in lab. Rushikesh & Sourabh 17 -Aug-09 TOM lab By taking information from library • • • Safety and Health 15 -Aug-09 S's WHY WHO WHEN WHERE HOW To create safe environment Devdatta & Hanumant TOM lab By preventing accidents and Implementing 5
15) Follow Up and Review To check the performance of the regular implementation they decided to take a follow up and review of the activities. The tool used for the same was Formative Follow Up technique. The Formative Follow Up includes the Surveys, interviews, data collection, experiments and number point rule.
16) Recurrence Prevention • • • To sustain the effects and results of the implementation done, the need is to sustain it. For that very reason they used a FMEA (Failure Mode and Effect Analysis). The purpose of using FMEA was to identify all the possible failures in future with current practices of implementation. The figure x shows a FMEA sheet. Firstly all possible failure modes are found out and rated as follows: S – Severity rating, O – Occurrence rating, D – Detection rating Then RPM (Risk Priority Number) is calculated by RPN = S х O х D
FMEA sheet for recurrence prevention
17) Future Plans • The future plans of the KANAD Quality Circle are as follows: • a. Continuation of present implementation and evaluation. • b. Extending the current practice to other labs. • c. Intradepartmental Best Lab competition and incentives. • d. Learn & Earn program on broader level. • e. Consultancy jobs and testing to increase utilization of lab equipments.
18) Contribution of Quality Circle • • • The benefits gained by the students as well as QC members are as follows: Gains for the students: a) Technical knowledge of students is increased. a) Motivation for practical and analytical experimentation. b) Proper utilization and handling of laboratory equipments. c) Improved maintenance and housekeeping capability. d) Clean and safe laboratory environment. e) Improved sense of belongingness and satisfaction.
Gains for the QC members: a) Experience of teamwork. b) Methodical problem solving skills. c) Improved Organizing & Presentation skills. d) Happiness through continuous learning and development. • e) Satisfaction through voluntary work. • f) Ability to perceive probable consequences • • •
19) Conclusion Quality Circles are not limited to manufacturing firms only. They are applicable for variety of organizations where there is scope for group based solution of work related problems. • In educational institutes the solutions are easy to implement as the students are working for their own development. The development of educational institutes lies in the students overall growth. • The concept seems simple and it is, but the implementation and the effort needed to keep the circles functioning effectively require strong support and commitment from the group members and the authorities. •
Presentation (Adopted from PDF ) By Av seshagirirao Sr Faculty, QCFI. 21/08/2020 Ref: Proceedings of the 2012 International Conference on Industrial Engineering and Operations Management Istanbul, Turkey, July 3 – 6, 2012