INTRODUCTION TO DATA SCIENCE JOHN P DICKERSON Lecture
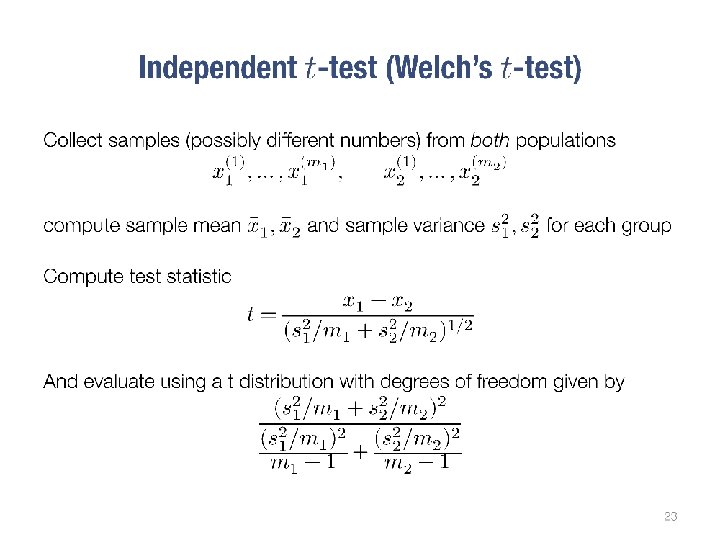
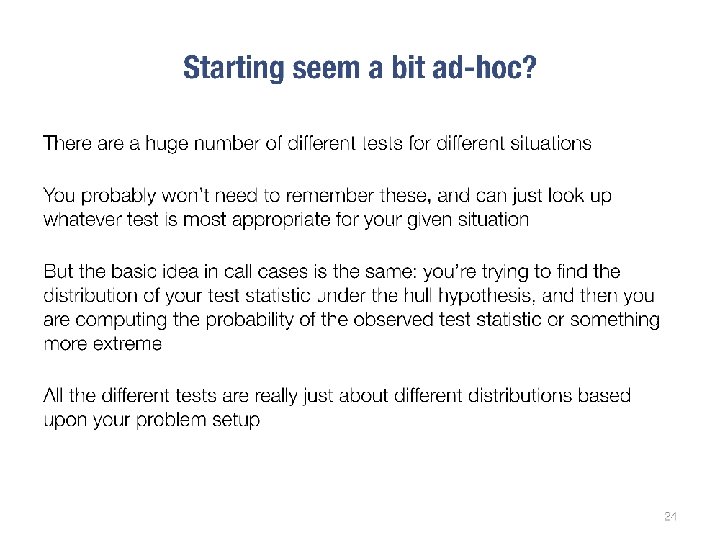
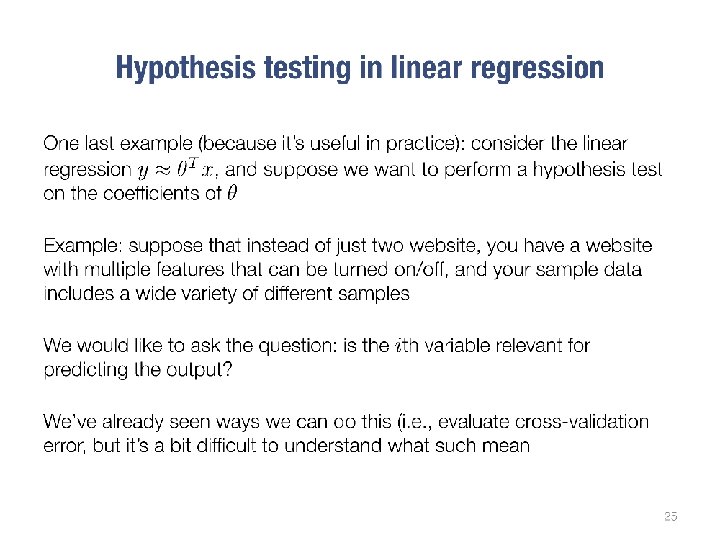
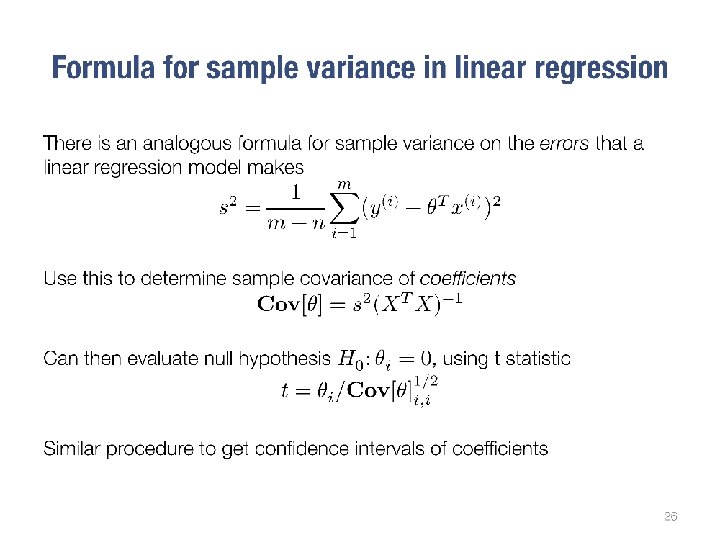
- Slides: 30
INTRODUCTION TO DATA SCIENCE JOHN P DICKERSON Lecture #19 – 4/6/2017 CMSC 320 Tuesdays & Thursdays 3: 30 pm – 4: 45 pm
ANNOUNCEMENTS Mini-Project #3 is out! • It is now due April 21 st (was April 18 th). • ELMS link: https: //myelms. umd. edu/courses/1218364/assignments/4389209 This is a two-part mini-project (regression & classification)! Midterm next Thursday (4/13); good ways to study: 2 • Lecture slides; trying stuff out in i. Python; Piazza; external links on the course website; asking TAs about gaps in knowledge
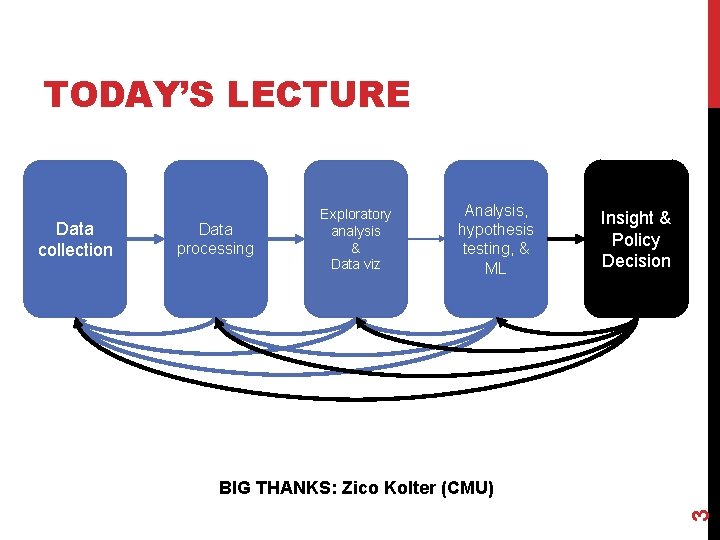
TODAY’S LECTURE Data processing Analysis, hypothesis testing, & ML Insight & Policy Decision BIG THANKS: Zico Kolter (CMU) 3 Data collection Exploratory analysis & Data viz
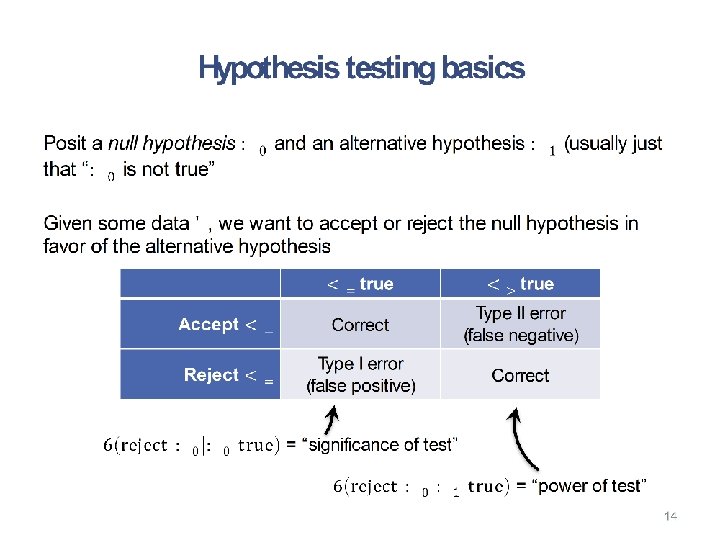
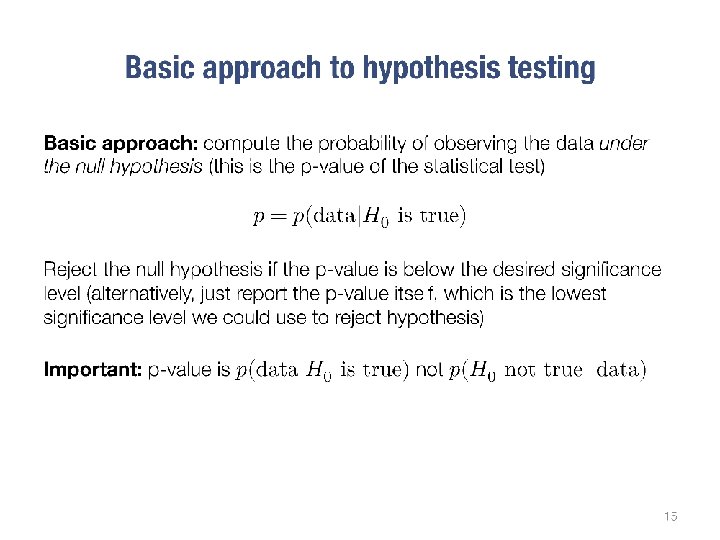
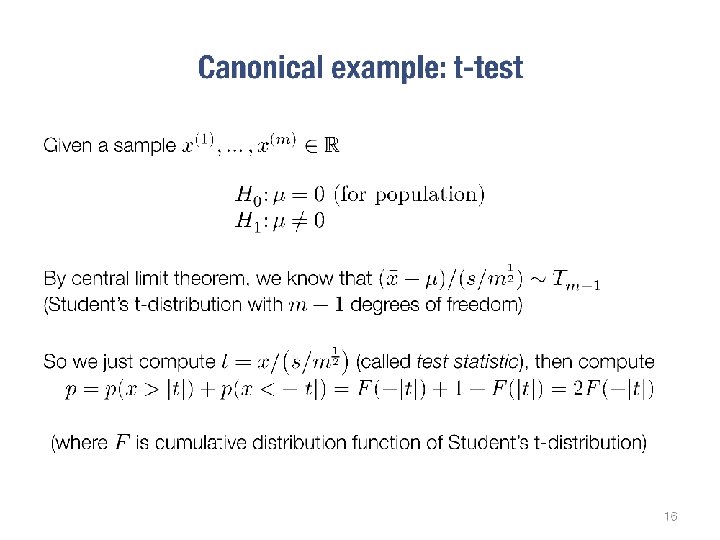
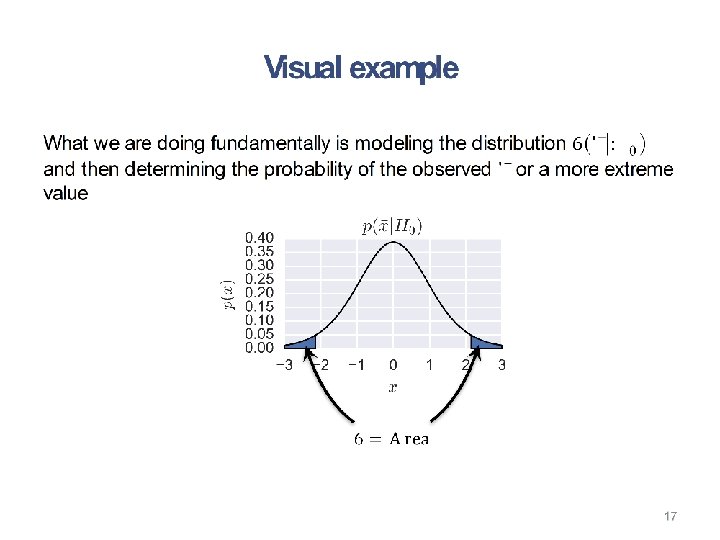
SUMMARY Hypothesis testing allows us to formulate beliefs about investment attributes and subject those beliefs to rigorous testing following the scientific method. 4 • For parametric hypothesis testing, we formulate our beliefs (hypotheses), collect data, and calculate a value of the investment attribute in which we are interested (the test statistic) for that set of data (the sample), and then we compare that with a value determined under assumptions that describe the underlying population (the critical value). We can then assess the likelihood that our beliefs are true given the relationship between the test statistic and the critical value. • Commonly tested beliefs associated with the expected return and variance of returns for a given investment or investments can be formulated in this way.
5
6
7
8
9
10
11
12
13
14
15
16
17
18
19
20
21
22
23
24
25
26
27
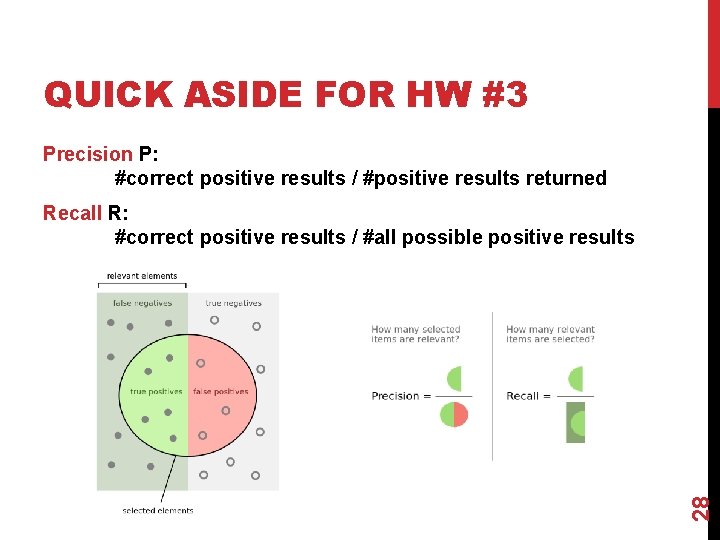
QUICK ASIDE FOR HW #3 Precision P: #correct positive results / #positive results returned 28 Recall R: #correct positive results / #all possible positive results
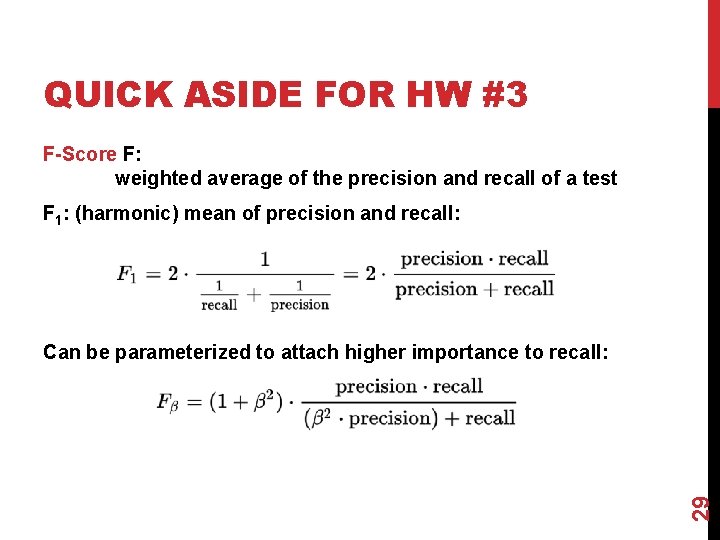
QUICK ASIDE FOR HW #3 F-Score F: weighted average of the precision and recall of a test F 1: (harmonic) mean of precision and recall: 29 Can be parameterized to attach higher importance to recall:
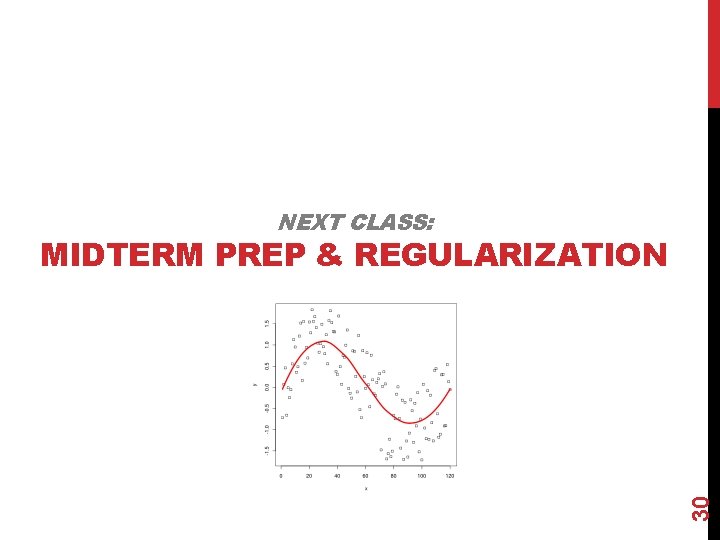
NEXT CLASS: 30 MIDTERM PREP & REGULARIZATION