
Methodology Glossary Analysis conducted by Sally Dickerson managing


Methodology & Glossary

Analysis conducted by Sally Dickerson managing director Benchmarketing A graduate in Mathematics from Oxford, Sally joined Mars UK as a market research analyst, later joining their Management Science division. She co-founded The Decision Shop, part of Bates/Cordiant then in 1999 joined then OMD group and set up ROI (Return on Investment) focused on market mix modelling, which became OMD Metrics, then Brand. Science, and is now Annalect Marketing Sciences. In 2016 Sally created a new consultancy business, Benchmarketing, running strategic quantitative consultancy projects using meta analysis. She has also contributed to over 30 IPA advertising effectiveness awards, been an IPA effectiveness award and Cannes Creative Effectiveness judge multiple times, and run marketing effectiveness masterclasses for the Marketing Society and Chartered Institute of Marketing.
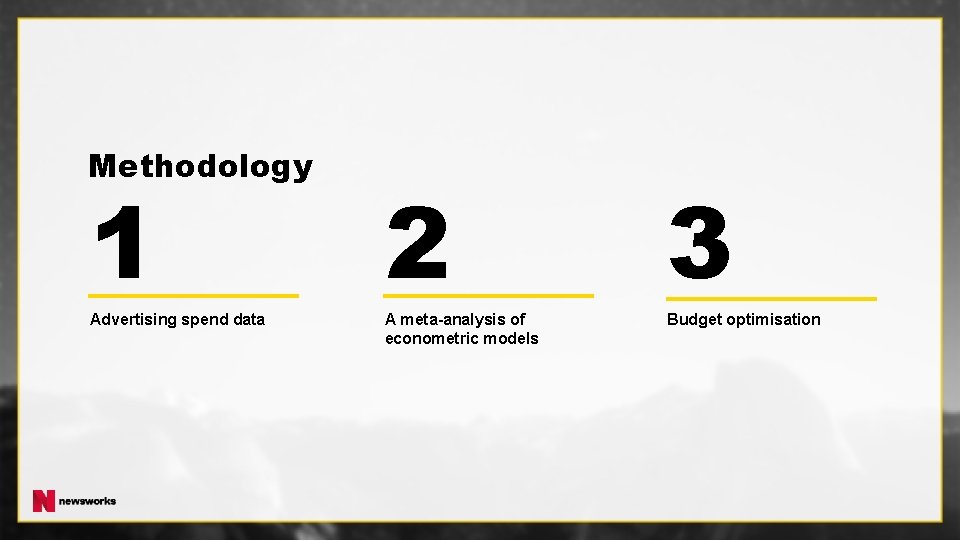
Methodology 1 2 3 Advertising spend data A meta-analysis of econometric models Budget optimisation
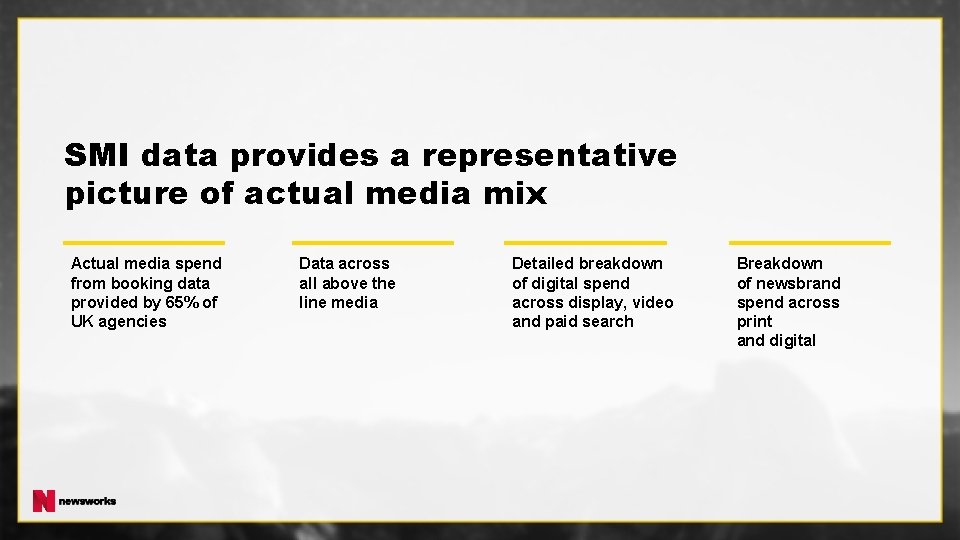
SMI data provides a representative picture of actual media mix Actual media spend from booking data provided by 65% of UK agencies Data across all above the line media Detailed breakdown of digital spend across display, video and paid search Breakdown of newsbrand spend across print and digital
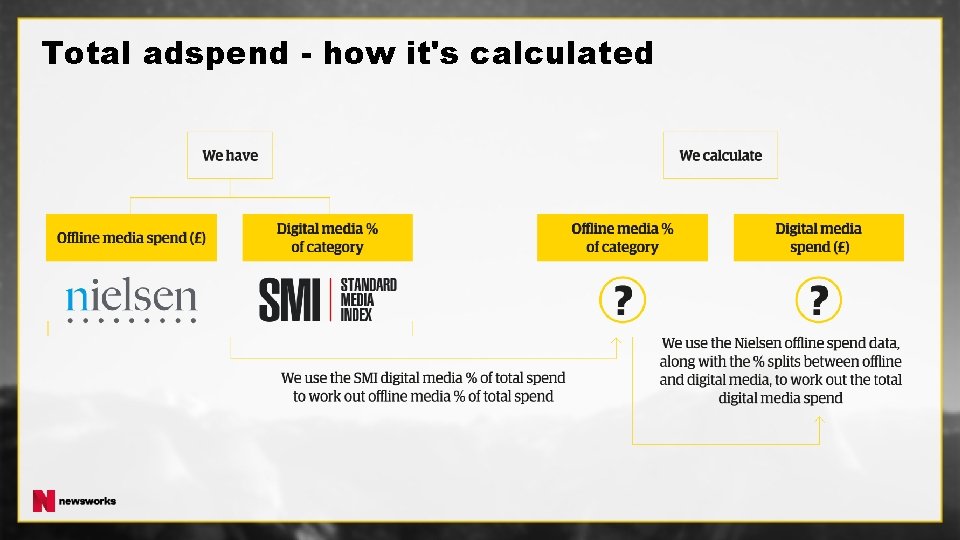
Total adspend - how it's calculated

Econometrics Identifying and assigning a weight to the ingredients driving sales and profit • Advertising x medium and message • PR, Media mentions, Buzz • Pricing vs competitors • Store universe changes • Product/Range changes • Brand awareness/perceptions • Competitor marketing • Competitor routes to market • Technological change • Seasonality • Economic change

A meta-analysis of 684 econometric models from 2011 to 2017
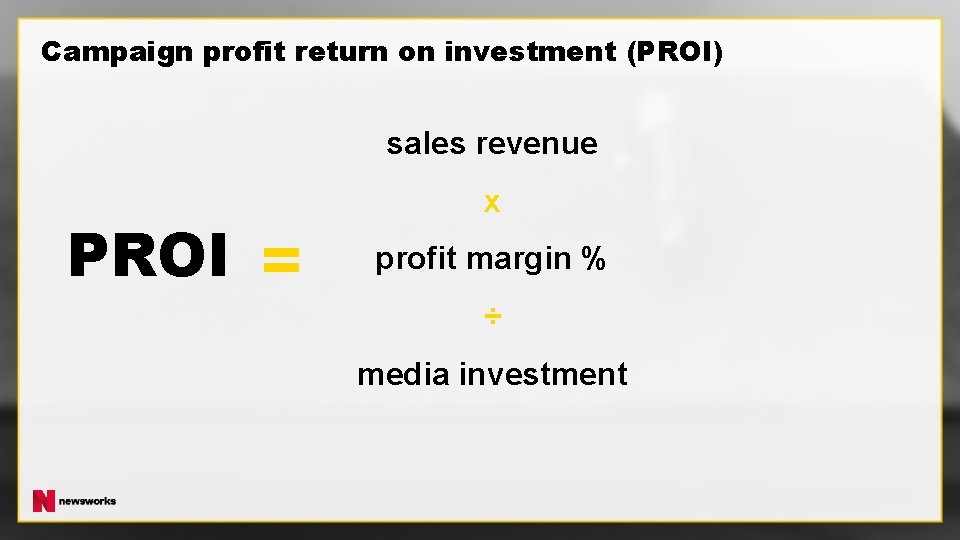
Campaign profit return on investment (PROI) sales revenue PROI = x profit margin % ÷ media investment
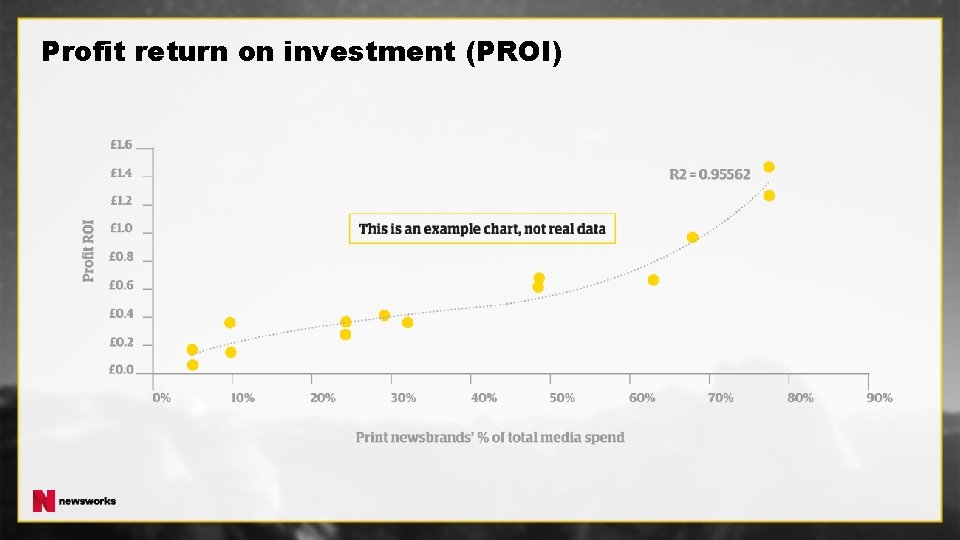
Profit return on investment (PROI)
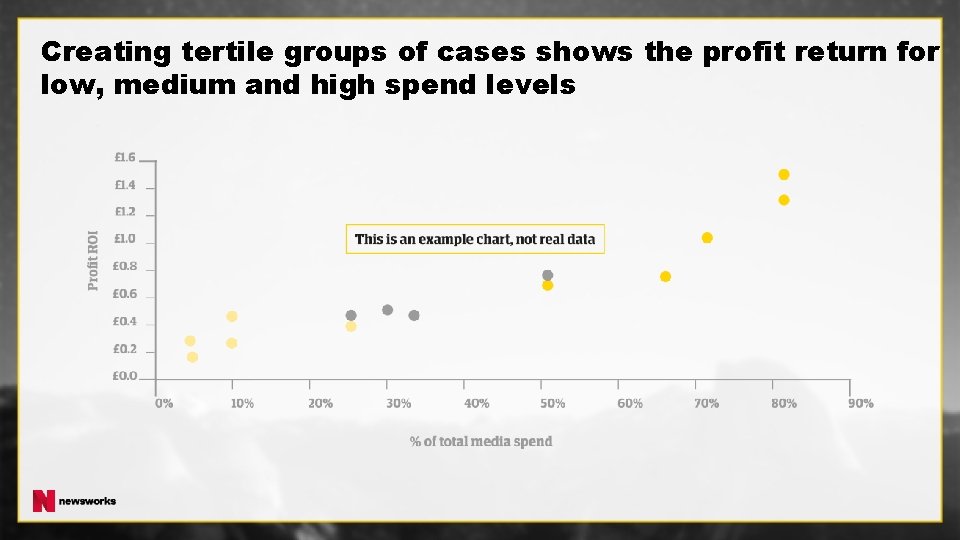
Creating tertile groups of cases shows the profit return for low, medium and high spend levels
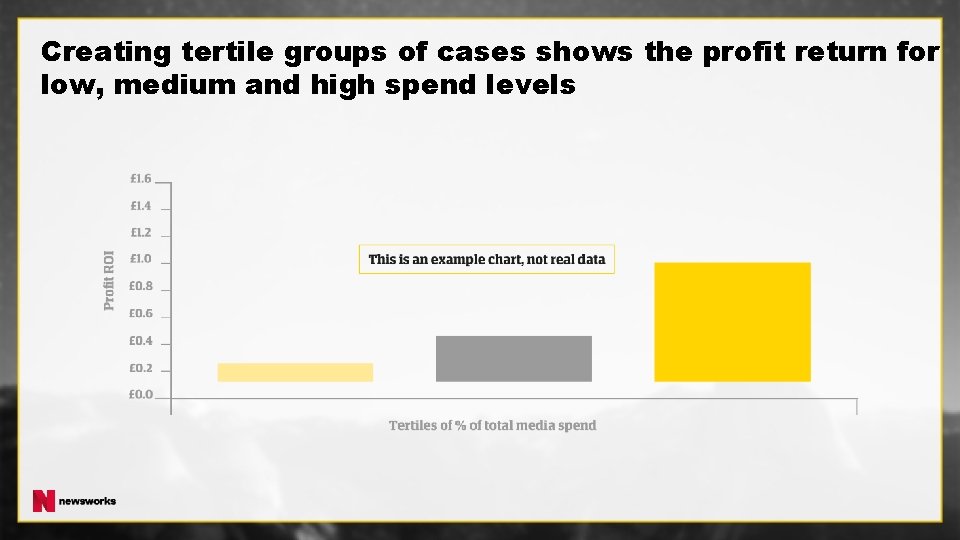
Creating tertile groups of cases shows the profit return for low, medium and high spend levels
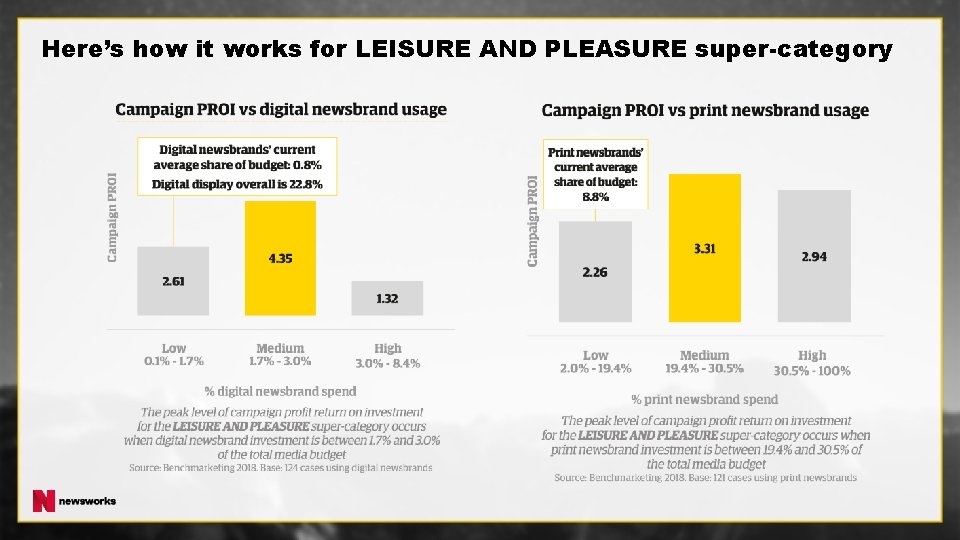
Here’s how it works for LEISURE AND PLEASURE super-category
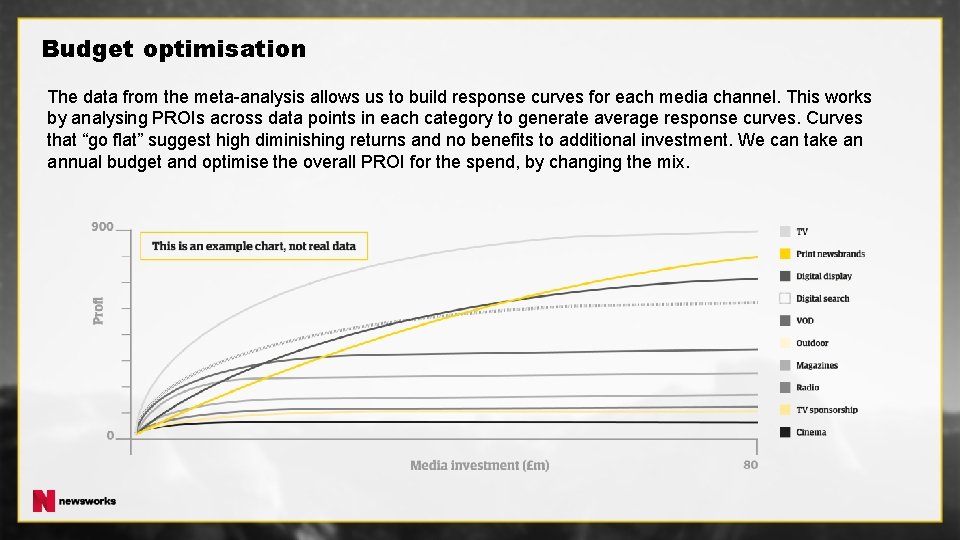
Budget optimisation The data from the meta-analysis allows us to build response curves for each media channel. This works by analysing PROIs across data points in each category to generate average response curves. Curves that “go flat” suggest high diminishing returns and no benefits to additional investment. We can take an annual budget and optimise the overall PROI for the spend, by changing the mix.
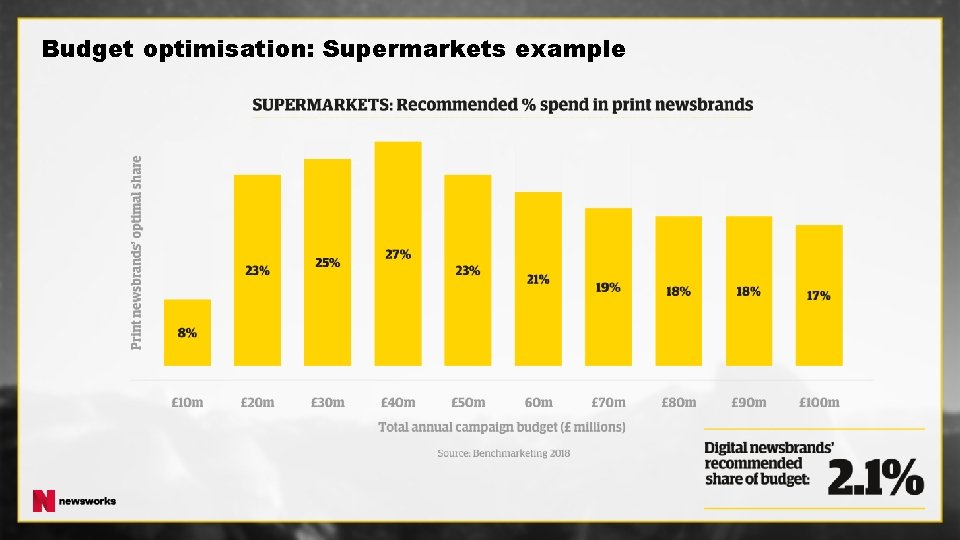
Budget optimisation: Supermarkets example

Introducing the super-categories
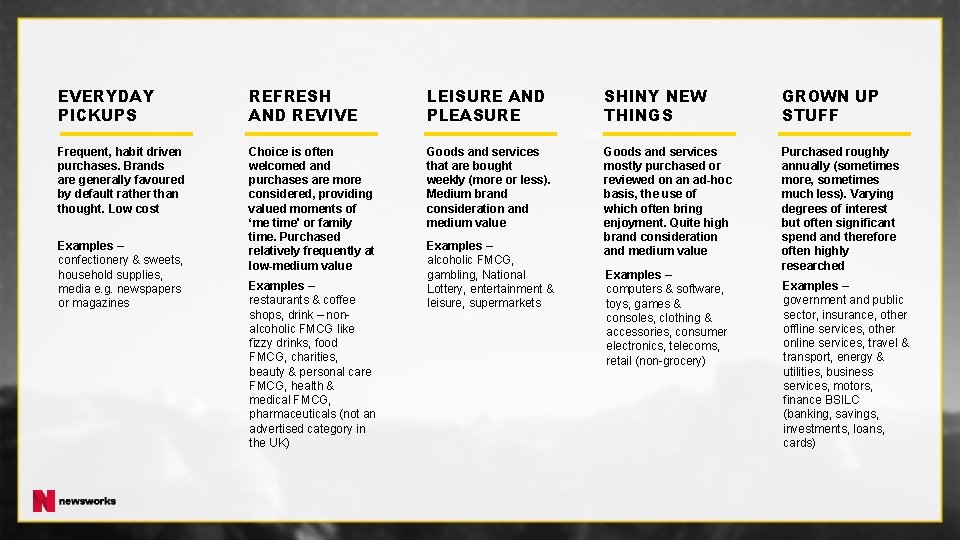
EVERYDAY PICKUPS REFRESH AND REVIVE LEISURE AND PLEASURE SHINY NEW THINGS GROWN UP STUFF Frequent, habit driven purchases. Brands are generally favoured by default rather than thought. Low cost Choice is often welcomed and purchases are more considered, providing valued moments of ‘me time' or family time. Purchased relatively frequently at low-medium value Goods and services that are bought weekly (more or less). Medium brand consideration and medium value Goods and services mostly purchased or reviewed on an ad-hoc basis, the use of which often bring enjoyment. Quite high brand consideration and medium value Purchased roughly annually (sometimes more, sometimes much less). Varying degrees of interest but often significant spend and therefore often highly researched Examples – confectionery & sweets, household supplies, media e. g. newspapers or magazines Examples – restaurants & coffee shops, drink – nonalcoholic FMCG like fizzy drinks, food FMCG, charities, beauty & personal care FMCG, health & medical FMCG, pharmaceuticals (not an advertised category in the UK) Examples – alcoholic FMCG, gambling, National Lottery, entertainment & leisure, supermarkets Examples – computers & software, toys, games & consoles, clothing & accessories, consumer electronics, telecoms, retail (non-grocery) Examples – government and public sector, insurance, other offline services, other online services, travel & transport, energy & utilities, business services, motors, finance BSILC (banking, savings, investments, loans, cards)
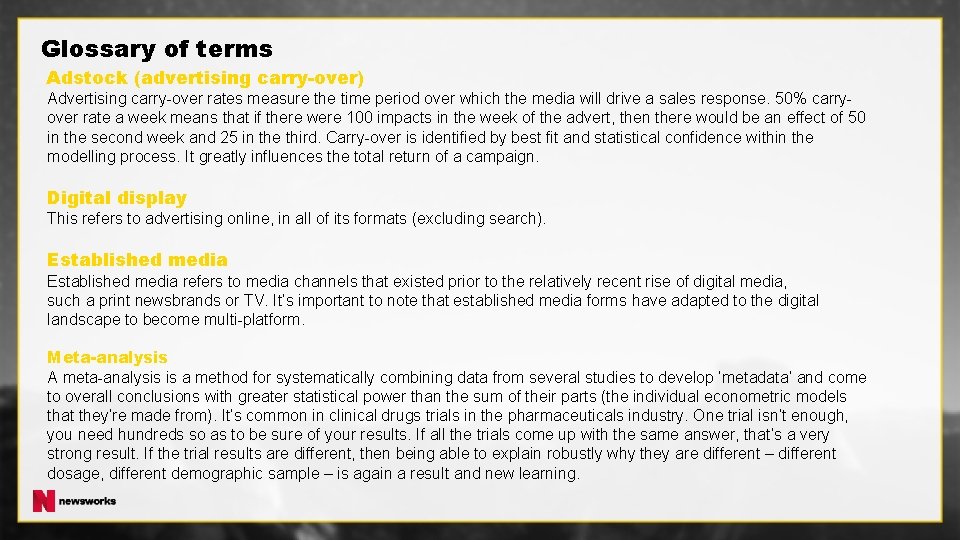
Glossary of terms Adstock (advertising carry-over) Advertising carry-over rates measure the time period over which the media will drive a sales response. 50% carryover rate a week means that if there were 100 impacts in the week of the advert, then there would be an effect of 50 in the second week and 25 in the third. Carry-over is identified by best fit and statistical confidence within the modelling process. It greatly influences the total return of a campaign. Digital display This refers to advertising online, in all of its formats (excluding search). Established media refers to media channels that existed prior to the relatively recent rise of digital media, such a print newsbrands or TV. It’s important to note that established media forms have adapted to the digital landscape to become multi-platform. Meta-analysis A meta-analysis is a method for systematically combining data from several studies to develop ‘metadata’ and come to overall conclusions with greater statistical power than the sum of their parts (the individual econometric models that they’re made from). It’s common in clinical drugs trials in the pharmaceuticals industry. One trial isn’t enough, you need hundreds so as to be sure of your results. If all the trials come up with the same answer, that’s a very strong result. If the trial results are different, then being able to explain robustly why they are different – different dosage, different demographic sample – is again a result and new learning.
Glossary of terms Nielsen is an information and measurement company providing market research, insights and data about what people watch, listen to and buy. In this project, the data has been used to report offline media spend figures. PAMCo Audience Measurement for Publishers is the new JIC (Joint Industry Currency) for published media, using approved, world-leading methodology. It produces de-duplicated brand reach, allowing users to carry out reach and frequency planning to better understand audiences across all platforms. PROI – ‘Profit return on investment’ The revenue generated by advertising campaigns divided by the profit margin for each client over the short to medium-term. It takes into account the media investment and the cost of goods or services, so provides a much clearer guide to advertising payback than simply looking at the revenue generated. RROI – ‘Revenue return on investment’ The amount of gross income versus the costs of an ad campaign. This is not overall profit, it’s sales revenue. Sales response curves take a dynamic look at the changes in response to advertising according to different combinations of channels at different budget levels.
Glossary of terms Scaleable The ability to be resized to different proportions. In this project ‘scaleability’ refers to whether or not a media channel can be scaled up to take a higher proportion of the media budget and still deliver strong profits. For example, if a medium has low reach, additional investment might affect profitability as it will be hitting the same audience more frequently. SMI (Standard Media Index) SMI provides global adspend data straight from booking systems (covering 65% of UK media agency billings). In this project, it’s been used to calculate the proportion of total adspend attributed to digital media channels, as it separates different types of digital spend, including digital newsbrands. Tertile A ‘tertile’ refers to one third of any given dataset. In this analysis, we talk about ‘low’, ‘middle’ and ‘upper’ tertiles. Traditional mass media Also referred to as ‘established media’, traditional mass media refers to large audience media channels such as print newsbrands, TV or radio, which existed prior to the relatively recent rise of digital media. It’s important to note that ‘traditional’ have adapted to the digital landscape to become multi-platform.
- Slides: 20