Introduction to CostUtility Analysis Awad MATARIA Ph D


. Time-Trade Off (TTO).")
 Simplest approach. Procedure: Rank health outcomes from most preferred to least")
 Rating scale (0, 100). Category scaling (0, 10 or 11). Visual")
 Preferences for chronic states and rating scale. Irreversible: same age of")
 Rating scale: Ordinal ranking. Intensity of preferences. Biases: Compared with SG")
 Third axiom of Von Neumann Morgenstern utility theory (1944). Preference score")
")
 Alternative to SG but score has to be adjusted to be")
")

.")


- Slides: 24
Introduction to Cost-Utility Analysis Awad MATARIA, Ph. D Health Economist HEC/DHS/WHO-EMRO Introduction to Economic Evaluation with Special Application to NCDs Cairo-Egypt, 16 -18 December 2012
Introduction Full economic evaluation. Output valuation. Final output and general: not program specific. Incremental cost per QALY gained. Productivity changes and discounting. Valid output data (intermediate versus final). Quantity and quality: mortality and morbidity. Highlight the important role of consumer preferences in valuing outcomes.
Labeling: CEA versus CUA. Nomenclature: Generalized CEA, utility maximization, health status index. Multiple outcome, not only counted but also valued according to their desirability.
When to use CUA: HRQo. L is the important outcome; e. g. , arthritis. HRQo. L is an important outcome; e. g. , neonatal intensive care for very-low-birthweight infants. Morbidity and mortality; e. g. , cancer treatment. Wide comparisons.
When not to use CUA: Only intermediate outcomes. Equally Extra effective alternatives. cost for obtaining utility values is not cost -effective.
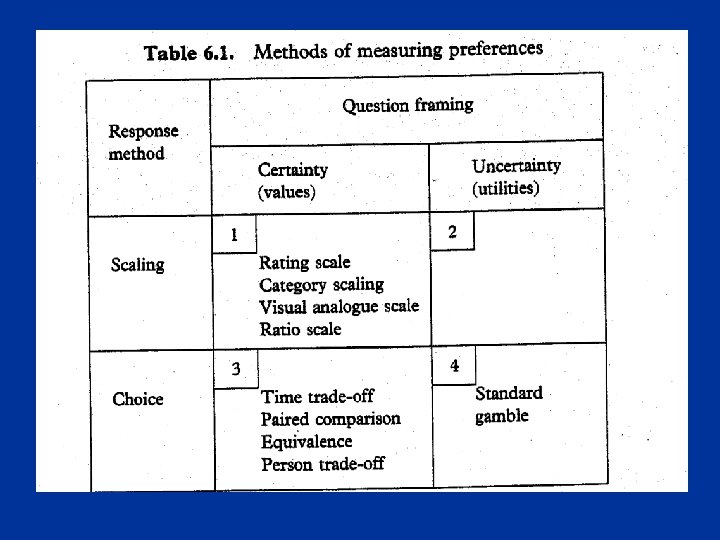
Utility, value, preferences Preference is the umbrella that describes the overall concept. Utilities and values are different types of preferences, what you get depends on how you measure (table).
Measuring preferences Three main instruments: Rating Scale. Standard Gamble (SG). Time-Trade Off (TTO).
Rating Scale (1) Simplest approach. Procedure: Rank health outcomes from most preferred to least preferred. Place the outcomes on an interval scale: equally desirable, very different in desirability & comparison of intervals rather than scores to produce interval scale of preferences. Not ratios but intervals.
Rating Scale (2) Rating scale (0, 100). Category scaling (0, 10 or 11). Visual analogue scale (VAS): 10 cm, with or without marks but clearly defined endpoints. “feeling thermometer”
Rating Scale (3) Preferences for chronic states and rating scale. Irreversible: same age of onset to death. Two additional chronic states are added: Healthy from age of onset to death. Death at age of onset. Select the best and worst health state in the batch, to place them on 0 -1 scale. If death = 0 then x is the preference value. Otherwise, preference value = (x-d)/(1 -d).
Rating Scale (4) Rating scale: Ordinal ranking. Intensity of preferences. Biases: Compared with SG or TTO, it is not interval. End-of-scale bias & spacing out bias. Conversion to SG or TTO using power curve conversion : convert after or warming up.
Standard Gamble (1) Third axiom of Von Neumann Morgenstern utility theory (1944). Preference score for state i for time t = p (figure). Utility scale: perfect health for t years = 1, death = 0. Visual aids for probabilities: e. g. , probability wheel.
Standard Gamble (2)
Time-Trade Off…. (1) Alternative to SG but score has to be adjusted to be used as VNM. hi = x/t. hi = 1 -(1 -hj)x/t. if hj=0 then hi = 1 -x/t.
Time-Trade Off…. (2)
Person-Trade Off Called “Equivalence” before. How many patients in the designated state of health should have their lives extended by one year in order to be equivalent to extending the lives of 100 healthy patients by one year? More suitable for resource allocation decisions.
Multi-attribute health status classification systems Pre-scored systems. Three main systems: Quality of Well-Being (QWB). Health Utilities Index (HUI). Euro. Qol (EQ-5 D).
MAU Theory Ex. , HUI 2: MAHSCS. 6 attributes: Sensation, mobility, emotion, cognition and selfcare, pain. Levels: 4 -5 from no to full impairment. First order: no interaction (synergism or antagonism). Mutual utility independence. Additive independence.
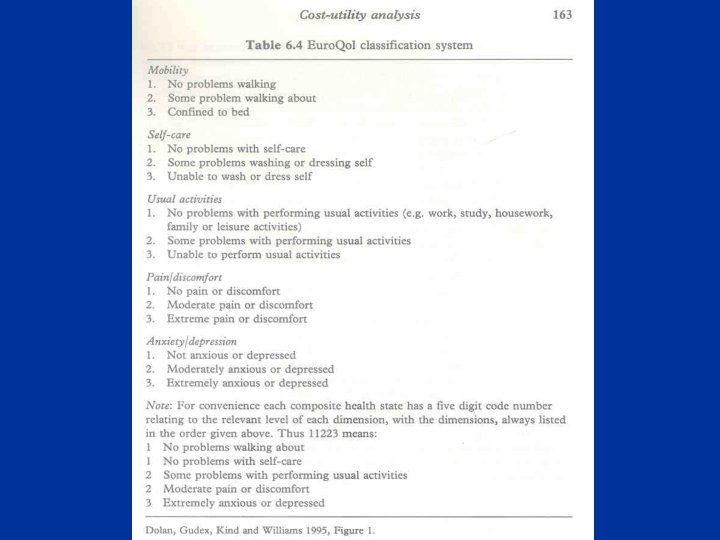
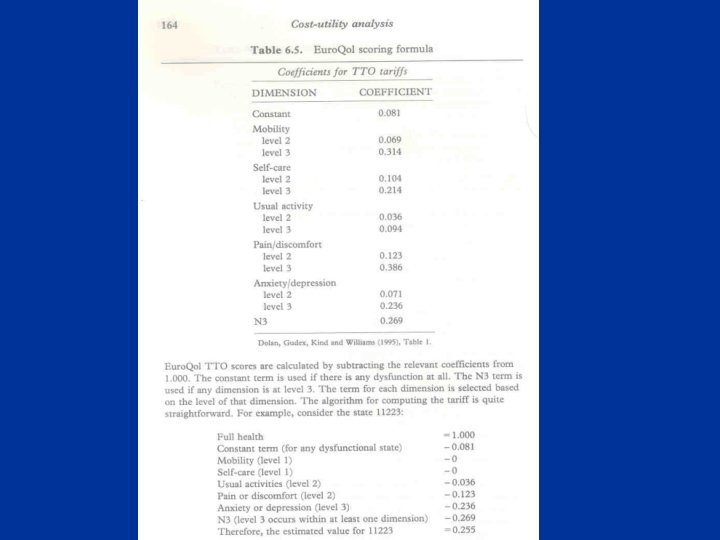
QWB & EQ-5 D QWB: EQ-5 D: 4 attributes: mobility, physical activity, social activity, symptom problem complex. Scoring function is based on category scaling measurement from the general population (values not utilities). 5 attributes: mobility, self care, usual activity, pain/discomfort, and anxiety/depression. 3 levels per attribute: no problem, some problem, major problem. 243 combinations + unconscious and death. Preferences scores are calculated using TTO.
QALY
THANK YOU