InnovativeAlternative Septic System Performance and Tracking it with
- Slides: 20
Innovative/Alternative Septic System Performance and Tracking it with the Carmody Database Barnstable County Department of Health and Environment
By The Numbers Permit Breakdown by Town and System Type
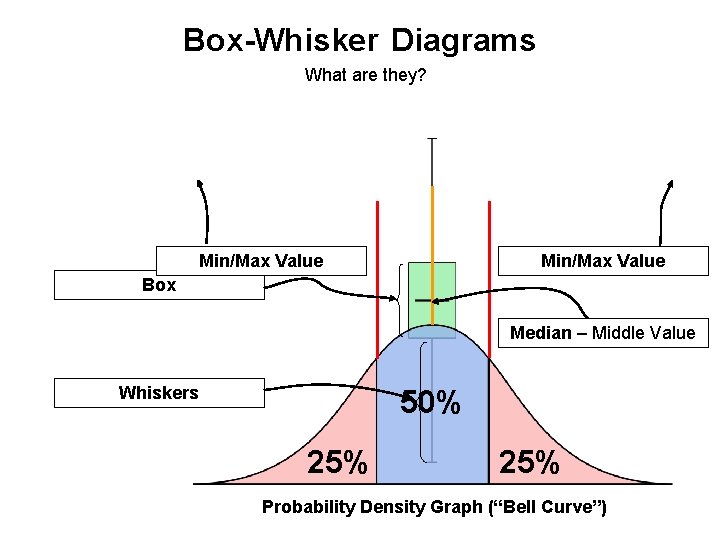
Box-Whisker Diagrams What are they? Min/Max Value Box Median – Middle Value Whiskers 50% 25% Probability Density Graph (“Bell Curve”)
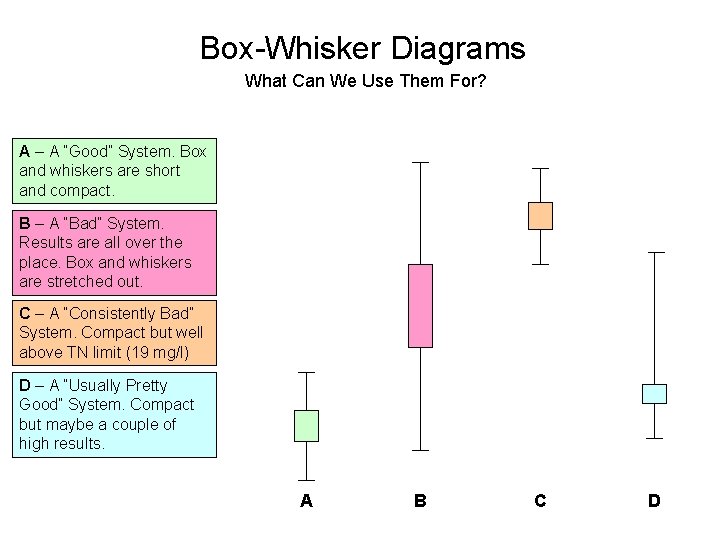
Box-Whisker Diagrams What Can We Use Them For? A – A “Good” System. Box and whiskers are short and compact. B – A “Bad” System. Results are all over the place. Box and whiskers are stretched out. C – A “Consistently Bad” System. Compact but well above TN limit (19 mg/l) D – A “Usually Pretty Good” System. Compact but maybe a couple of high results. A B C D
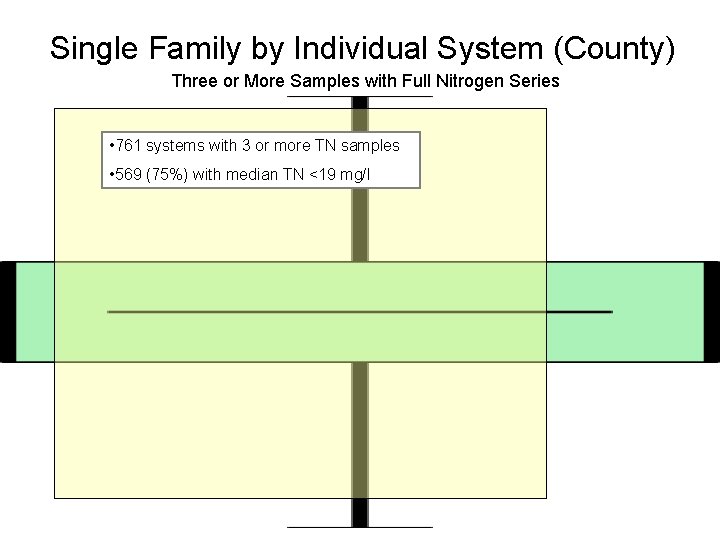
Single Family by Individual System (County) Three or More Samples with Full Nitrogen Series • 761 systems with 3 or more TN samples • 569 (75%) with median TN <19 mg/l
Single Family all Types (Bourne) Three or More Samples with Full Nitrogen Series • 54 systems with 3 or more TN samples • 33 (61%) with median TN <19 mg/l
Single Family by System Type (County) Three or More Samples with Full Nitrogen Series
Single Family by System Type (Bourne) Three or More Samples with Full Nitrogen Series
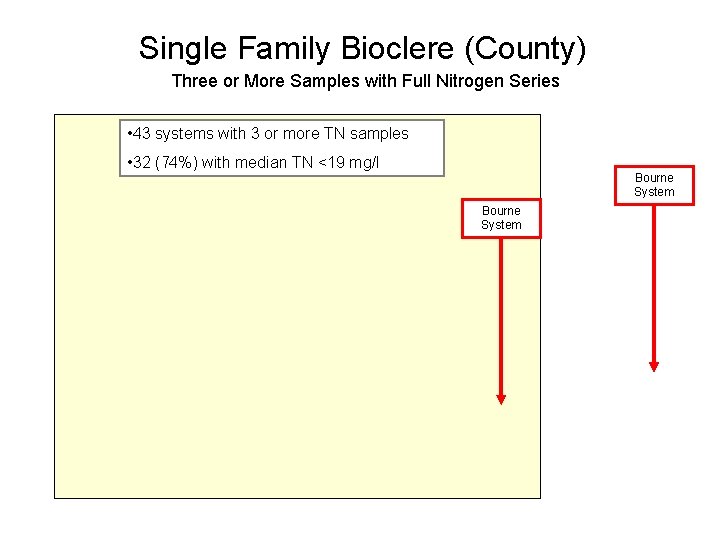
Single Family Bioclere (County) Three or More Samples with Full Nitrogen Series • 43 systems with 3 or more TN samples • 32 (74%) with median TN <19 mg/l Bourne System
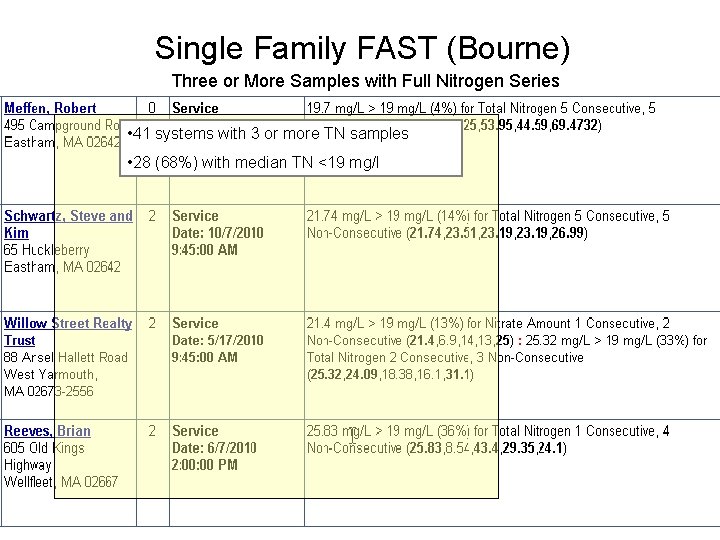
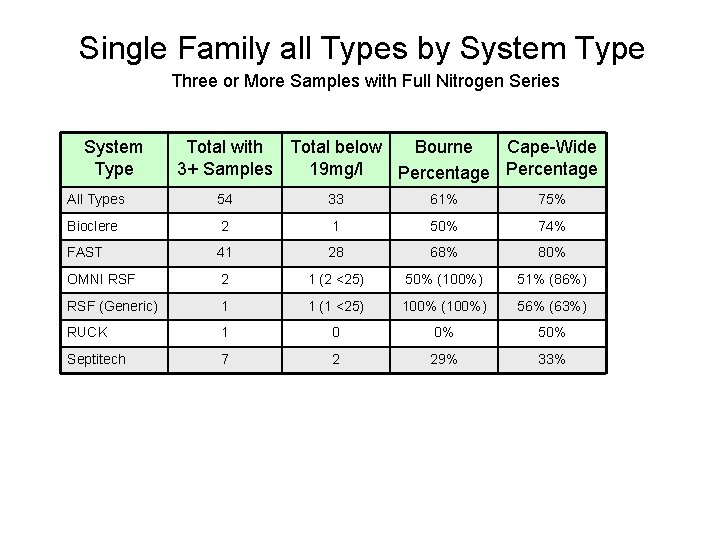
Single Family FAST (Bourne) Three or More Samples with Full Nitrogen Series • 41 systems with 3 or more TN samples • 28 (68%) with median TN <19 mg/l
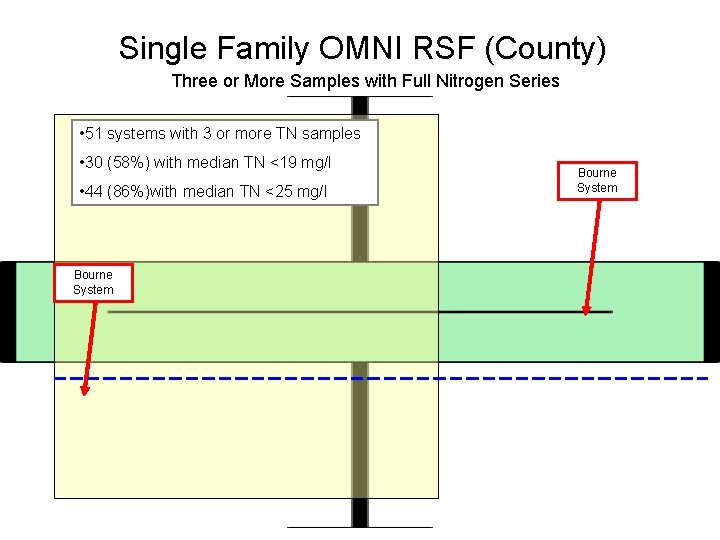
Single Family OMNI RSF (County) Three or More Samples with Full Nitrogen Series • 51 systems with 3 or more TN samples • 30 (58%) with median TN <19 mg/l • 44 (86%)with median TN <25 mg/l Bourne System
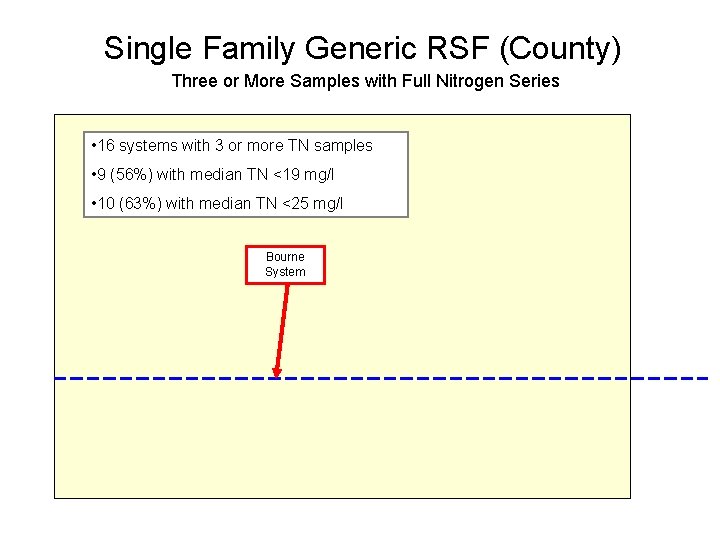
Single Family Generic RSF (County) Three or More Samples with Full Nitrogen Series • 16 systems with 3 or more TN samples • 9 (56%) with median TN <19 mg/l • 10 (63%) with median TN <25 mg/l Bourne System
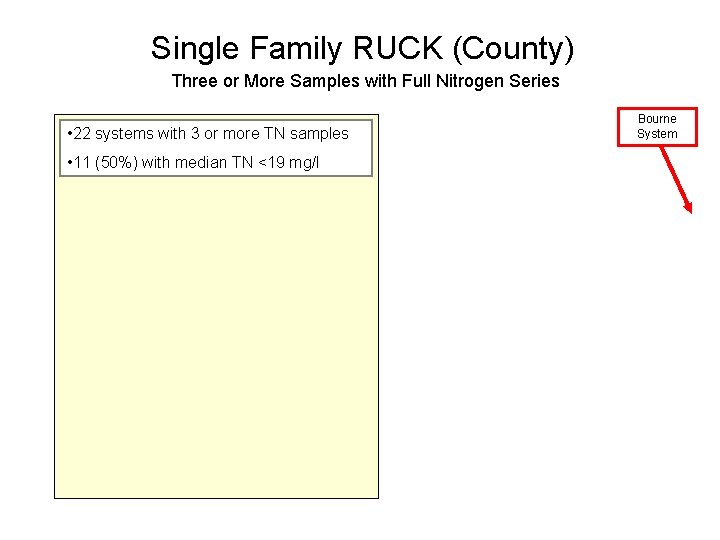
Single Family RUCK (County) Three or More Samples with Full Nitrogen Series • 22 systems with 3 or more TN samples • 11 (50%) with median TN <19 mg/l Bourne System
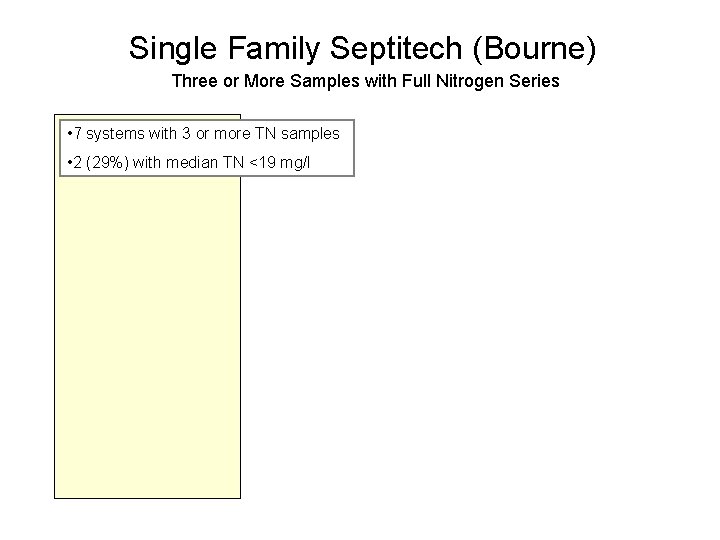
Single Family Septitech (Bourne) Three or More Samples with Full Nitrogen Series • 7 systems with 3 or more TN samples • 2 (29%) with median TN <19 mg/l
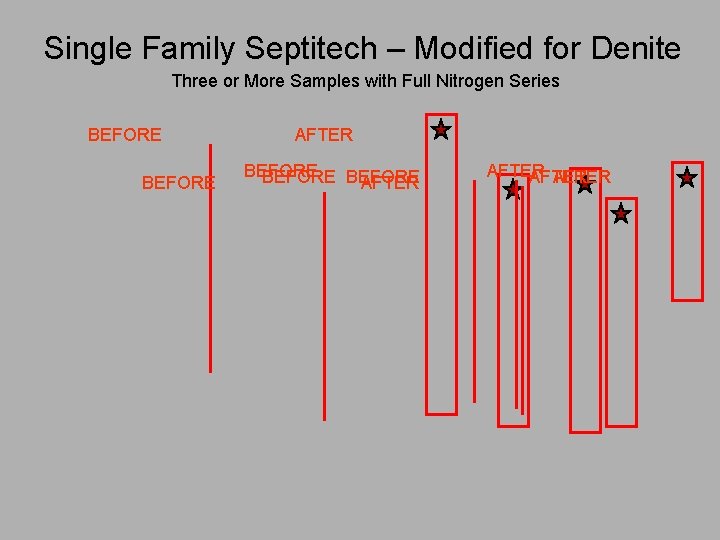
Single Family Septitech – Modified for Denite Three or More Samples with Full Nitrogen Series BEFORE AFTER BEFORE AFTER
Nitrex System at 15 Dory Lane, Eastham Influent versus Effluent Total Nitrogen Design Flow = 9, 900 gpd 40 Houses at Buildout 30 Houses currently occupied, with 6 seasonal Influent TN Effluent TN
Single Family all Types by System Type Three or More Samples with Full Nitrogen Series System Type Total with Total below Bourne Cape-Wide 3+ Samples 19 mg/l Percentage All Types 54 33 61% 75% Bioclere 2 1 50% 74% FAST 41 28 68% 80% OMNI RSF 2 1 (2 <25) 50% (100%) 51% (86%) RSF (Generic) 1 1 (1 <25) 100% (100%) 56% (63%) RUCK 1 0 0% 50% Septitech 7 2 29% 33%
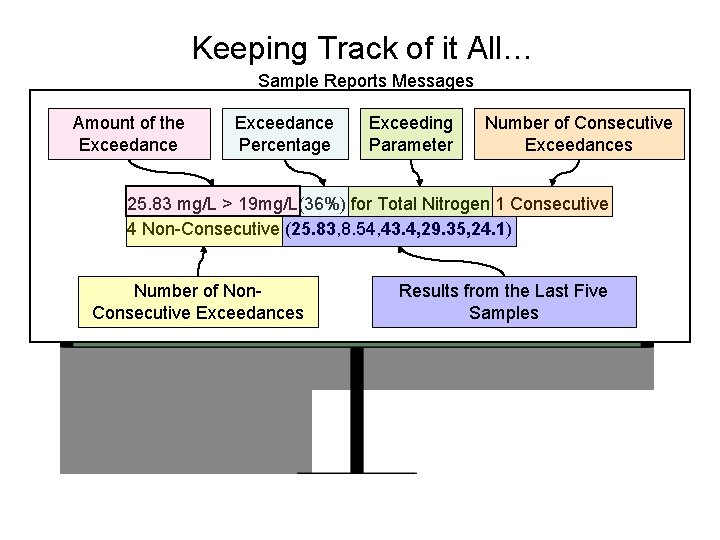
Keeping Track of it All… Sample Reports Messages Amount of the Exceedance Percentage Exceeding Parameter Number of Consecutive Exceedances 25. 83 mg/L > 19 mg/L(36%) for Total Nitrogen 1 Consecutive 4 Non-Consecutive (25. 83, 8. 54, 43. 4, 29. 35, 24. 1) Number of Non. Consecutive Exceedances Results from the Last Five Samples
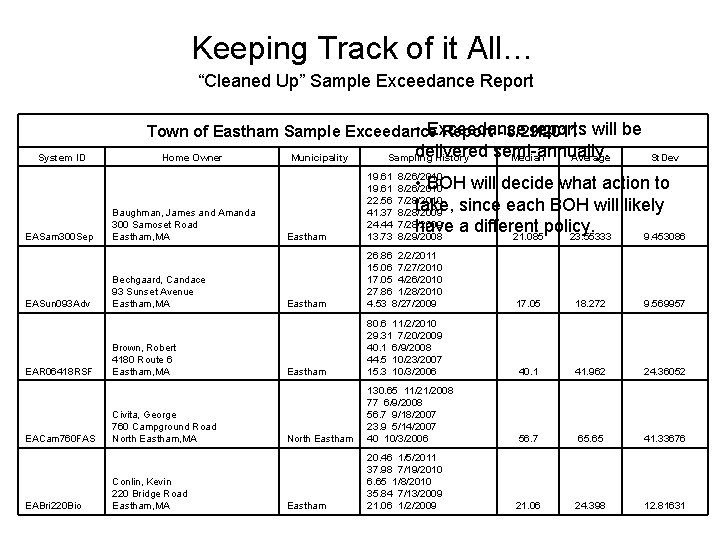
Keeping Track of it All… “Cleaned Up” Sample Exceedance Report • Exceedance reports will be Town of Eastham Sample Exceedance Report - 3/29/2011 System ID EASam 300 Sep EASun 093 Adv EAR 06418 RSF EACam 760 FAS EABri 220 Bio Home Owner Baughman, James and Amanda 300 Samoset Road Eastham, MA Bechgaard, Candace 93 Sunset Avenue Eastham, MA Brown, Robert 4180 Route 6 Eastham, MA Civita, George 760 Campground Road North Eastham, MA Conlin, Kevin 220 Bridge Road Eastham, MA Municipality delivered semi-annually. Median Average Sampling History St. Dev Eastham 19. 61 22. 56 41. 37 24. 44 13. 73 8/26/2010 7/28/2010 8/28/2009 7/28/2009 8/29/2008 Eastham 26. 86 2/2/2011 15. 06 7/27/2010 17. 05 4/26/2010 27. 86 1/28/2010 4. 53 8/27/2009 17. 05 18. 272 9. 569957 Eastham 80. 6 11/2/2010 29. 31 7/20/2009 40. 1 6/9/2008 44. 5 10/23/2007 15. 3 10/3/2006 40. 1 41. 962 24. 36052 North Eastham 130. 65 11/21/2008 77 6/9/2008 56. 7 9/18/2007 23. 9 5/14/2007 40 10/3/2006 56. 7 65. 65 41. 33676 Eastham 20. 46 1/5/2011 37. 98 7/19/2010 6. 65 1/8/2010 35. 84 7/13/2009 21. 06 1/2/2009 21. 06 24. 398 12. 81631 • BOH will decide what action to take, since each BOH will likely have a different policy. 21. 085 23. 55333 9. 453086
Innovative/Alternative Septic System Performance and Tracking it with the Carmody Database Barnstable County Department of Health and Environment