Influenza Surveillance in the United States Oliver Morgan


")


 • ~2, 400 healthcare providers in 50 states • Weekly")
 Reported by ILINet Week ending 07/04/2009 Note:")


")


- Slides: 57
Influenza Surveillance in the United States Oliver Morgan, Ph. D MSc Division of Emerging Infections and Surveillance Services Dr. Lyn Finelli, Scott Epperson Influenza Division Centers for Disease Control and Prevention
Objectives of Influenza Surveillance • Determine which influenza viruses are circulating; where are they circulating; when are they circulating • Determine intensity and impact of influenza activity • Detect unusual events – Infection by unusual viruses – Unusual syndromes caused by influenza viruses – Unusually large/severe outbreaks
Influenza Surveillance • Responsibility for national influenza surveillance rests with CDC • State and local public health departments are our primary partners • Review of surveillance held in 2006 & 2007 with Council of State and Territorial Epidemiologists (CSTE) – Build a system that is useful on the local level and builds to national level surveillance
The Five Categories of Influenza Surveillance • • • Viral Surveillance Mortality Surveillance Hospitalization Surveillance Outpatient Illness Surveillance Summary of the Geographic Spread of Influenza http: //www. cdc. gov/flu/weekly/
The Five Categories of Influenza Surveillance • Viral Surveillance – WHO (World Health Organization) and NREVSS (National Respiratory and Enteric Virus Surveillance System) Collaborating Laboratories – Novel influenza A virus surveillance • • Mortality Surveillance Hospitalization Surveillance Outpatient Illness Surveillance Summary of the Geographic Spread of Influenza
Viral Surveillance • Viral surveillance is the foundation for influenza control efforts – Identify changes in circulating strains • Future vaccine strain selection • Assess current vaccine match • Identify viruses with pandemic potential – Establish seasonality • Timing of active surveillance • Timing of influenza control activities
Virologic Surveillance in the U. S. • ~150 participating laboratories – Specimens collected during routine patient care – Weekly reports • # specimens tested • # positive for influenza: type, subtype, age • Novel influenza A reporting – Made nationally notifiable condition in 2007
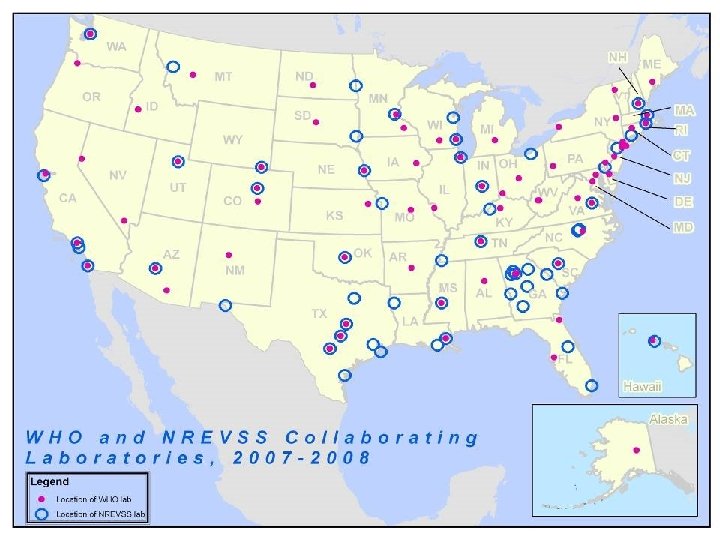
U. S. Virologic Surveillance: Participating Labs • WHO Collaborating Labs – ~ 85 labs – Maintained by ID/CDC – State health dept. , universities, large tertiary care hospital labs, and Do. D – Subtype influenza A – Report age data – Send subset of isolates to CDC for further testing • NREVSS labs – ~ 65 labs – Maintained by DVD/CDC – Hospital labs – Report data on other respiratory viruses – Less likely to subtype influenza A viruses – Don’t report age data – Data incorporated into flu surveillance since 97 -98
Viral Strain Surveillance • WHO labs submit subset of isolates to CDC strain surveillance lab • Detailed antigenic characterization • Sequencing of some isolates • Antiviral resistance testing – Adamantanes - when needed – Neuraminidase inhibitors - large subset
U. S. WHO/NREVSS Collaborating Laboratories National Summary, 2008 -09
The Five Categories of Influenza Surveillance • Viral Surveillance • Mortality Surveillance – 122 Cities Mortality Reporting System – Influenza-Associated Pediatric Deaths • Hospitalization Surveillance • Outpatient Illness Surveillance • Summary of the Geographic Spread of Influenza
122 Cities Mortality Reporting System • Purpose: monitor P&I related mortality in a timely manner • Weekly reports from vital statistics offices in 122 US cities – Total # of death certificates filed – # with pneumonia or influenza listed anywhere • ~ 1/4 of US deaths
Pneumonia and Influenza Mortality for 122 U. S. Cities Week Ending 07/04/2009 Epidemic Threshold Seasonal Baseline 2005 2006 2007 2008 2009
Pediatric Influenza-Associated Mortality Reporting • In June 2004, CSTE adopted proposal to make influenza -associated death in a person <18 yrs. a nationally notifiable condition. – Reporting began in October 2004 – Data reported weekly in MMWR and Flu. View
Number of Influenza-Associated Pediatric Deaths by Week of Death Week ending 07/04/2009 Deaths Reported Current Week Pandemic Influenza A (H 1 N 1) Deaths Reported Current Week Deaths Reported Previous Weeks Pandemic Influenza A (H 1 N 1) Deaths Reported Previous Weeks
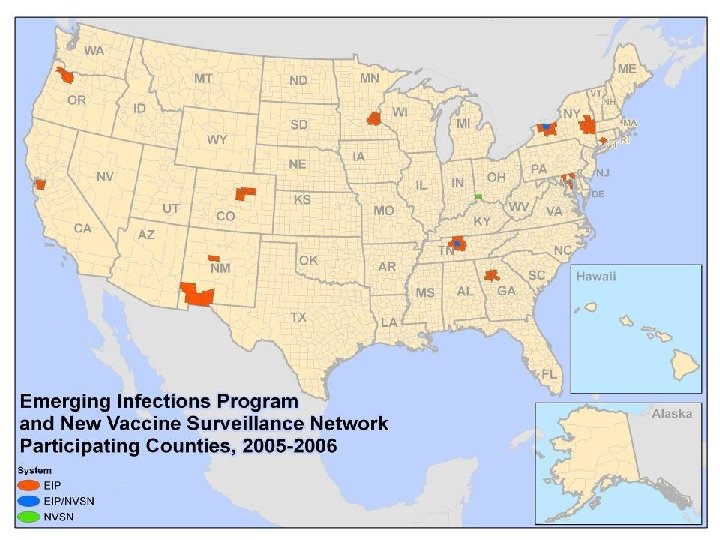
The Five Categories of Influenza Surveillance • Viral Surveillance • Mortality Surveillance • Hospitalization Surveillance – Emerging Infections Program (EIP) – New Vaccine Surveillance Network (NVSN) • Outpatient Illness Surveillance • Summary of the Geographic Spread of Influenza
Hospitalization Surveillance • Population-based surveillance for laboratory confirmed influenza related hospitalizations • Emerging Infections Program – All ages – Lab tests as part of routine patient care – Chart reviews • New Vaccine Surveillance Network – 0 – 4 year olds – Children admitted with fever or acute respiratory illness are swabbed and tested – Culture and PCR – Chart reviews
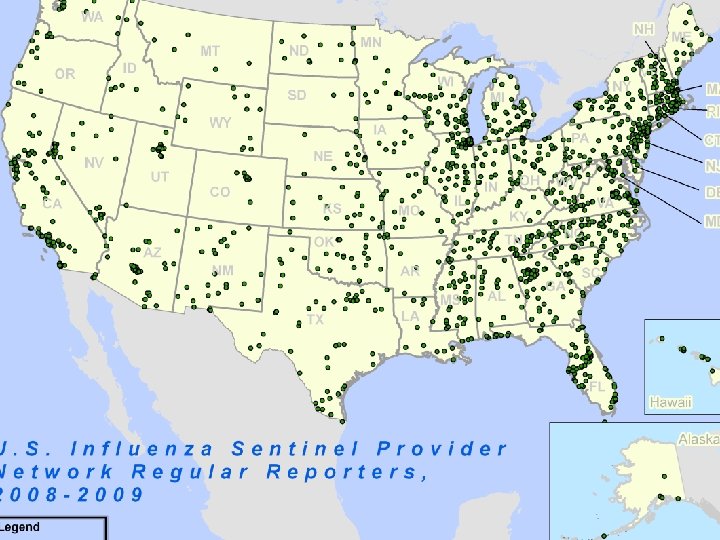
The Five Categories of Influenza Surveillance • • Viral Surveillance Mortality Surveillance Hospitalization Surveillance Outpatient Illness Surveillance – U. S. Influenza Sentinel Provider Surveillance Network (ILINet) • Summary of the Geographic Spread of Influenza
Outpatient Influenza Surveillance (ILINet) • ~2, 400 healthcare providers in 50 states • Weekly reports – Total # of patient visits – # visits for influenza-like illness (ILI) by age group • ILI = fever 100 ºF (37. 8 ºC) and cough or sore throat, in absence of a known cause other than influenza • Early, peak, and late season
Percentage of Visits for Influenza-like Illness (ILI) Reported by ILINet Week ending 07/04/2009 Note: There was no week 53 during the 2006 -07 and 2007 -08 seasons, therefore the week 53 data point for those seasons is an average of weeks 52 and 1.
The Five Categories of Influenza Surveillance • • • Viral Surveillance Mortality Surveillance Hospitalization Surveillance Outpatient Illness Surveillance Summary of the Geographic Spread of Influenza
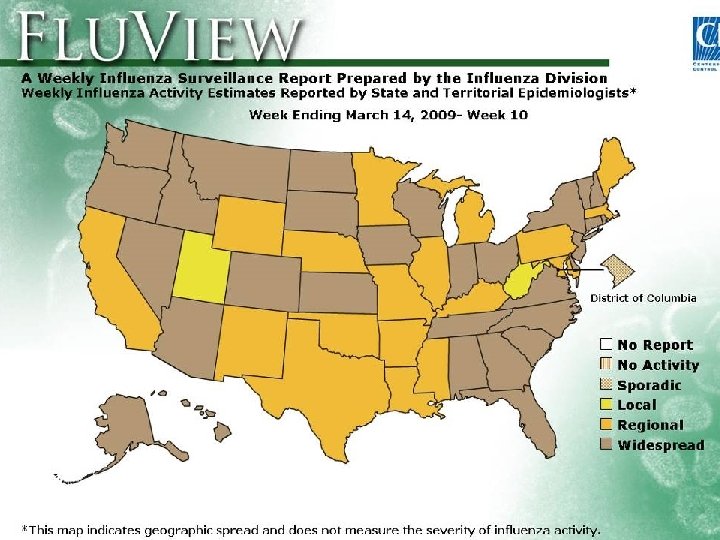
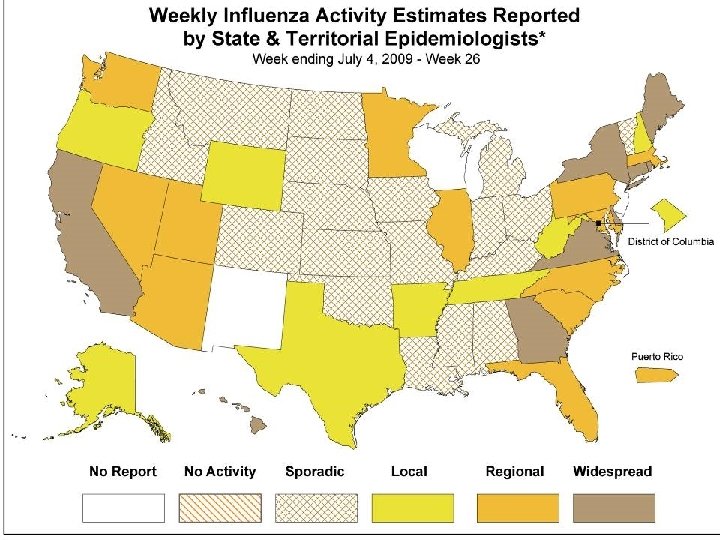
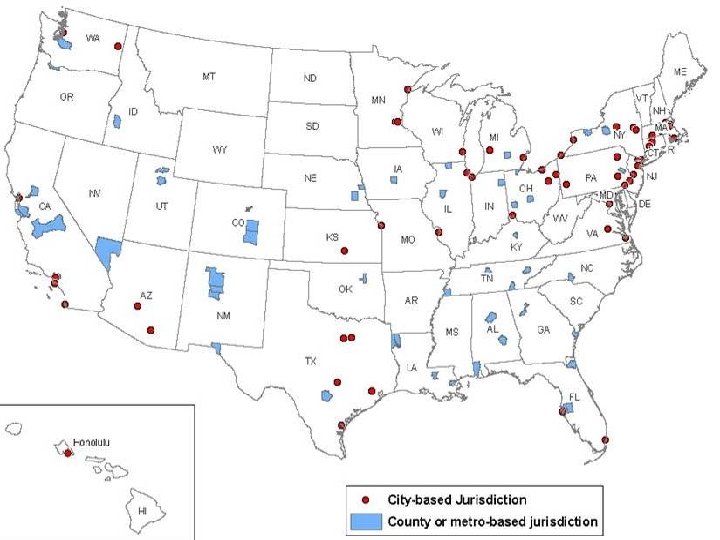
Geographic Spread of Influenza • Weekly reports from State and territorial epidemiologists • Assessment of overall influenza activity at state level – None, sporadic, local, regional, or widespread – Incorporates virologic and ILI data – Only system reporting state-level data • Allows local interpretation of surveillance data
Influenza Surveillance Challenges • Not everyone with influenza accesses healthcare • Can’t distinguish influenza from other respiratory viruses on clinical criteria – Most cases are not tested / lab confirmed • Volume – can’t test all respiratory cases • Not all cases will test positive – Many cases with severe influenza-related complications (hospitalization or death) – Timing of sample collection not optimal • Surveillance reports must be timely
Goals of Pandemic Influenza Surveillance 1. 2. 3. 4. 5. 6. Identify and track viruses/strains Describe clinical infections Determine who is affected and the severity of the pandemic Detect the onset and duration of the pandemic and the geographic spread Guide interventions Provide information to partners
Pandemic Influenza Intervals C Initiation A Investigation B Recognition D Acceleration E Peak Transmission F Deceleration G Resolution
Pandemic Surveillance Framework • Pandemic intervals as framework • Develop interval-specific surveillance strategy based on information we need for action • Use combinations of surveillance systems to collect the data necessary to address the goals of surveillance for each interval • Feasible and sustainable approach to pandemic surveillance
C A D E F G B Interval A Investigation Interval A Triggers Identification of human cases of novel influenza A Federal Actions Maintain surveillance Support investigation/containment Characterize viruses Reporting Frequency WHO & NREVSS Collaborating Laboratories Weekly Novel Influenza A Virus Infections Daily 122 Cities Mortality Reporting System Weekly Influenza Associated Pediatric Mortality Daily EIP Influenza Surveillance Network Bi-Weekly New Vaccine Surveillance Network Bi-Weekly State and Territorial Epidemiologists Report Weekly Sentinel Provider Surveillance Network Weekly Aggregate case reporting NR
C A B D E F G Interval B Recognition Interval B Triggers Confirmation of human cases and demonstration of efficient and sustained human to human transmission Federal Actions Maintain surveillance Deploy responders Evaluate case fatality ratio and PSI Reporting Frequency WHO & NREVSS Collaborating Laboratories (subset) Daily Novel Influenza A Virus Infections Daily 122 Cities Mortality Reporting System (web-based) Daily Influenza Associated Pediatric Mortality Daily EIP Influenza Surveillance Network Bi-Weekly New Vaccine Surveillance Network Bi-Weekly State and Territorial Epidemiologists Report Weekly Sentinel Provider Surveillance Network (subset) Daily Aggregate Case Reporting NR
C A B D E F G Interval C Initiation Interval C Triggers Laboratory confirmed human cases detected in any state Federal Actions Maintain surveillance Conduct lab confirmation and characterize viruses Deploy responders/SNS Evaluate case fatality ratio and PSI Reporting Frequency WHO & NREVSS Collaborating Laboratories (subset) Daily Novel Influenza A Virus Infections Daily 122 Cities Mortality Reporting System (web-based) Daily Influenza Associated Pediatric Mortality Daily EIP Influenza Surveillance Network Weekly New Vaccine Surveillance Network Weekly State and Territorial Epidemiologists Report Daily Sentinel Provider Surveillance Network (subset) Daily Aggregate Case Reporting NR
C A B D E F G Interval D Acceleration Interval D Triggers Multiple laboratory confirmed cases in a state without epi-link Federal Actions Maintain surveillance Conduct lab confirmation and characterize viruses (targeted) Studies of clinical course Evaluate case fatality ratio and PSI Reporting Frequency WHO & NREVSS Collaborating Laboratories (subset) Daily Novel Influenza A Virus Infections Daily-NR 122 Cities Mortality Reporting System (web-based) Daily Influenza Associated Pediatric Mortality Daily EIP Influenza Surveillance Network Weekly New Vaccine Surveillance Network Weekly State and Territorial Epidemiologists Report Daily Sentinel Provider Surveillance Network (subset) Daily Aggregate Case Reporting Daily
C A B D E F G Interval E Peak Transmission Interval E Triggers >10% specimens submitted from states + for pandemic strain Federal Actions Continue virologic characterization Maintain surveillance Transition to surveillance for mortality and syndromic disease Reporting Frequency WHO & NREVSS Collaborating Laboratories (subset) Daily Novel Influenza A Virus Infections NR 122 Cities Mortality Reporting System (web-based) Daily Influenza Associated Pediatric Mortality Daily EIP Influenza Surveillance Network Weekly New Vaccine Surveillance Network Weekly State and Territorial Epidemiologists Report Daily Sentinel Provider Surveillance Network (subset) Daily Aggregate Case Reporting Daily-Weekly
C A B D E F G Interval F Deceleration Interval F Triggers <10% specimens submitted from states + for pandemic strain Federal Actions Continue virologic characterization Maintain surveillance for mortality and syndromic disease Reporting Frequency WHO & NREVSS Collaborating Laboratories (subset) Daily Novel Influenza A Virus Infections NR 122 Cities Mortality Reporting System (web-based) Daily Influenza Associated Pediatric Mortality Daily EIP Influenza Surveillance Network Weekly New Vaccine Surveillance Network Weekly State and Territorial Epidemiologists Report Daily Sentinel Provider Surveillance Network (subset) Daily Aggregate Case Reporting Daily-Weekly
C A B D E F G Interval G Resolution Interval G Triggers <1% specimens submitted from states + for pandemic strain during a two-week period Federal Actions Return to routine virologic testing Maintain surveillance for mortality and syndromic disease Reporting Frequency WHO & NREVSS Collaborating Laboratories (subset) Weekly Novel Influenza A Virus Infections NR 122 Cities Mortality Reporting System (web-based) Weekly Influenza Associated Pediatric Mortality Daily EIP Influenza Surveillance Network Weekly New Vaccine Surveillance Network Weekly State and Territorial Epidemiologists Report Weekly Sentinel Provider Surveillance Network (subset) Weekly Aggregate Case Reporting Weekly-NR
Pandemic Surveillance C Initiation A Investigation D Acceleration B Recognition Rapid spread within a jurisdiction Multiple lab-confirmed cases w/o an epi link ? E Peak Transmission F Deceleration G Resolution
Surveillance Realities • Few hospitalizations and deaths – Rethink our strategy • Mild to moderate clinical illness • Age distribution of cases and persons hospitalized similar to that of seasonal H 1 N 1
Surveillance Realities • Needed to re-focus surveillance – ILINet has been our lifeline to influenza activity – Aggregate reports and line listed data • Limited by testing practices – Need for information about burden of illness and clinical spectrum • Community Household Surveys – Need for information about what states are doing and can do • Rapid Survey of Surveillance Activities in states • ILINet, other systems, lab and testing
Surveillance Planning • Dynamic situation – Information requirement modulated by • pandemic interval • severity of illness • planning public health interventions (vaccine, hospital surge, stockpile) • hypothesized “mixed” season with 5 viruses circulating • hypothesized increase in transmissibility of the virus
Surveillance Planning • Summer – Option 1 Current Strategy • Weekly aggregate reporting • ILINet (subset) • Automated syndromic systems • WHO/NREVSS daily (subset) – Option 2 Scale back • D/C weekly aggregate reporting (states post case counts? ) • ILINet Weekly • WHO/NREVSS weekly
Surveillance Planning • Fall – Option 1 Continue Current Summer Strategy • Weekly aggregate reporting • ILINet daily (subset) • Automated syndromic systems (Bio. Sense, etc) • WHO/NREVSS daily (subset) – Option 2 Scale Up • Return to daily line listed case reporting or web based CRF – Staggered reporting of CRF • Hospitalization case reporting (long or shorter form) – First “ 200” or EIP if widespread • Other systems daily
Next steps • Convene CSTE working group comprised of state Epidemiologists and surveillance coordinators
Additional Information • CDC/Influenza Division Flu. View surveillance report – Weekly from October through mid-May – http: //www. cdc. gov/flu/weekly/fluactivity. htm • General influenza information – http: //www. cdc. gov/flu/ • Avian influenza information – http: //www. cdc. gov/flu/avian/ • Pandemic influenza – http: //www. pandemicflu. gov/
Influenza Surveillance Regions Pacific - 9 Mountain - 8 West North Central - 4 East North Central - 3 Mid Atlantic - 2 New England - 1 South Atlantic - 5 East South Central - 6 Pacific - 9 West South Central - 7
Number of Specimens Tested for Influenza and Number Positive Season All labs # tested # positive 2002 -03 96, 871 9, 841 2003 -04 152, 262 25, 104 2004 -05 186, 478 24, 501 2005 -06 180, 961 21, 497 2006 -07 189, 415 23, 941 2007 -08 * 235, 436 40, 167 *data as of July 18, 2008
National Center for Health Statistics Mortality Data • Provides a complete and more detailed record of cause of death • > 99% of all deaths in the US • Separate record for each individual – Basic demographic data – Date of death – Underlying & contributing causes of deaths • Data used for special studies – Mortality estimates obtained from mathematical modeling • Not available until ~ 2 yrs later
Growth of the Influenza Sentinel Physician Surveillance System * * As of 7/18/2008
Percentage of Visits for ILI Reported by Sentinel Providers, National Summary, 1997 -98 – 2007 -08 97 -98 98 -99 99 -00 00 -01 01 -02 02 -03 03 -04 04 -05 05 -06 06 -07 07 -08
Influenza Activity Levels • No Activity: No laboratory-confirmed cases of influenza and no reported increase in the number of cases of ILI • Sporadic: Small numbers of laboratory-confirmed influenza cases or a single influenza outbreak has been reported, but there is no increase in cases of ILI • Local: Outbreaks of influenza or increases in ILI cases and recent laboratory-confirmed influenza in a single region of the state • Regional: Outbreaks of influenza or increases in ILI and recent laboratory confirmed influenza in at least 2 but less than half the regions of the state • Widespread: Outbreaks of influenza or increases in ILI cases and recent laboratory-confirmed influenza in at least half the regions of the state. . .
Current Status of WHO System • >175, 000 isolates/yr (600 to 1200 M cases) • WHO CCs receive 6, 500 – 8, 000 samples/yr. • WHO CCs and NICs sequence HA of 1, 000 samples/yr; complete genomes now sequenced (e. g, members of GIP sequenced complete genomes of 20 H 5 N 1 viruses in few weeks) • >290 M doses of influenza vaccine w/wide
2007 -08 Surveillance Summaries
U. S. WHO/NREVSS Collaborating Laboratories National Summary, 2007 -08