United States of America United States Located in


 �Midwest �South �West – (Rocky Mountain and Pacific)")


- Slides: 40
United States of America
United States � Located in northwest hemisphere on the North American Continent which also consists of Mexico and Canada � Population: 314, 059, 724 � Language: no official language, although English is the most widely spoken � Religion – none
Federal republic President: Barack Obama Vice President: Joe Biden Capital: Washington, DC 50 states make up the USA
�Northeast ( New England Mid Atlantic) �Midwest �South �West – (Rocky Mountain and Pacific)
Read Section 7. 2 � USA – population 300 million (3 rd most populous country in the world after China (1. 3 billion) and India (1. 12 billion) � USA –consumed more than either of these � WHY? � USA–developed country
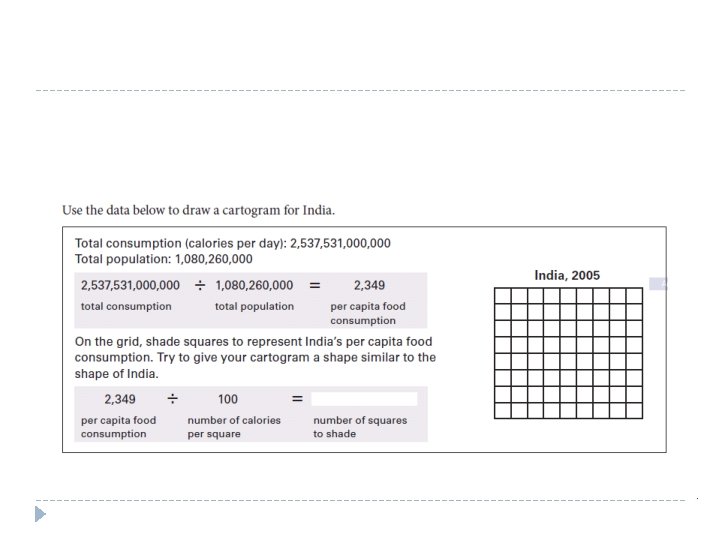
Understanding How Cartograms Are Constructed � Cartograms are special types of maps used to compare numerical data about different places. In a cartogram, the general shapes and locations of countries or regions are similar to those on a regular map. But the size of each country or region is drawn to match the numbers being studied. For example, per capita food consumption is the average number of calories consumed person, per day, in a given country. The first grid you see is a cartogram that shows per capita food consumption in the United States. The country is drawn as 39 squares. Each square represents 100 calories per capita per day. This cartogram represents the average number of calories consumed by each person, each day, in the United States.
Read through the example to see how the cartogram was made.
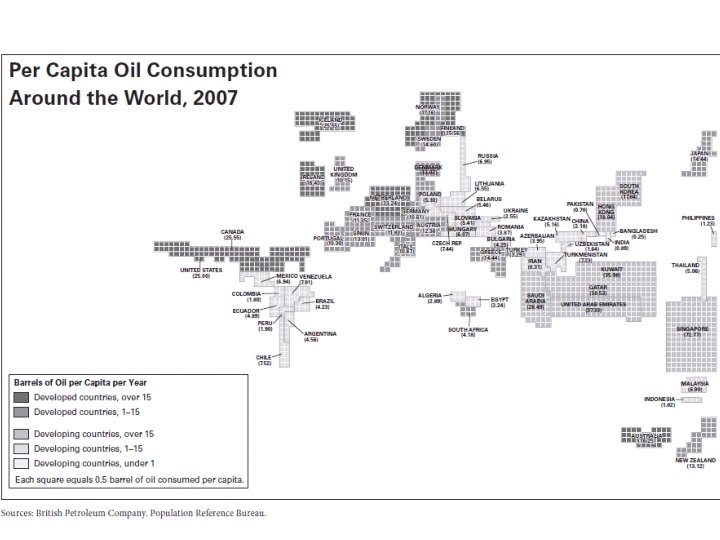
� Read over Oil Consumption Patterns � Picture morning rush hour in any city in the developed world, where the streets are filled with gas-guzzling cars, motorcycles, and buses. Now picture that same scene in a city in the developing world. You will still see lots of cars, buses, and motorcycles, but most people are riding bicycles or walking to work because they cannot afford the cost of using motorized transportation. � As these mental images suggest, oil, or petroleum, consumption follows a pattern similar to food consumption. Developed countries use more than developing countries. Oil is a fossil fuel[fossil fuel: any fuel, such as petroleum, coal, and natural gas, that is made from the remains of prehistoric plants and animals] that has many uses. It is refined into gasoline. It is used to make asphalt to cover roads. Petroleum is also used to make plastics, nylon, and other products.
� � Oil Fuels the Developed World Developed countries depend on oil to meet most of their energy needs. Their cars, trains, and planes burn fuels made from oil, and they use oil to heat buildings in the winter. Their power plants burn oil to generate electricity. The United States leads the world in oil consumption. Americans make up just 5 percent of the world population, but they consume 24 percent of the oil pumped out of the ground each year. Most of the oil Americans consume is burned as gasoline. Oil Use in the Developing World Is Growing As poor countries develop their economies, more of their people can afford luxuries like cars. Oil consumption is rising in many developing countries as a result. China is a good example. In 1990, there were slightly more than 5 million cars in China; 10 years later, China had more than 16 million cars. By 2025, that number could rise to more than 130 million. To keep all those cars running, China will need far more oil than it uses today. At present, there is enough oil to meet world demand. But oil will run out someday. Some experts expect oil production to peak around 2020. Others believe this peak could occur even earlier, after which oil production will begin to decline. If they are right, the world may face an oil shortage in the not-too-distant future.
� What is oil used for? � Which developed countries consume the most oil per capita? Why do you think that is? � Which developing countries consume the most oil per capita? Why do you think that is?
CORE CONTENT SS-HS-4. 2. 2 Students will explain how physical (e. g. , climate, mountains, rivers) and human characteristics (e. g. , interstate highways, urban centers, workforce) of regions create advantages and disadvantages for human activities in a specific place. DOK 2 � SS-HS-4. 3. 2 Students will explain how technology (e. g. , computers, telecommunications) has facilitated the movement of goods, services and populations, increased economic interdependence at all levels and influenced development of centers of economic activity. DOK 2 � SS-HS-4. 3. 1 Students will describe the movement and settlement patterns of people in various places and analyze the causes of that movement and settlement (e. g. , push factors such as famines or military conflicts; pull factors such as climate or economic opportunity) and the impacts in the modern world (1500 A. D. to present) and United States (Reconstruction to present). DOK 3 �
GEOTERMS �Metropolitan area – a major population center of a large city and smaller suburbs around it (LA) � Rural fringe – small towns, farms Just beyond a city’s suburbs
� Suburb – a developed area at the edge of a city that is mainly homes � Urban core – older part of a big city (downtown)
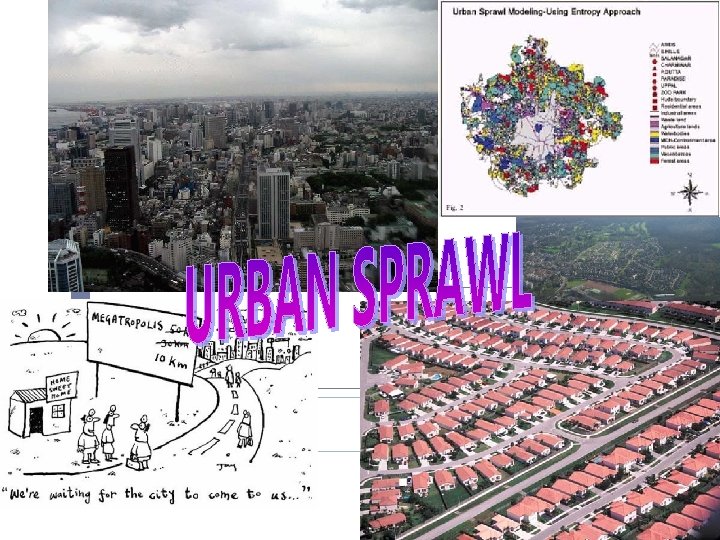
� Urban fringe – the ring � Urban sprawl – the of small towns and suburbs that surround a big city rapid often poorly planned spread of development from an urban area outward into rural areas.
Look at the graphic organizer on page 79 Essential Question �How does urban sprawl affect people and the planet?
� 8 out of 10 people in US and Canada live in a metropolitan area �Largest –NYC �In the past – people lived in the urban core – “walking city” �By 1900 –begin to move to outer city limits (rail) � 1920 - What developed so people could move to the urban fringe? � Cars – people moved to the suburbs as Well as businesses
Problems with urban growth � POSITIVES � Negatives � New � Destroying homes needed � Rural land is less expensive � Better place to raise a family � Creates jobs to build houses � New homeowners pay taxes plants and animals habitats � Heavy traffic jams � Pollution � Rising taxes which is needed to pay for roads, schools, etc.
Atlanta, GA � Now we are going to take a look at an example city who faced Urban Sprawl and what solutions the city developed.
� After reading Section 5. 8, identify three challenges facing Atlanta in 1998. � Record them in the boxes below. Draw a line from each box to the part of the city most affected by that problem. � What is the best policy?
�Atlanta boomed in the 1990 s, leading the nation in new jobs, homes, and highways. There was not enough room for all the people moving there to live within the city. �New homes were built at a rapid pace, and people who bought them relied on cars to get around. Air around the Atlanta area grew incredibly polluted. There were traffic jams day and night. �Hundreds of acres of forest were cut down each week to make room for new homes. The urban fringe sprawled into the rural fringe.
5. 9 Atlanta Fights Pollution with Public Transit � Read Section 5. 9 to find out what Atlanta did. Then complete the information below.
� Atlanta � The � 1. � 2. � 3. chose to: results of this policy were:
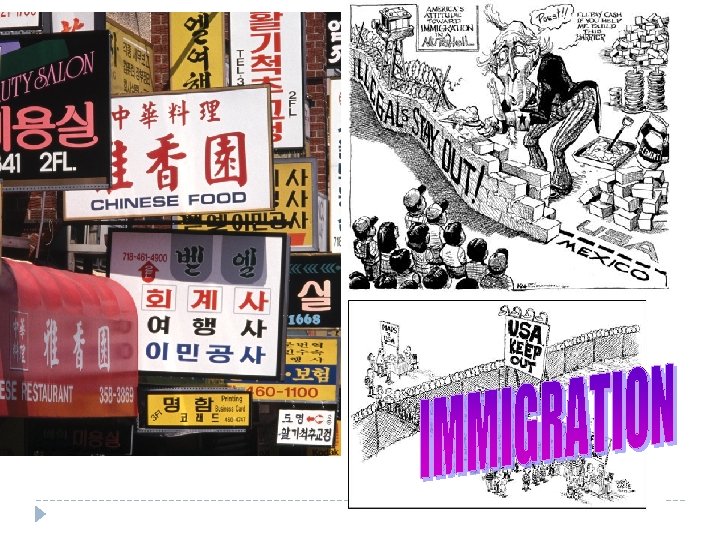
IMMIGRATION
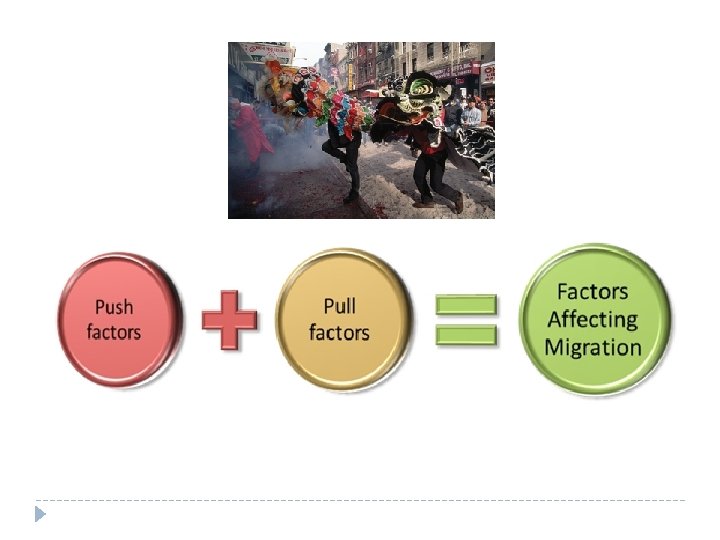
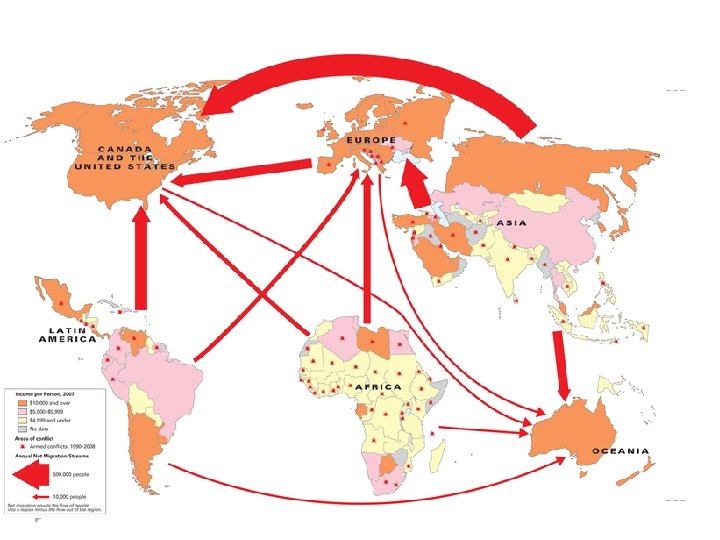
Essential Question: How does migration affect the lives of people and the character of places?
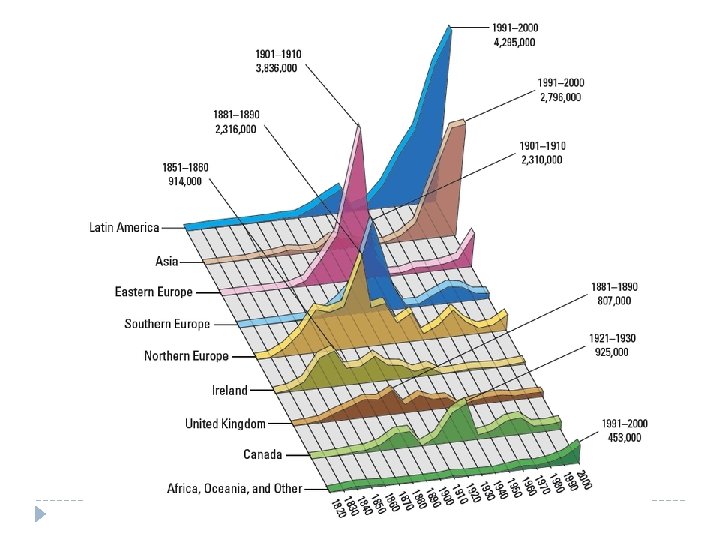
Looking at page 120 � 3 waves of immigration � 1 st –came from Europe � 2 nd –Eastern Europe � 3 rd wave – Asia and Latin America
3 What Push Factors Drive Emigration? � Examples of political push factors: � Examples of environmental push factors: � Examples of economic push factors:
4 What Pull Factors Draw Immigration? � Examples of quality-of-life pull factors: � Examples of family pull factors: Examples of education pull factors:
5 How Does Immigration Affect the U. S. ? � Examples of economic impacts (jobs): � Examples of economic impacts (taxes): � Examples of cultural impacts (neighborhoods, foods, and holidays):
6 How Does Emigration Affect the Homelands People Leave Behind? � Examples of economic impacts (brain drain and gain): � Examples of social impacts (divided families, community improvements): � Examples of political impacts (working for better government):