Inflation Part 2 and Unemployment Inflation terms revisited


 Date Value of Price Index Jan")


 August 2011 (severe slump) Overall 4. 6% 9.")


 1980 $269")


")
 •")


- Slides: 40
Inflation Part 2 and Unemployment
Inflation terms revisited: • Inflation: Dollar is losing value • Deflation: Dollar is gaining value • Disinflation: Slowing of the rate the dollar is losing value • Hyperinflation: Inflation out of control • Stagflation: Stagnation + Inflation = sitting at high inflation and unemployment
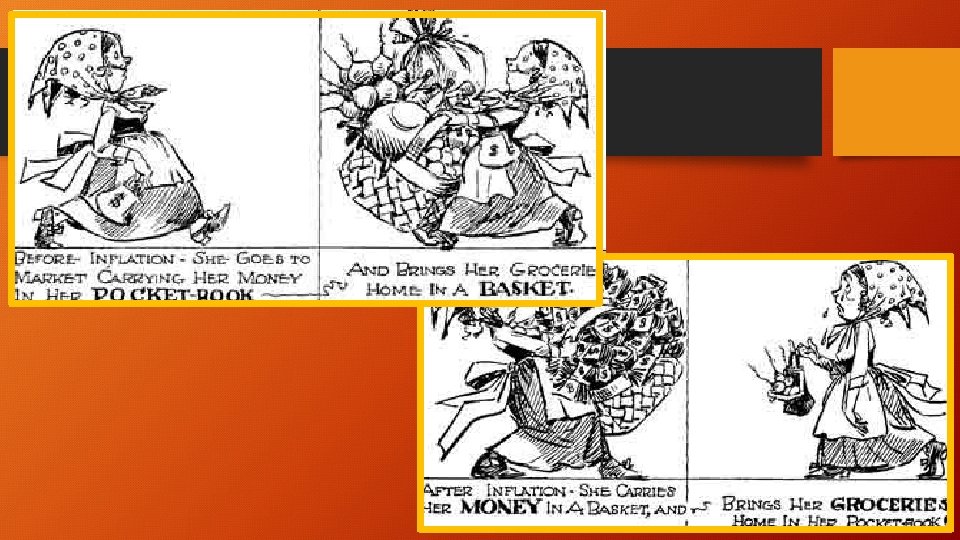
Hyperinflation
Germany and Hyperinflation (P = 100 in 1913) Date Value of Price Index Jan 1921 1400 Jan 1922 3700 Jan 1923 278, 500 Aug 1923 94, 400, 000 Sept 1923 (state of emergency declared) 2, 390, 000 Oct 1923 (failed Nazi coup 11/9/23) 709, 600, 000 Nov 15, 1923 (converted to new denomination) 75, 000, 000
Anticipated Inflation • Anticipated: Expected; consumers and businesses plan for it
Indexes • CPI= Consumer Price Index • Based on basket of goods from 1983 (between ‘ 82 -’ 83) • GDP Deflator • Based on general price index • = current basket of goods current price/current basket of goods at real price X 100 • PPI= Producer Price Index • Based on change in selling prices received by producers
Indexes continued • PCE= Personal Consumption Expenditure • Based on Consumer piece of the GDP
Unexpected Inflation Causes: Push • Causes are up for debate • Cost-Push: • Wages are exceeding productivity • Administered Prices • Market Structure • Invisible Handshake • 3 rd Party Payment Systems • Trade Restrictions
Unexpected Inflation Causes: Pull • Demand-Pull: • Government Deficit Spending • Transfer Payments • Automatic Stabilizers • Politics
Unanticipated Winners • High Incomes • Debtors • Hard assets • Exporters
Unanticipated Losers • Fixed incomes • Creditors • Importers • Consumers • “shoe leather costs” • Producers • Wealth Management
Sample problems: calculate Real Interest Rate End of Year CPI Nominal Real Interest Rate 1 100 2 110 15% 3 120 13% 4 115 8%
Labor and Unemployment • Working Age Population • Labor Force Participation Rate: Labor Force/Working Age Pop X 100 • Employment-Population Ratio = Total Employed/Total Population
Unemployment • Unemployment Rate = unemployed/labor force population X 100 • Who is considered “Unemployed”
Unemployment continued • Not in labor force if…
Types of unemployment • Frictional: choice, not a “fit” • Structural: change in firm/tech/marketing • Cyclical: business cycle changes • Seasonal:
Who is not counted as “unemployed”? • Discouraged • Marginally attached
Other problems with unemployment measurements • Dishonest workers • Involuntary parttime workers Source: BLS
* Source: BLS
Costs of unemployment: Economic • Economic: • Opportunity cost • Okun’s Law • For every 1% increase in unemployment = 2 -3% decrease in output
Costs of Unemployment: beyond monetary • Broader impact: • Psychological and physical impacts • Discrimination
Unemployment disparity August 2007 (full employment) August 2011 (severe slump) Overall 4. 6% 9. 1% Whites 4. 2 8. 0 Hispanics 5. 5 11. 3 Blacks 7. 7 16. 7
Sample problem: Freedonia uses the same method to calculate unemployment as the BLS. Compute their unemployment rate below. Population 60, 000 Under 16 9000 Over 16 In military service 600 In hospitals 60 In prison 200 Worked 1 hr or more in previous week 46, 000 Searched for work in previous 4 weeks 2140 Did not work in previous week, but would like a job if offered 200
Freedonia problems continued • A. How large is Freedonia’s labor force? • B. How many discouraged workers live in Freedonia? • C. How are missing citizens (not all are accounted for in the chart) classified? What might they be doing? • D. How many of Freedonia’s citizens are not in the labor force?
What is full-employment? • Natural rate of unemployment is about 5% in the U. S. in a normally functioning economy • Frictional + structural unemployment/labor force X 100 = natural rate of employment • Full employment is ≠ 100% • Level of employment corresponds with natural rate • Excludes cyclical unemployment
Some is okay • Some unemployment is alright • Frictional unemployment: moving to better jobs; better “fits”
Calculate Wages with inflation • Real Wage = Nominal Wage in that Year/CPI in that year X 100 Real earnings in 1980: $269/week / CPI of 86. 3 X 100 = $312 Real earnings in 2010: $751/week/ CPI of 219. 2 X 100 = $343
Practice with wages Year Nominal weekly Earnings CPI Real Earnings (1983 $) 1980 $269 86. 3 $312 1985 $348 109. 3 $318 1990 $417 133. 8 $312 1995 $482 153. 5 $314 2000 $581 174. 0 $334 2005 $658 196. 8 $334 2010 $751 219. 2 $343
Calculate Inflation and Real Hourly Wage Rate Year CPI Inflation Rate Nominal Wage (nom CPI – real CPI/real CPI) Real Wage wage/CPI) 1 100 $10. 00 2 110 $12. 00 3 120 $13. 00 4 115 $12. 75 (nom
How does this all fit together? The business Cycle: Times of Prosperity
During Recession (2 consecutive quarters of declining GDP)
During Depression (depends on source – 4 – 8 quarters of declining GDP) • 47 Recessions and Depressions in U. S. History: Panic of 1785 Mid 1800 s Panic of 1857 1873 1893 Depression of 1907 Depression of 1920 -1 Great Depression 1929
During Recovery
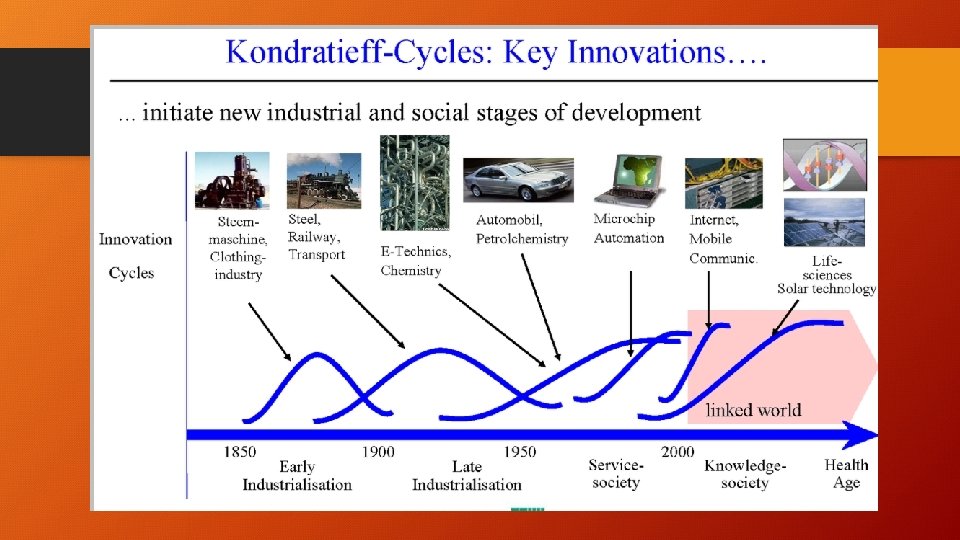
Kondratieff Wave • Theory of Cycle of business cycles: pattern of 50 -60 yrs • Cycle of prosperity preceded by population increases (includes immigration) • Leads to high demand • Producers can’t keep up with demands • High inflation • High credit use • Each cycle grows better with higher and higher inflation • Inflation devalues the dollar • Government is overturned • Downward part of cycle • Poverty and depression
1945 1929
Theories for Business Cycle • Over-production theory • Under-Consumption theory • Monetary theory • Imbalance between saving and investment
More theories on the business cycle • Psychological Theory • War Theory • Sunspot, Weather, Crop Theories • Innovation Theory • Self-Generating Theory