Inequalities in East Lothian Philip Conaglen Consultant in


 Population density = 154")


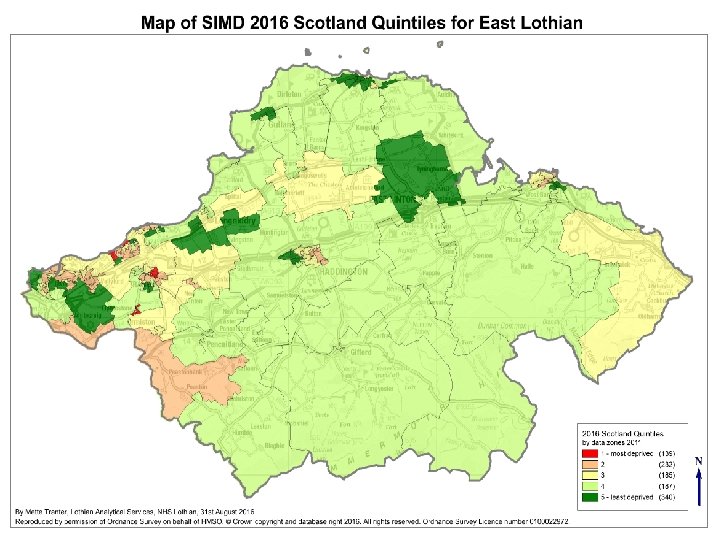
 Scotland (2015) East Lothian most deprived 15% (2009")


- Slides: 20
Inequalities in East Lothian Philip Conaglen Consultant in Public Health Medicine
People Ageing population, living longer with complex needs Increasing multi-morbidity High levels of mental health problems Increasing burden of non-communicable diseases Persistent health inequalities Increased expectations of health services Workforce System Recruitment and retention challenges Increased financial pressures on the health and social care system Advances in technology
We are more informed and empowered when using primary care Our primary care services better contribute to improving population health Our experience of primary care is enhanced Our primary care workforce is expanded, more integrated and better co-ordinated with community and secondary care Our primary care infrastructure – physical and digital – is improved Primary care better addresses health inequalities Scottish Government, 2018 Primary Care National Outcomes
4
5
Inequalities Unfair and avoidable differences in people’s health and wellbeing across social groups and between different population groups NHS Health Scotland
NHS Health Scotland
• • Population = 104, 840 (54, 617 female) Population density = 154 people per km 2 Births = 971 (10. 6 per 1, 000) Deaths = 1, 141 (10. 9 per 1, 000) Cause of death Cancers Circulatory system Respiratory Male 192 151 54 Female 167 145 76 Nervous system & senses 53 67 All other causes 107 129
Population projections
2016 population by deprivation East Lothian Scotland 27. 7% 26. 1% 22. 4% 19. 6% 20. 0% 20. 2% 2 nd Quintile 3 rd Quintile 4 th Quintile 20. 2% 20. 7% 3. 7% 1 st Quintile (Most Deprived) 5 th Quintile SIMD 2016
Life expectancy Geography East Lothian (2015) Scotland (2015) East Lothian most deprived 15% (2009 -2013) East Lothian least deprived 85% (2009 -2013) Male life expectancy Female life expectancy 78. 5 82. 1 77. 1 81. 1 74. 7 78. 8 78. 6 81. 9
East Lothian all-cause, age & sex standardised* under 75 year old mortality rates 2009 -2013 600 Deaths per 100, 000 500 400 300 200 100 0 1 2 3 4 5 most deprived 6 7 8 9 10 least deprived SIMD * European Standard Population NHS Lothian Analytical Services
Health and social inequalities Premature death, illness, poor health or wellbeing Less deprivation Those less well-off experience more ill-health, from a younger age and die younger
Index of: • Life expectancy • Math & Literacy • Infant mortality • Homicides • Imprisonment • Teenage births • Trust • Obesity • Mental illness – incl. drug & alcohol addiction • Social mobility Index of health and social problems Neither health nor social problems are related to national income per head Wilkinson & Pickett, The Spirit Level www. equalitytrust. org. uk
Index of: • Life expectancy • Math & Literacy • Infant mortality • Homicides • Imprisonment • Teenage births • Trust • Obesity • Mental illness – incl. drug & alcohol addiction • Social mobility Index of health and social problems Health and social problems are worse in more unequal countries Wilkinson & Pickett, The Spirit Level www. equalitytrust. org. uk
Patients in most deprived areas more psychological problems more long-term illness encounter length was generally shorter access to care generally took longer more multimorbidity more chronic health problems more problems to discuss (esp. psychosocial) satisfaction with access was significantly lower when dealing with psycho-social problems GP stress = higher; patient enablement = lower e. g. Mercer & Watt 2007 Annals of Fam Med
Research tells us what does not work to reduce inequalities § Information based campaigns and written materials § Campaigns reliant on ‘opt in’ § Approaches with price or other barriers § Programmes that raise costs
What works to reduce inequalities § Fiscal policies § Support for low and lower incomes § Reducing price barriers (access) § Structural changes in the environment § Legislative and regulatory controls § Services proportionate to need/ improving accessibility of services § Intensive support § Starting young
Further reading Materials around inequalities from NHS Health Scotland A straightforward overview of why more equal societies are better for everyone: Wilson & Pickett, The Spirit Level, 2009