Incorporating Climate Change Risk and Resilience into Hydrologic


- Slides: 19

Incorporating Climate Change, Risk, and Resilience into Hydrologic Design Procedures for Transportation Infrastructure: HEC-17 Roger Kilgore, Kilgore Consulting and Management George Herrmann, Desert Sky Engineering Wilbert O. Thomas, Jr. , Michael Baker International David Thompson, Thompson Hydrologics National Hydraulic Engineers Conference August 9 -12, 2016 Portland Oregon

Hydraulic Engineering Circular 17 (HEC-17) Title: Highways in the River Environment. Floodplains, Extreme Events, Risk, and Resilience. Part of FHWA’s implementation plan for the Federal Flood Risk Management Standard. Intent: Best available and actionable engineering and scientific data and approaches.

Table of Contents 1. Introduction 2. Floodplains and Federal Policies for Dev. 3. Riverine Flood Events 4. Nonstationarity and Climate Change

Nonstationarity Trend with time Possible causes Watershed changes n Climate changes n

Table of Contents 1. Introduction 2. Floodplains and Federal Policies for Dev. 3. Riverine Flood Events 4. Nonstationarity and Climate Change 5. Climate Modeling 6. Risk and Resilience

Risk and Resilience Consideration of more than one event in certain cases. Consideration of consequences and recovery.

Table of Contents 1. Introduction 2. Floodplains and Federal Policies for Dev. 3. Riverine Flood Events 4. Nonstationarity and Climate Change 5. Climate Modeling 6. Risk and Resilience 7. Analysis Framework 8. Case Studies

Analysis Framework (Chapter 7) Recognizes data and model uncertainty. Acknowledges that all plans and projects do not merit that same level of effort. Considers risks and service life. Can adapt as new methods and data become available.

Levels of Analysis 1. Historical discharges 2. Historical discharges/confidence limits 3. Historical discharges/confidence limits with precipitation projections 4. Projected discharges/confidence limits 5. Projected discharges/confidence limits with expanded evaluation

Tools – selected by design team

Hydrologic Analysis Tools

Other Tools Programmatic Tools: Methods recommended by region or state.

Confidence limits Broadens the range of evaluation; consideration of consequences resilience

Confidence Intervals Based on Hydrologic Service Life Example 68% confidence interval Design flow: 1000 cfs n 84% confidence limit – 1500 cfs n 16% confidence limit – 700 cfs n

Data

Climate Change Index A measure of projected versus historical precipitation

Emissions Scenarios and Climate Models Emissions scenarios: Representative Concentration Pathways (RCPs): 2. 6, 4. 5, 6. 0, and 8. 5 Global climate models: 12 – 21+ CMIP tool

Analysis Framework Recap Adapted to project criticality – majority of projects can be addressed by level 1 Flexible to incorporate programmatic information Broadens range of flows considered Decisions made by planning/design team

Thank you RKilgore@KCMwater. com
 Climate change 2014 mitigation of climate change
 Capital budgeting chapter
 Incorporating the change
 Uk climate resilience programme
 Pilot programme for climate resilience
 National risk and resilience unit
 Nn
Nn Hydrologic continuity equation
 Market risk assessment
 Incorporating quotes
 Incorporating pronunciation
 Incorporating in ohio
 Hydrologic engineering center
 Level pool routing example
 Hydrologic routing
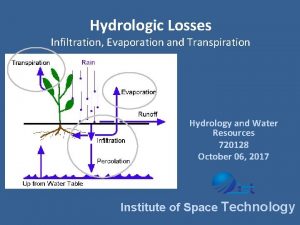
 Infiltration
 Storage equation
 Hydrologic abstractions
 Objectiveable
 Continuity equation hydrology


